


So who cares about monitoring the environment?
 You. Or, you should!
In this setting, we’re not talking about the environment in the same sense Greenpeace and the other environmental activist groups do.
Not to dismiss the importance of their work, we’re just having a slightly different focus in this room.
Anyway, what or who’s environment are we talking about? Your servers! Core infrastructure equipment! Even the hallway leading to your datacenter and for the HSE-aware, your own cubicles.
But why? We’re already monitoring everything else. We know when disks are running full, network utilization hits the roof and whenever a device goes down.
Sure. But do you in all cases know why? Could you have prevented it?
Let me throw a few real-world examples at you.
Sudden disappearance:
A friend and colleague of mine, like me, has a couple of servers running at home. Monitored by Zabbix of course.
Among those, an annoyingly well equipped file-server.
During the day, an email ticked in with absolutely no warning in advance, telling my friend this server was down. Just like that. No High CPU load, Low memory or any other indication it was about to crash.
That’s weird. But deadlocks happen. Maybe the power supply just gave up or something? He was going to check when he got back home.
He called me later that evening, reporting back that he found nothing.
Literally. Only a dust-free silhouette of where the file-server had been and some broken glass on the floor.
Disaster in slow motion:
I also heard of a company who had their own servers in-house and experienced 5 servers die in a row, with pretty much exactly 4 minutes between each one.
Anyone guessed polling interval? Nope, that was set to 30 seconds. Anyone wanna guess the order they stopped responding?
In the rack, from bottom to top, as the water level rose at a steady rate.
We’re covered!
Then we had that data center with redundant cooling systems. Aging, but redundant.
One day, the ambient temperature in the data-center rises at an alarming rate. Pun intended. Why did both coolers die at the same time?
Answer is, they didn’t. Cooler #1 died almost a week earlier, and cooler #2 worked itself to death to compensate.
This was not picked up, because they only measured average temperature in the middle of the room instead of multiple zones.
I have more, but I think you get where I’m going at.
What environmental factors, and why are they important?
Temperature:
I know I don’t need to explain to anyone reading this here how important temperature monitoring is, but bear with me:
All electronic equipment have a defined range of operating and storage temperature.
Running equipment at high temperatures over time can and most probably will seriously shorten its life expectancy.
But, what’s less known, but equally important is that what’s worse than high temperatures, are temperatures that fluctuate.
In electrical devices, fluctuations means that materials in ICs, boards, traces etc are expanding and shrinking more often, with the mechanical stress that comes with it. At some point, it will reach exhaustion, and break.
In a completely different industry, like grocery stores, having a record of the temperatures in the refrigerators 24 hours a day can be the difference between a normal Tuesday
and a lawsuit from angry customers with food poisoning.
Sadly, it’s not the last time power has been out during the night, allowing the content (meat, seafood, etc) to heat up, then freeze again when the power got back on, effectively making the expiration date way before the date that’s printed on the label while looking rather inconspicuous.
Humidity:
Also a no-brainer. Corrosion on PCBs is equally deadly as high or fluctuating temperatures.
But here, it’s a matter of balance. Too high, and your equipment will corrode, or worst case, condense and short-circuit.
Too low, and your cooling solution has to work much harder to sustain a decent temperature.
Light:
Who cares?
Well, depends on the scenario. For a large building, like a hotel without automation (key-card based switches etc), light sensors can uncover when power is wasted.
In data centers and security restricted areas, a light sensor can act as a simple presence detection.
For the hobbyist, it can be used to trend weather conditions (sunlight etc).
In some environments, light sensing can reveal the relationship between light (usually the sun) and heat.
Contact:
This can be a lot of things, but usually magnet switches to detect doors/windows/drawers/cabinets opening or closing, but also flood/leak detectors for those places with even a microscopic chance of sprung pipes or any device that has a relay output, like passive infrared sensors, smoke detectors and so on.
Enough talk, let’s have some visual examples, shall we?
Temperature affected by light:
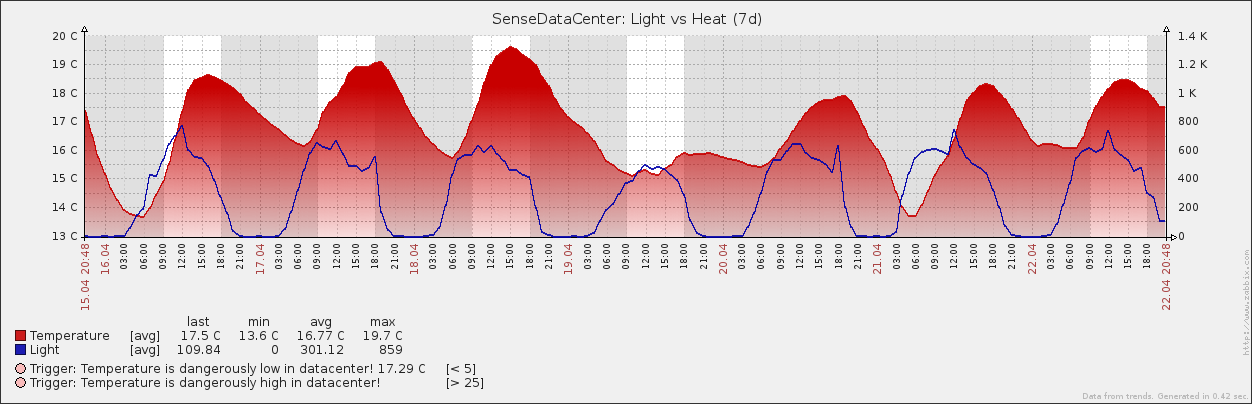
In this case, our data center has windows, allowing daylight – and at some point, direct sunlight – right in, clearly causing the temperature to fluctuate.
I’d shade those windows. Probably also attach shock sensors to them, so my servers won’t end up like my friend’s 24TB porn stack.
Slightly more advanced and nerdy:
Humidity and pressure:
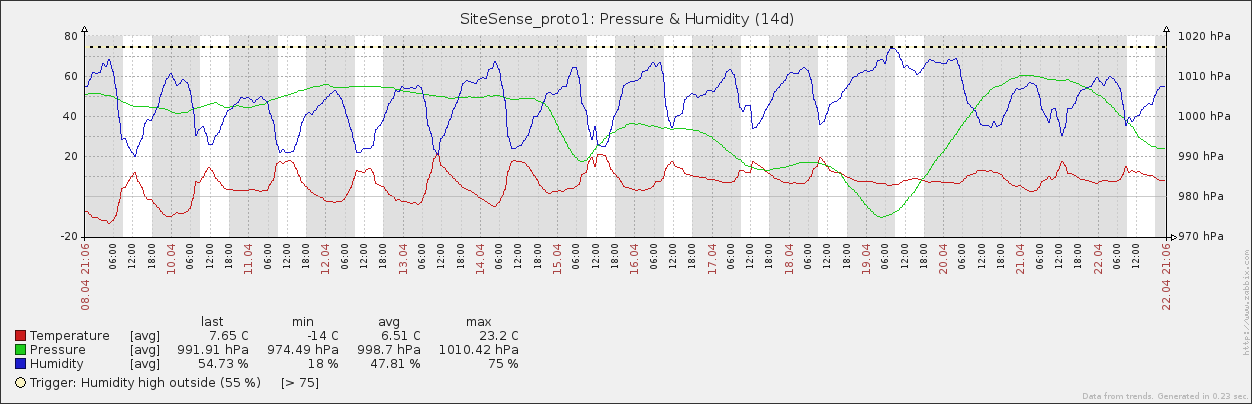
On the left Y axis, we have temperature in Celsius and relative humidity in percent. On the right, atmospheric pressure in pascal units.
We clearly see it gets misty at night. It’s still very early spring, and we had no rain during this period.
In the summer, the variations would look different.
If you had enough data, these three factors combined could be used to calculate the probability for lightning storms.
Personally, I’d throw in an actual lightning sensor for that.
That last example probably didn’t make much sense to anyone but the guy who is constantly watching it and the weather at the same time over a very long period and a variety of conditions.
Like everything that is being measured, we need a baseline, or a “this is normal” picture.
Let’s interpret a very real situation that happened to a customer of mine:
Failed Air conditioner:
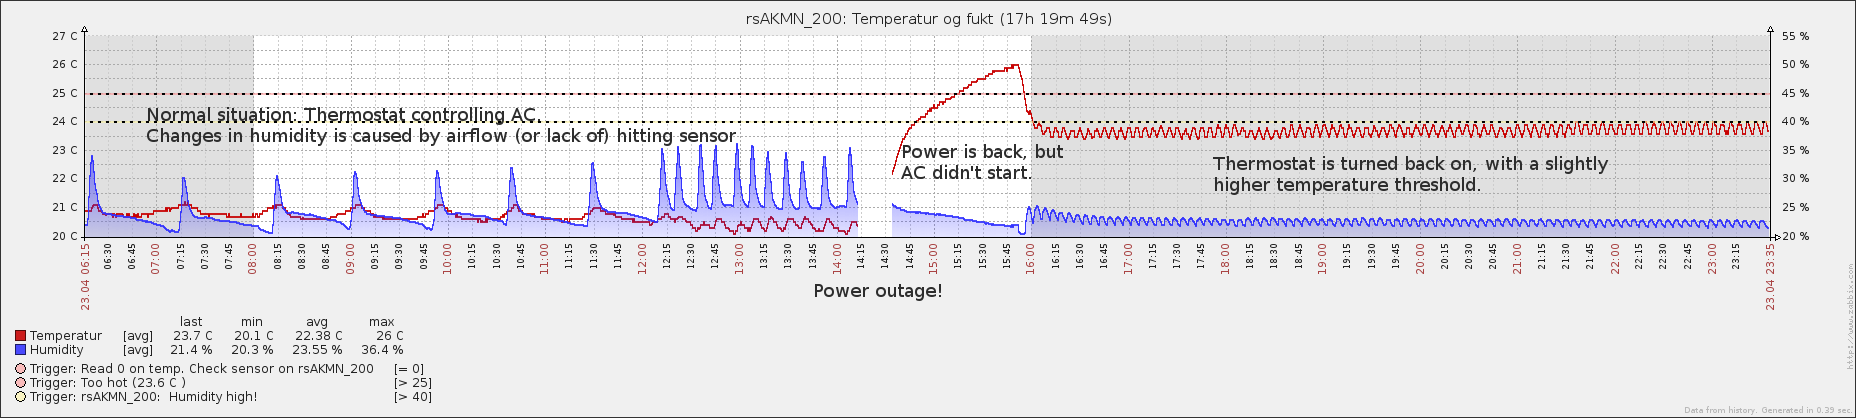
Here, we’re monitoring temperature (values in left margin ) and humidity (right) in a small room full of PoE switches. They have a floor standing air conditioner that tends to flake out. Here we have 1) Normal day-to-day situation, 2) Incident (power outage) 3) Temperature rising causing Zabbix to send us an alert and at last, 4) Situation under control, but with a new baseline.
Last, just for fun:
Outside lighting conditions where I live:
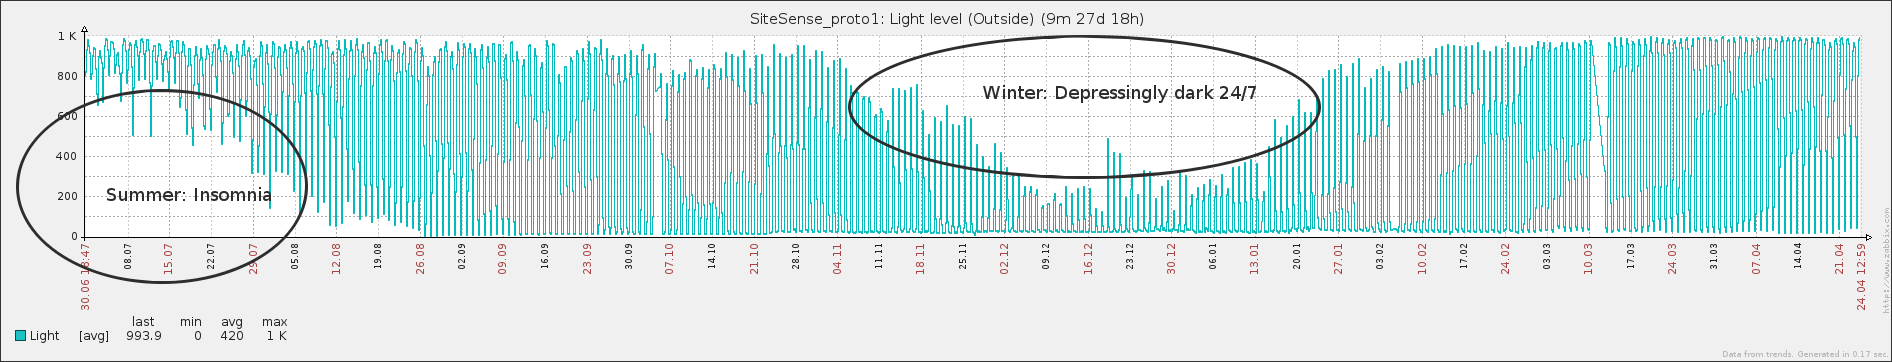
This is a simple ambient light sensor, so instead of LUX, it measures light in a scale from 0 (completely dark) to 1023 (sunlight, or a 80W light bulb up close).
Graphs are cool.. but not always the best way to visualize data. What about alarm relays, where the values are either ones or zeroes? On or off, open or closed, dry or a city-wide flood?
The latter would probably require an aggregated item, with values from a few more than one sensor, but it’s still binary and pretty useless in a graph.
Let’s make, with a Zabbix map and some hardware sensors, a clear overview of what’s happening in a building:
Home & office security system:
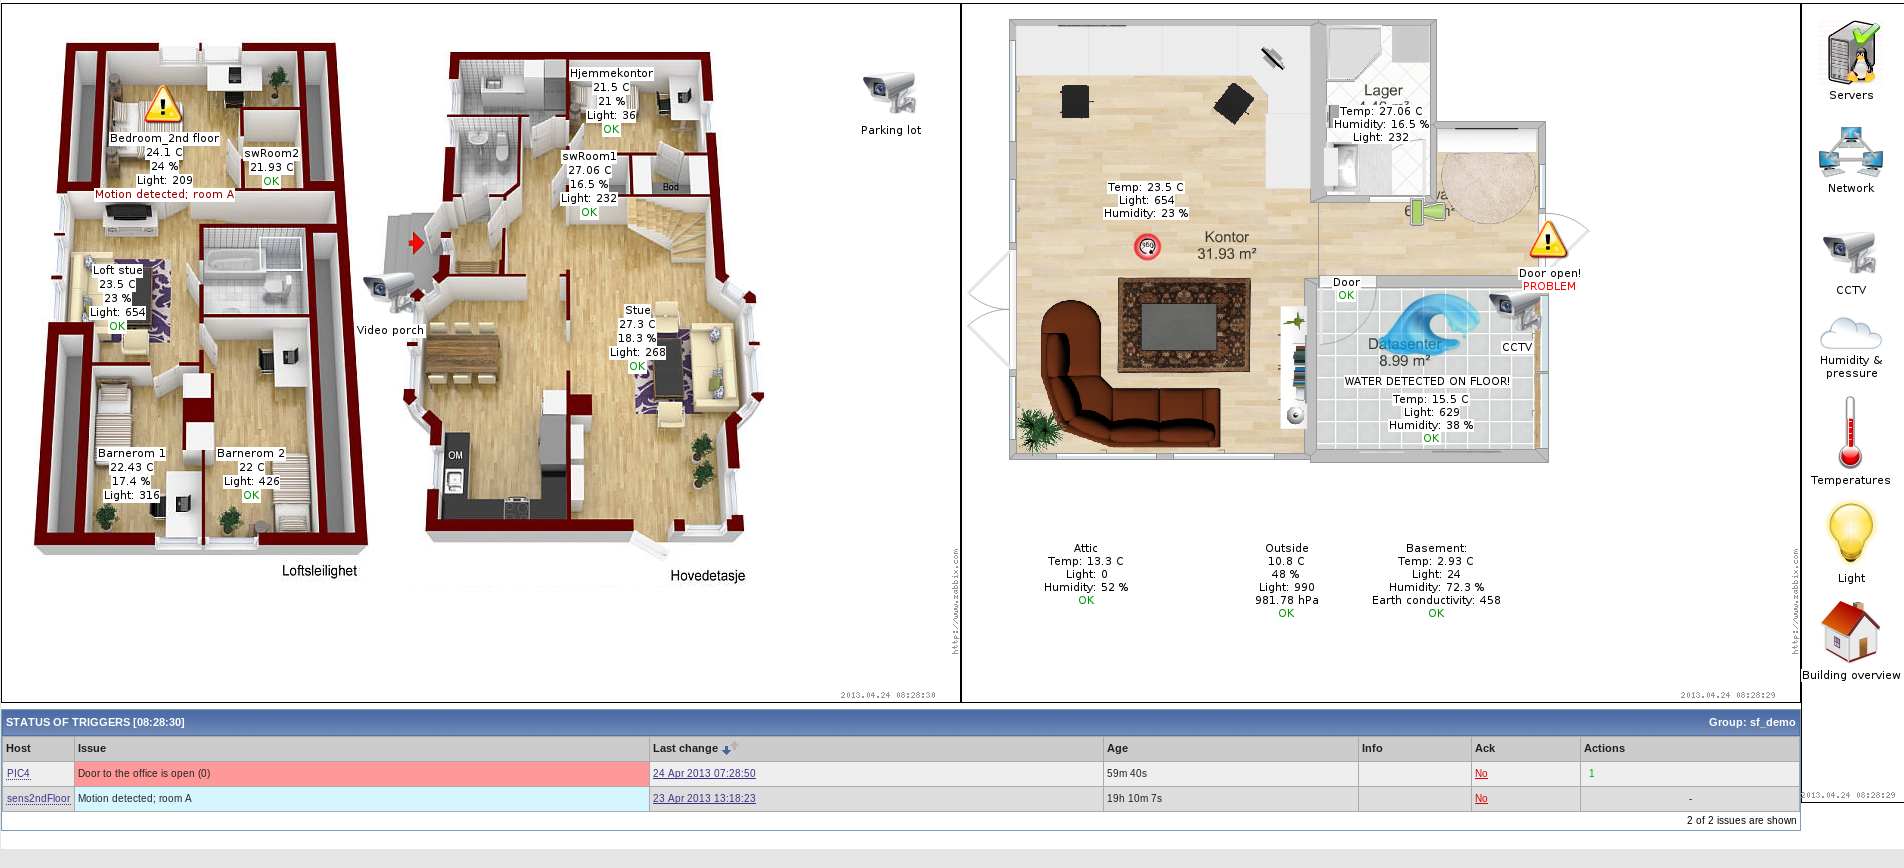
Pretty cool? It’s just a simple map with an equally sized background image. The values are the label on a 20x20px transparent PNG icon.
For normal state, the transparent PNG is shown. when it goes into problem state, a yellow exclamation mark is used instead.
This way, we have a nice clean picture of a building, but a clear deviation that catches your attention when it’s necessary.
A similar map could be used for office cubicles, with light, temperature and humidity thresholds within HSE regulations.
The icons in this map are a mix of hosts and single triggers. In some cases where one sensor covers only one room, “host” is appropriate.
In other cases, one sensor (or rather, a controller with many sensors) reaches into multiple rooms. On the map, these individual sensors are triggers.
See our demo site for more examples.
Thanks for reading!


Thanks for the great post! Just wondering what sensors do you use? Hardware, model?
I appreciate the feedback!
I didn’t go into the technical details with sensor types etc, because I own a company that makes and sells these kinds of sensors, and work for a company that does (environmental) monitoring with zabbix as a service.
The sensors I’ve used in the examples and my demosite are my own, but any SNMP capable device will do the job, depending on your needs.
Also, currently, I don’t ship outside of Norway, but if/when the demand is there, I will look into the logistics and expand.
If anyone is interested, I can do a technical followup, as I’m in the process of writing templates and LLD rules for my devices. (which could be relevant for other similar devices as well )
Really great post! I have plans to cover the same metrics, like temperatures, humidity etc., but I have same question as Alexei: which sensors to use?
Few months ago I did some research, but withnout any satisfaction. I found some sensors but they are i pricey or… weird. I need some simple sollution, my idea is simple LAN (POE) device with easy SNMP interface. And the price should be really less then fully equipped Android device… Any ideas?
Thank you, Maxim.
I can only speak for my own, and therefore not recommend any specific devices (but rather leave that to other members of this forum that is not biased 🙂 ), but I have to agree with you on that the majority of what you find out there are rather pricey and/or .. weird.
I’d use the word inflexible though. Which is one of the main reasons I started making them myself. But what is the price of a fully equipped Android device? I remember someone on the Zabbix forum built a temp+humidity sensor from Arduino part for $55, should the DIY route appeal to you.
I don’t mean to be vague and dismissive, but my focus is the cause, not a specific solution. I recommend googling some more, maybe start a forum thread?
If you then after some fair comparing think my company can be of service, you’re very welcome to contact us via our website.
When I look to the “Humidity and pressure” graph I recall about https://support.zabbix.com/browse/ZBXNEXT-932, heh …
Thank you Alf for great post !
Thanks
Yeah, hence my description “in left margin” etc.. 🙂
When we’re on feature requests, (and for those who saw my demo room), https://support.zabbix.com/browse/ZBXNEXT-1702 would be so cool to have 🙂
Then you could create a screen template for each room being monitored, with spesific maps, custom gauges and everything. If I had time and stronger php skills, I’d get on myself :s
I have at home IP SMART BOARD i use as termostat for gas cauldron and my home Zabbix monitored two temperater sensor.
Czech Blog
http://blog.smejdil.cz/2011/11/ip-smart-board-vs-zabbix.html
Hi,
great article.
Monitoring the enviroment was the first function i’ve used into our zabbix. I’ve to monitor the enviroment (temperature/huminity) into our server room.
I’ve use a simple SNMP-Device from HWg to do this. Now i’ve get an SMS by zabbix when the air conditioner is failing.
Meanwhile i made some test with an small smtp device that i found on ebay for 50€ (DAEnetIP2 from Denkovi Electronics). With this small device you can monitor 8 analog devices an 16 i/0 ports. Whith some sensors you can monitor nearly anything.
Thank you 🙂
We have a similar device now where you can daisy chain up to 16 sensors on standard cat5/6 cable over ~300 meters.
We’re planning to develop a Zabbix active agent firmware for it, but unfortunately no ETA. :\
Great post! I would like to ask, on the last picture the temperature values(labels) are just static text or is possible to show realtime values for example getting from an item?
thx
These are real-time values. You may put any information available to Zabbix there.
Sorry about the late reply, but yes, as Alexei says, those are item values.
You simply put a macro in the label, something like this:
Livingroom
{LGN-SiteSense01:SiteSensor.temp[Temp_humid_stue].last(0)}
{LGN-SiteSense01:Humidity[Temp_humid_stue].last(0)} RH
Thats:
{host:Item[….].function(time/amount)}