


Monitoring a Starlink Dish with Zabbix

Latest articles

Achieving 100% Observability with BIND and Zabbix

July 29, 2026
Case Study
Argentina’s BIND Group is a diversified financial services ecosystem centered around BIND Banco Industrial, offering banking, investment, insurance, leasing, fintech, and digital payment solutions.

The Evolution of an SNMP Auto-Discovery Tool

July 15, 2026
How To
Buckle up for the story of how we went from drowning in snmpwalk output to building a device-centric path toward Zabbix 7 walk-based templates.

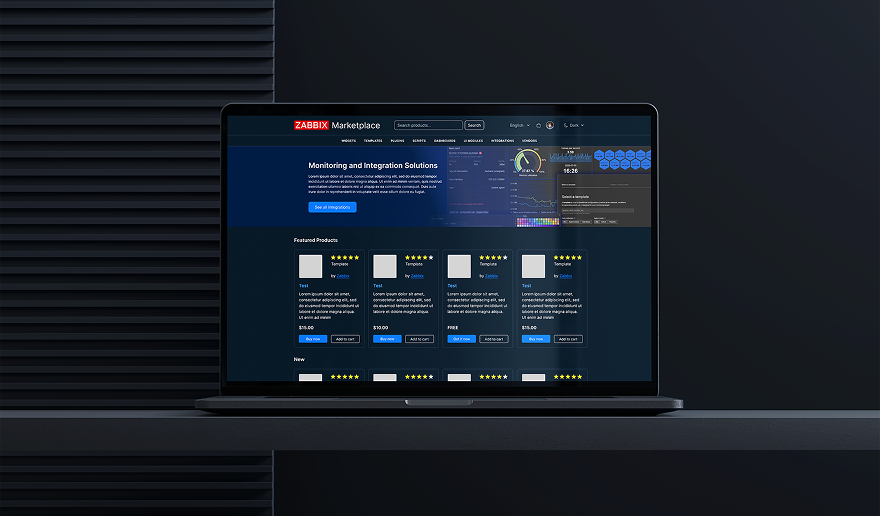
Discover More with Zabbix Marketplace
July 1, 2026
Community
What if extending Zabbix was as easy as browsing an app store? Zabbix Marketplace is a new, centralized hub built to help users quickly discover integrations, extensions, templates, and observability solutions.
Exploring AI Integration in Zabbix with Gemini and WebMCP

June 9, 2026
Integrations
When I first started working with Zabbix in banking and telecommunications over a decade ago, the workflow was always the same: something breaks, an alert fires, you open the dashboard, you diagnose, you fix. Every step required a human sitting in front of a screen reading charts and making decisions.
Upgrading Fedora with Zabbix and Ansible
May 20, 2026
Case Study
Fedora is a global open source project and Linux distribution that provides a platform for innovation and collaboration. Its infrastructure is managed by a dedicated team of professionals and volunteers who maintain a wide array of services, from build systems to collaboration platforms. The challenge For many years, Fedora relied on Nagios for its primary […]
Zabbix and the Docker API, Part 3: Control

May 6, 2026
Handy Tips
In this blog post, you will learn how to add a simple container remote control capability to Zabbix in order to start, stop, or restart containers from within the discovered host.
Zabbix and the Docker API, Part 2: Adapt
April 29, 2026
Handy Tips
In this blog post, I will show you how to create a template for monitoring your Docker server with only API calls (without the Zabbix agent 2). Instead of creating a template, templated items, LLD rules, and trigger prototypes from scratch, we will adapt them from the existing template “Docker by Zabbix agent 2.” How […]
Zabbix and the Docker API, Part 1: Inspect
April 22, 2026
Handy Tips
In this blog post, I will show you how to configure Zabbix to securely gather Docker API metrics using the Zabbix HTTP agent item with certificate authentication. This guide will cover configuring the Docker API and the Zabbix server side to gather data more securely. Getting the data to Zabbix from the Docker API By […]
