In this blog post, I will show you how to detect performance issues in your Zabbix instance – in advance!
You might be using Zabbix to monitor your infrastructure, devices, and applications, but are you also monitoring your own instance? It might seem unnecessary – after all, what’s there to monitor, right? Your instance just works, so everything is good. What else is needed?
Remember though, if your Zabbix database system runs out of disk space, data collection will come to a halt. If the data collectors are insufficient, the collected data will be inconsistent, and this will also affect the problem detection.
If you run out of cache space on your Zabbix server, depending on which cache is affected, your Zabbix server might crash immediately or experience degraded performance. A lot of things can go wrong, and you need to stay ahead of them! Here’s how.
Tune your database
If you are using the default settings for your database, you are missing out on significant performance improvements that are just unused! Your actual instance performance is tied to the database performance. If the database performance is low, you will have a degraded Zabbix monitoring experience as well.
Do at least minimal fine-tuning, only change the settings you understand: read the documentation, check the official Zabbix blogposts, Zabbix community forum, and perform testing. Of course, you can use every tool at your disposal to make it work, such as AI, but always test the settings in the test environment.
The database tuning is a complex task. Initial parameters that you could tune for the MySQL DB are these:
innodb_flush_log_at_trx_commit = 0
innodb_flush_method = O_DIRECT
optimizer_switch=index_condition_pushdown=off
innodb_buffer_pool_size= ~75% of RAM if only DB engine running or less if shared with other applications
For a PostgreSQL database, you can use online tuner PGTUNE for initial configuration:
https://pgtune.leopard.in.ua/
Monitor the Zabbix database
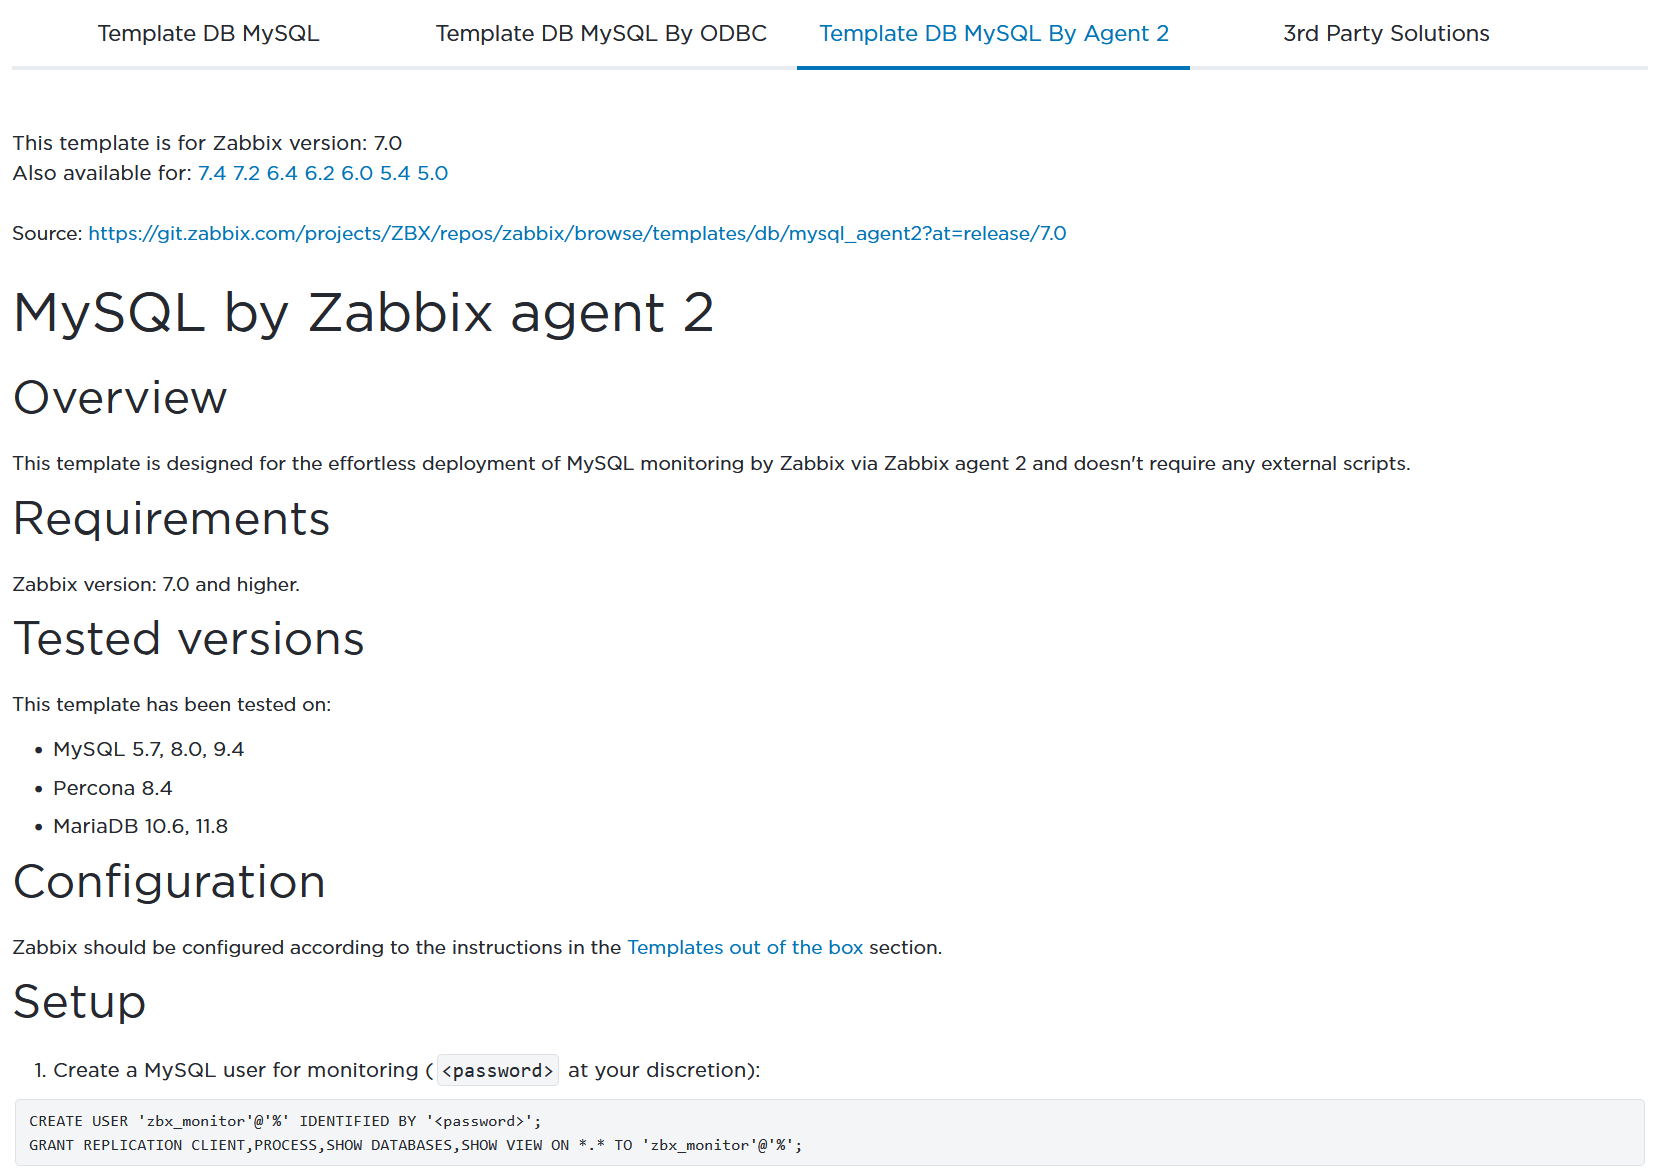
It is important to monitor your database. Zabbix offers several out-of-the-box options to monitor the most popular databases through different methods: either by Zabbix agent or Zabbix agent2, by ODBC checks, using Zabbix Java gateway or by HTTP checks. If an issue is detected, you will get a corresponding problem event. Don’t forget to manually update the old Zabbix templates to the current version after the Zabbix server upgrades.
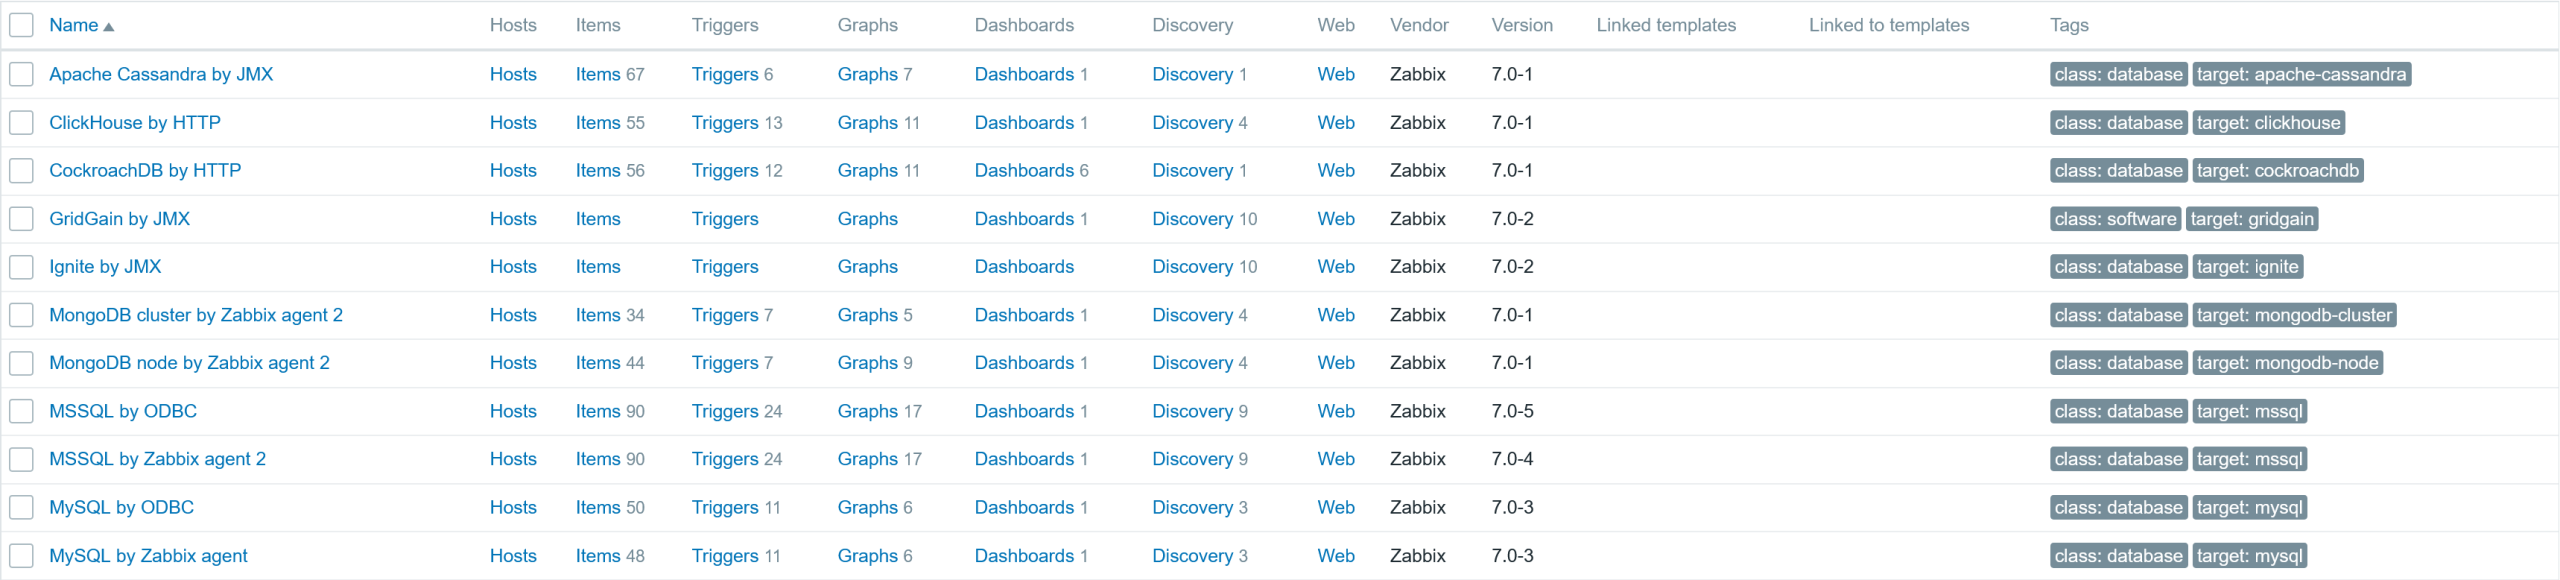
Of course, depending on the approach you have selected to monitor the database, you will need to do some additional steps for that to work. More information on how to configure it is available on the Zabbix integration page.
Monitor the Zabbix server
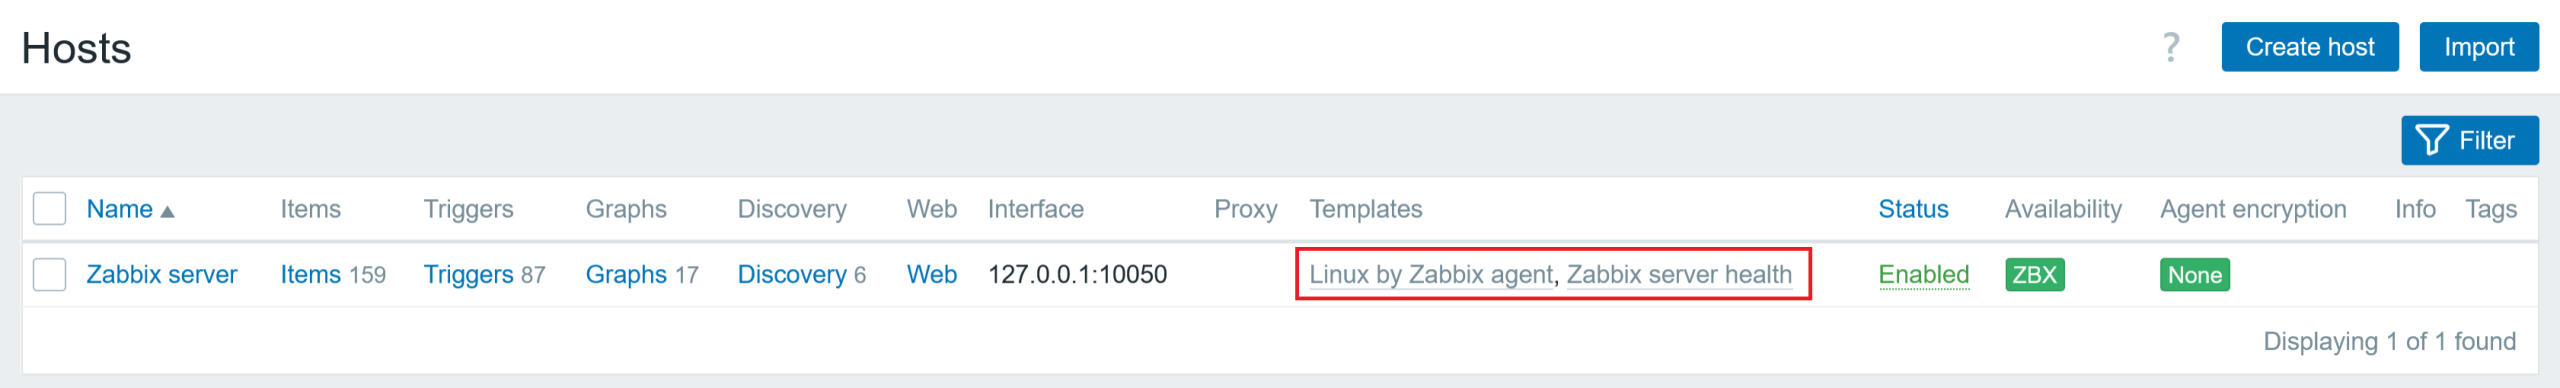
The next thing you should check is the Zabbix server host dashboards. In new instances, the Zabbix server host has already been included out of the box with two templates: Zabbix server health and Linux by Zabbix agent. If such a host has not been retained for some reason, now it’s time to create it and start monitoring your Zabbix server.
The Zabbix server health template uses Zabbix internal items that do not require any interface. The Linux by Zabbix agent template does require a running Zabbix agent on the Zabbix server system in order to gather the OS related metrics.
Check the current state of your Zabbix server
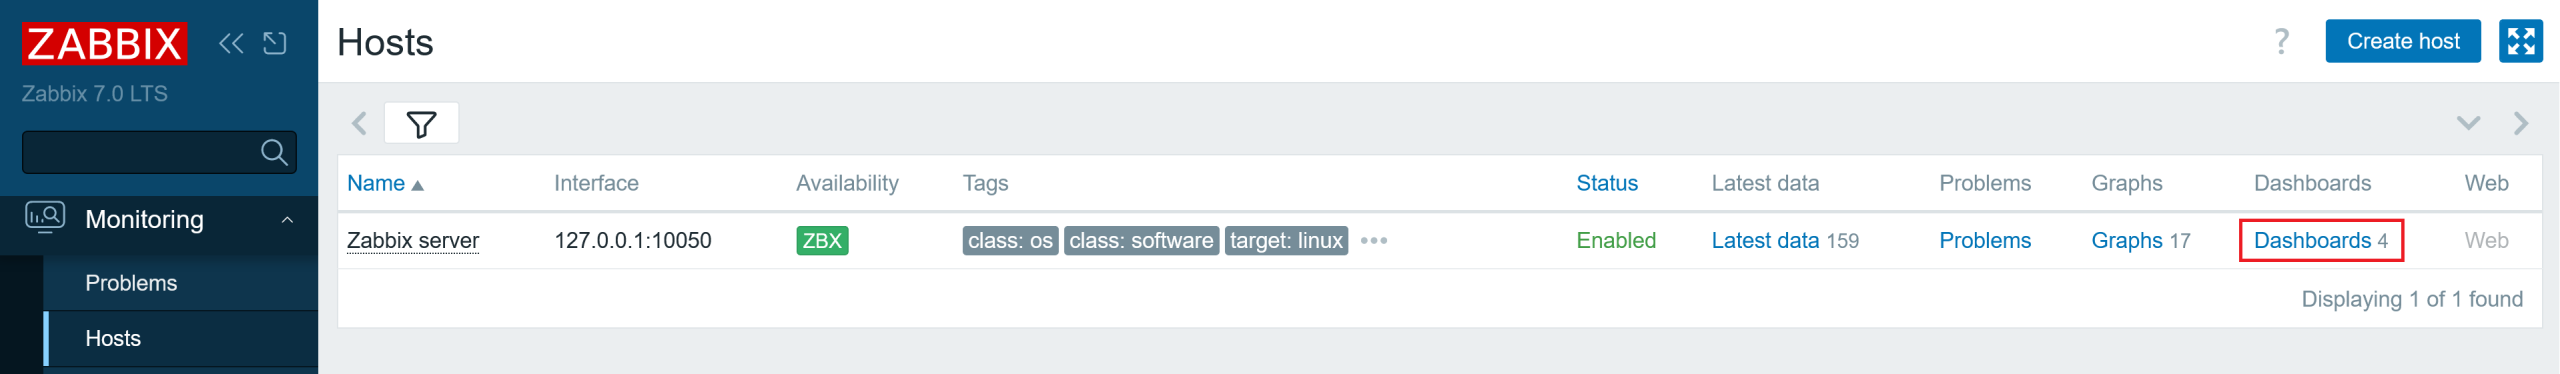
Once you have such a host, go to the menu Monitoring > Hosts and use the main filter to find the Zabbix server host and select its Host Dashboards.
Select the Zabbix server health dashboard. Below, you will see the following pages under it – Performance, Processes, and Statuses.
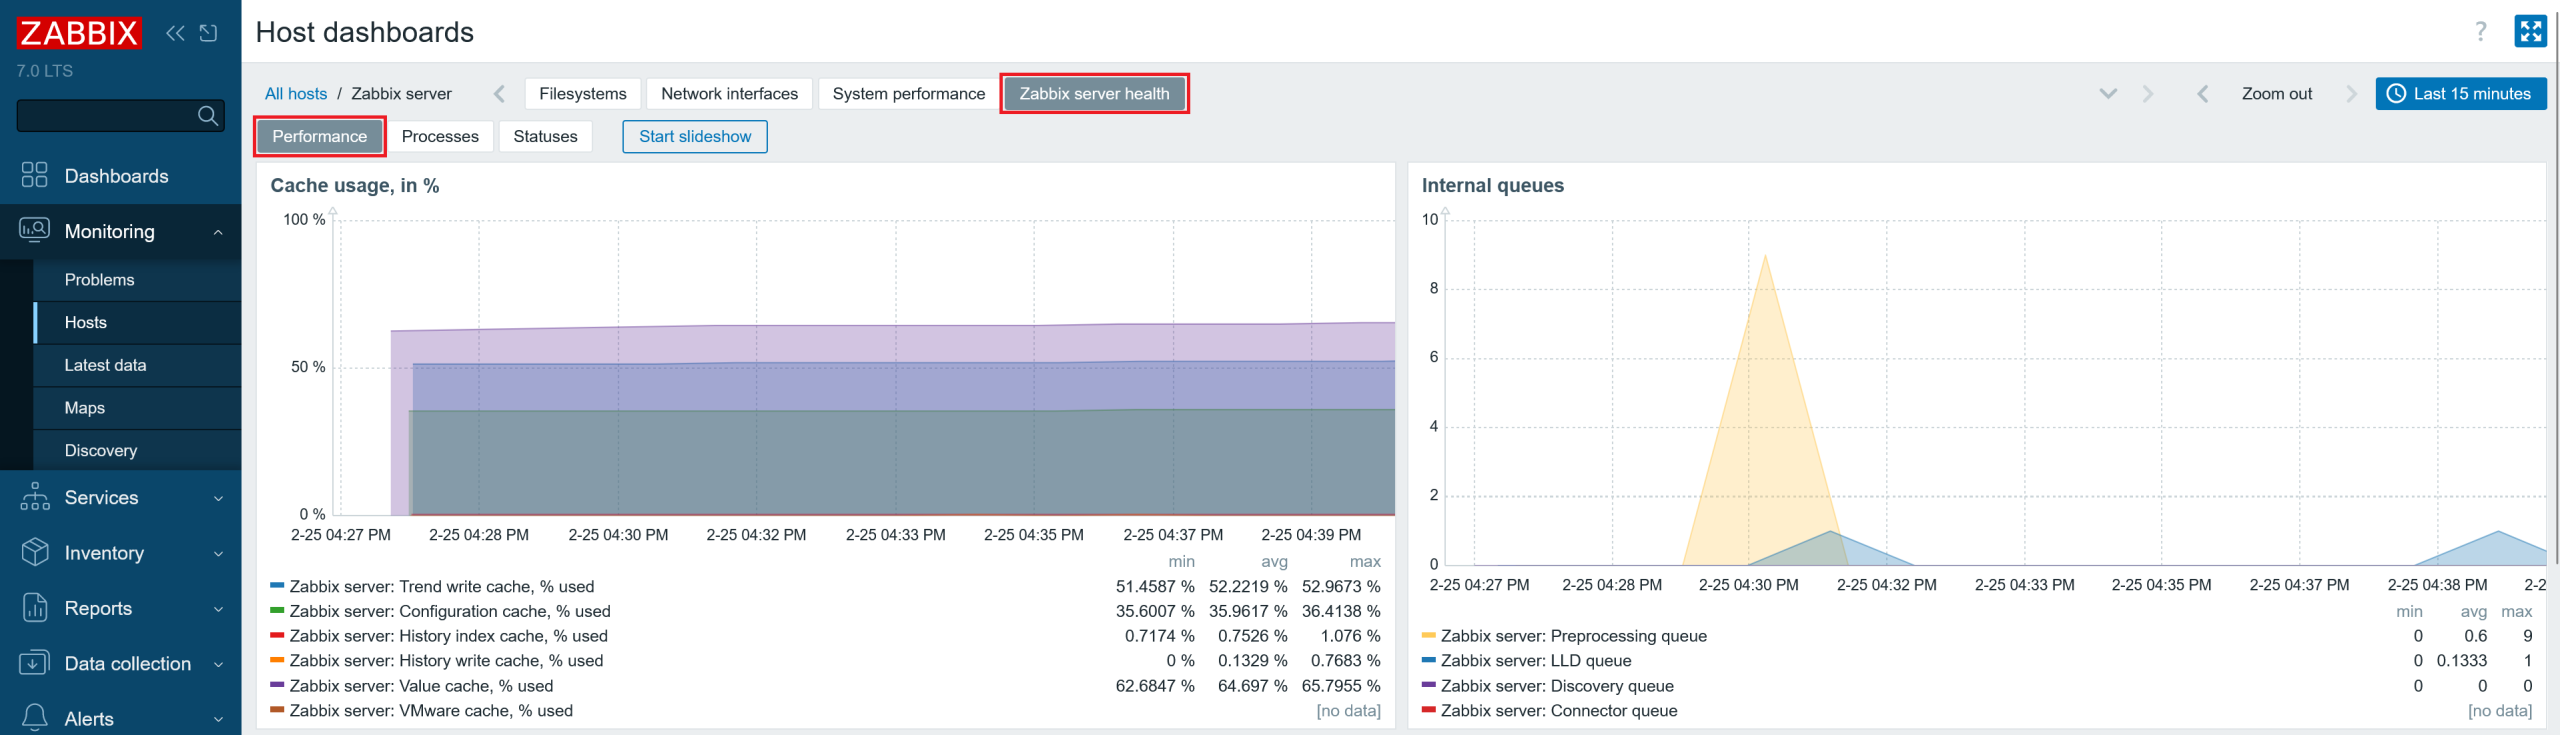
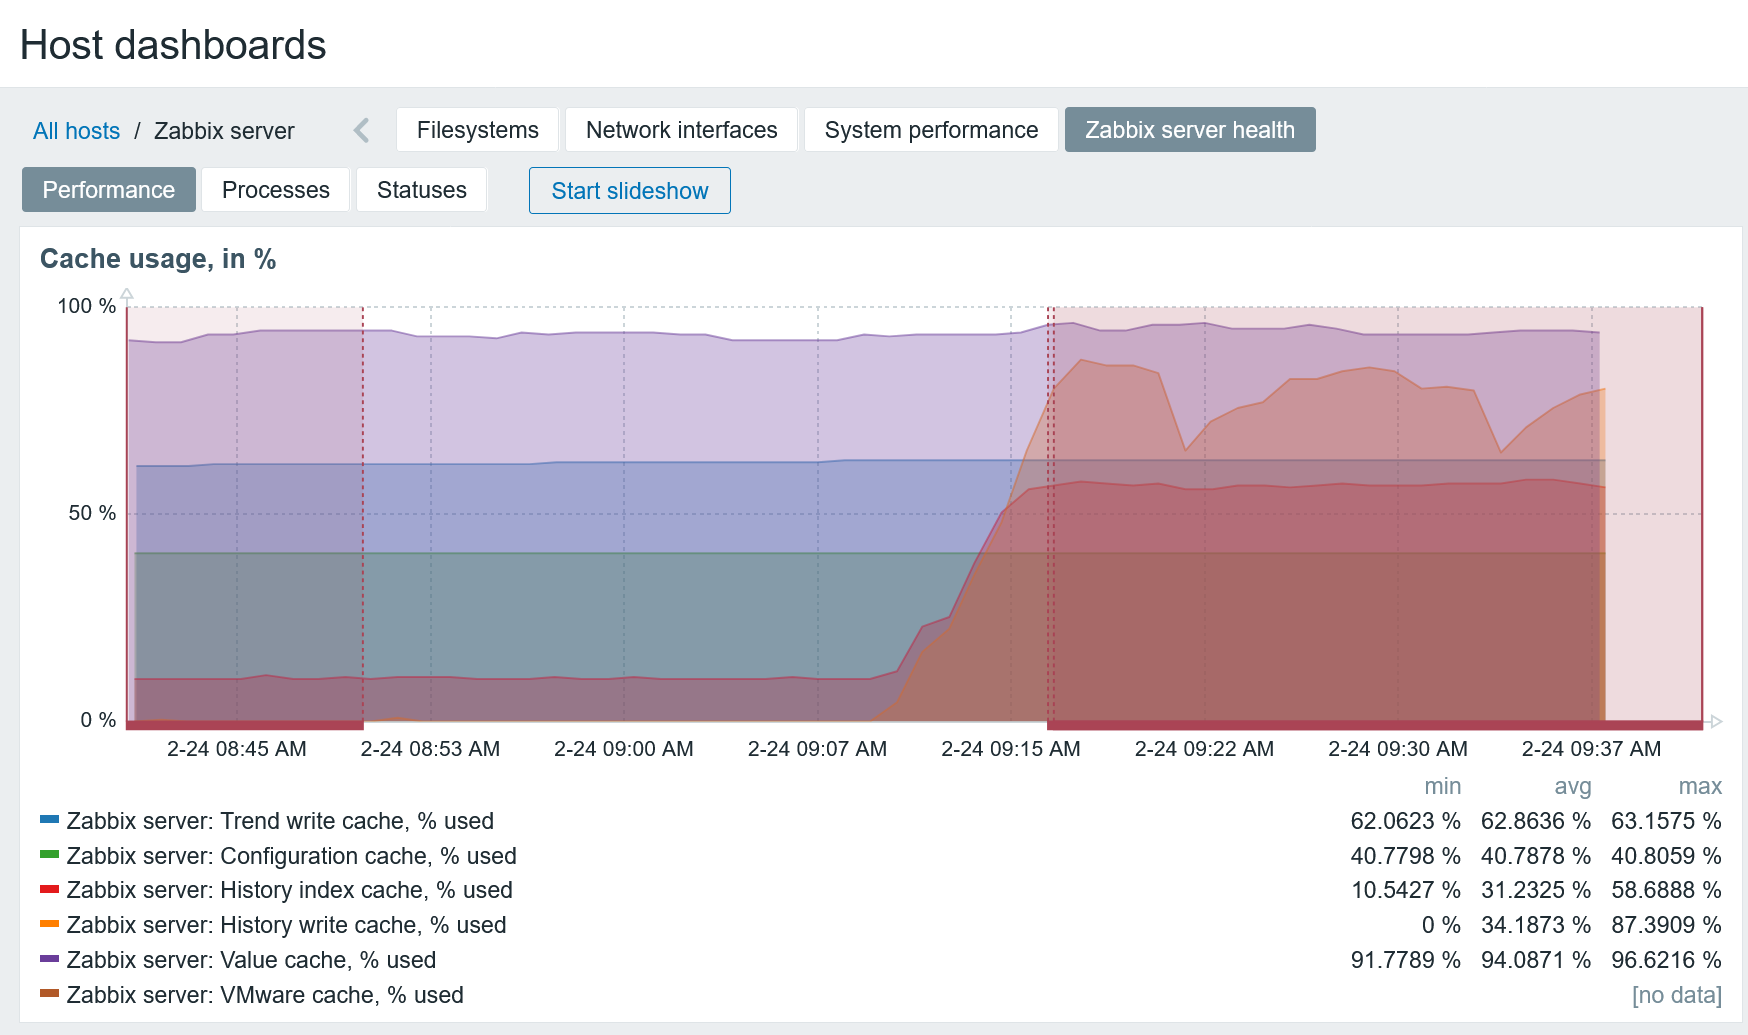
Check the cache utilization
In the Performance page, you can see the usage of Zabbix server caches. You should make sure that all caches except the history cache are at least ~ 50 % free. Technically, you can make the caches as large as possible; at worst, they will just be under-utilised. So, adjust the cache sizes accordingly.
Consequences of running out of configuration cache
If you add a lot of hosts in an automated way and have a relatively small or default configuration cache size [configcache], you could fill this cache quickly. The consequences of it are:
- The Zabbix server will crash
- The Zabbix server will be unable to start
- The Zabbix server will not collect any data
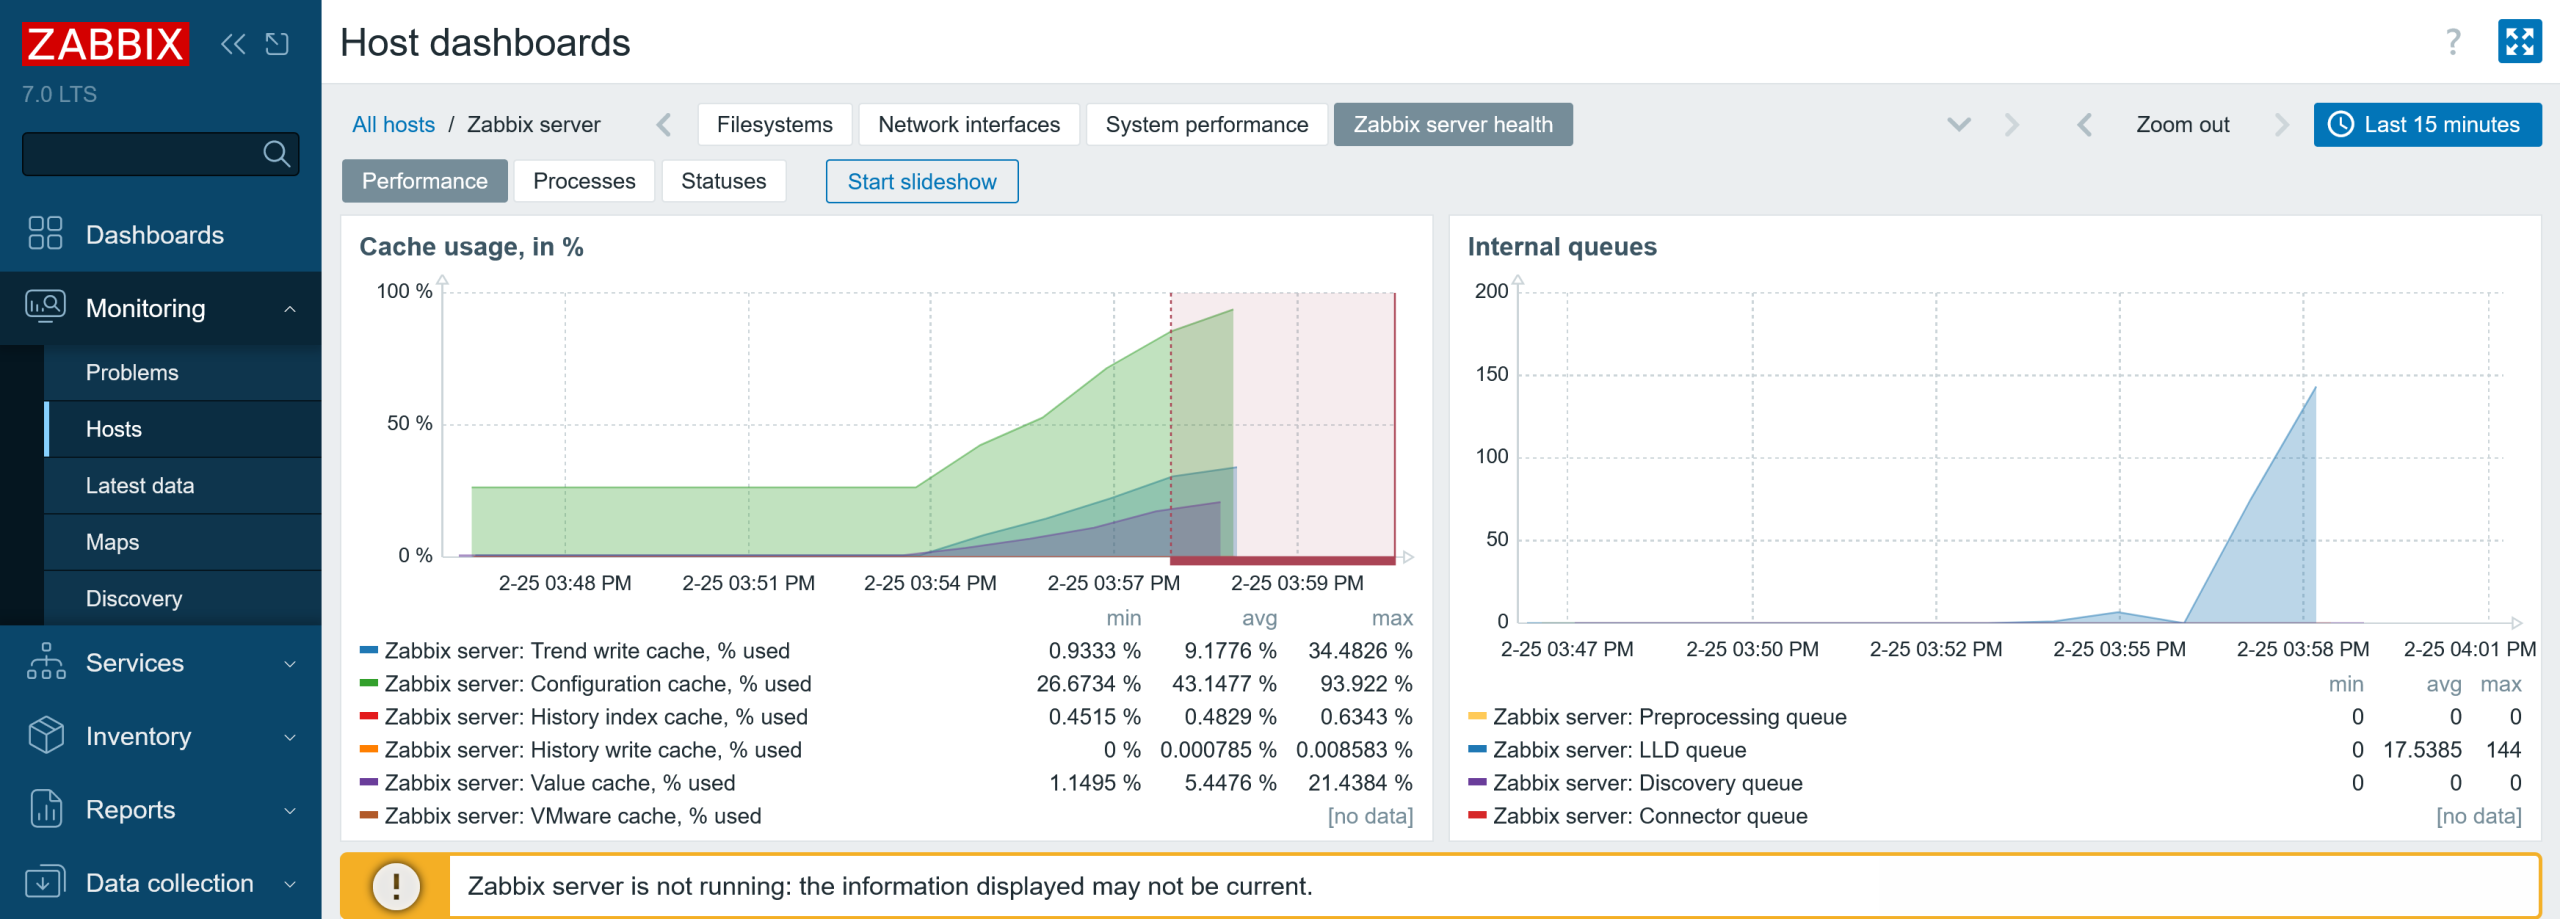
You will also see a warning message in the Zabbix frontend:
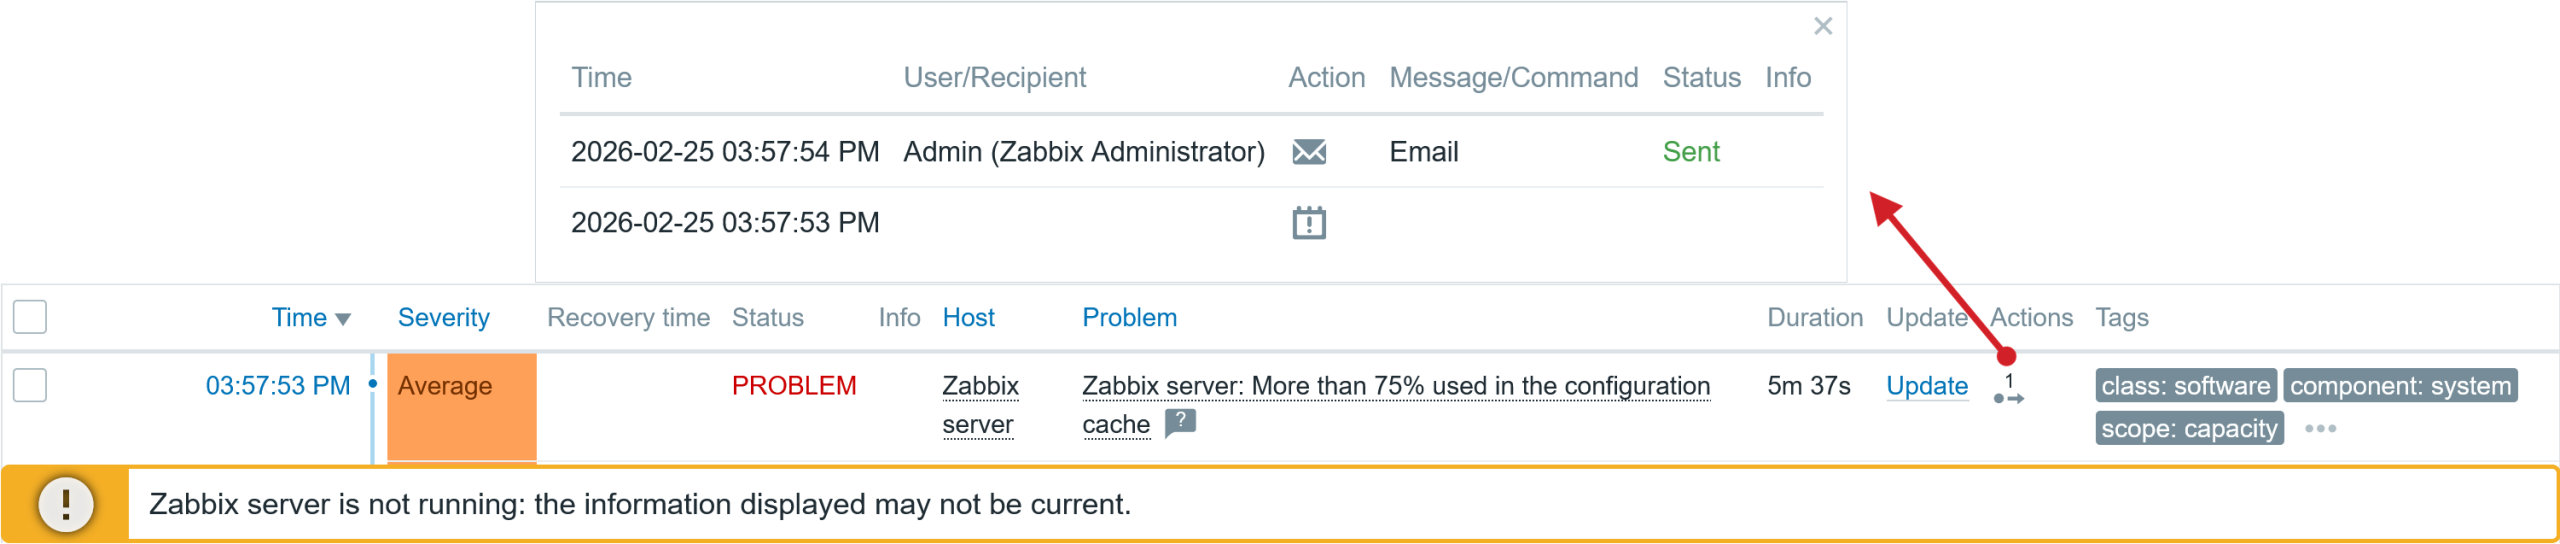
If the config cache does not fill up instantly, the problem event will be generated shortly after, and matching action operations will be executed while the Zabbix server is still running, for example, notifying admins about the issue. In the screenshot below, you can see that one action operation step was executed before the server crashed.
When a Zabbix component is not working as expected, your best source of information is the log file, as it informs you about the issues. Here is the error message in the Zabbix Server log file below.
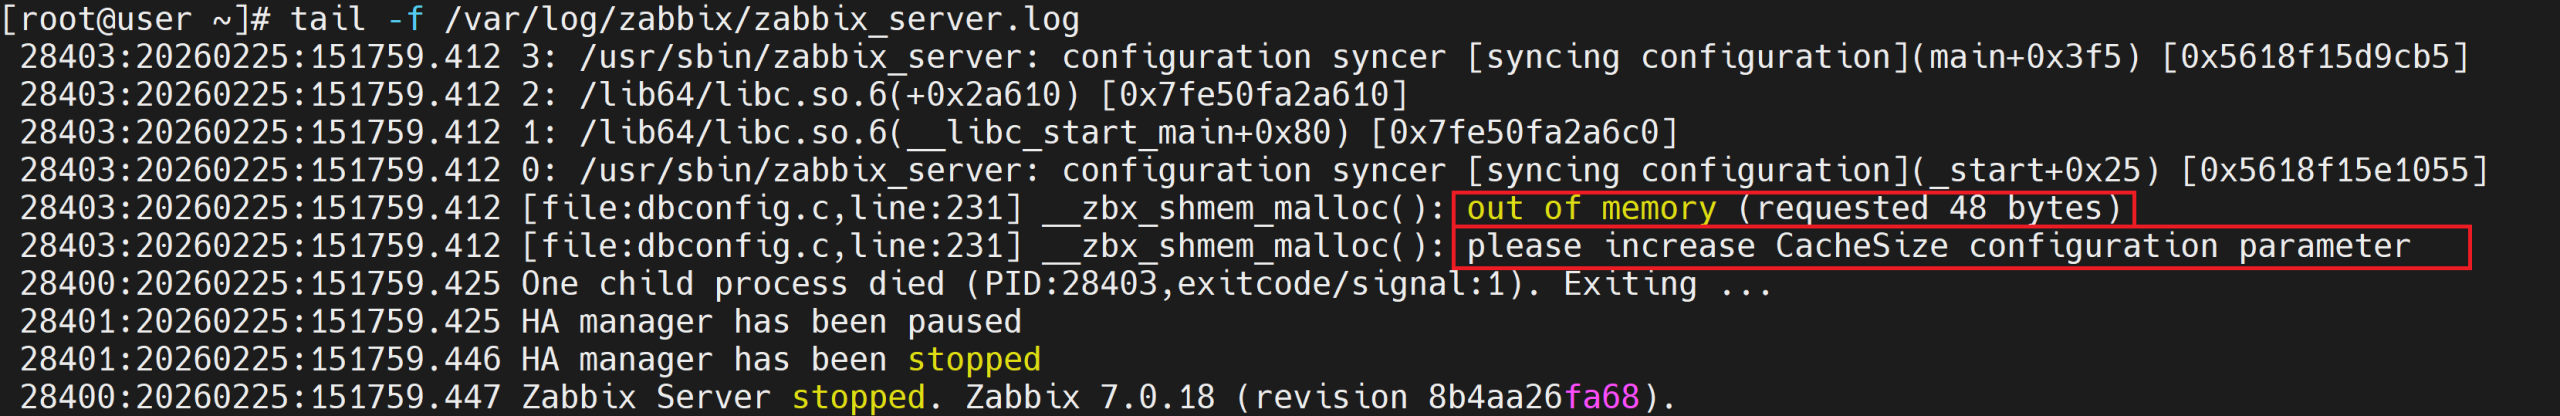
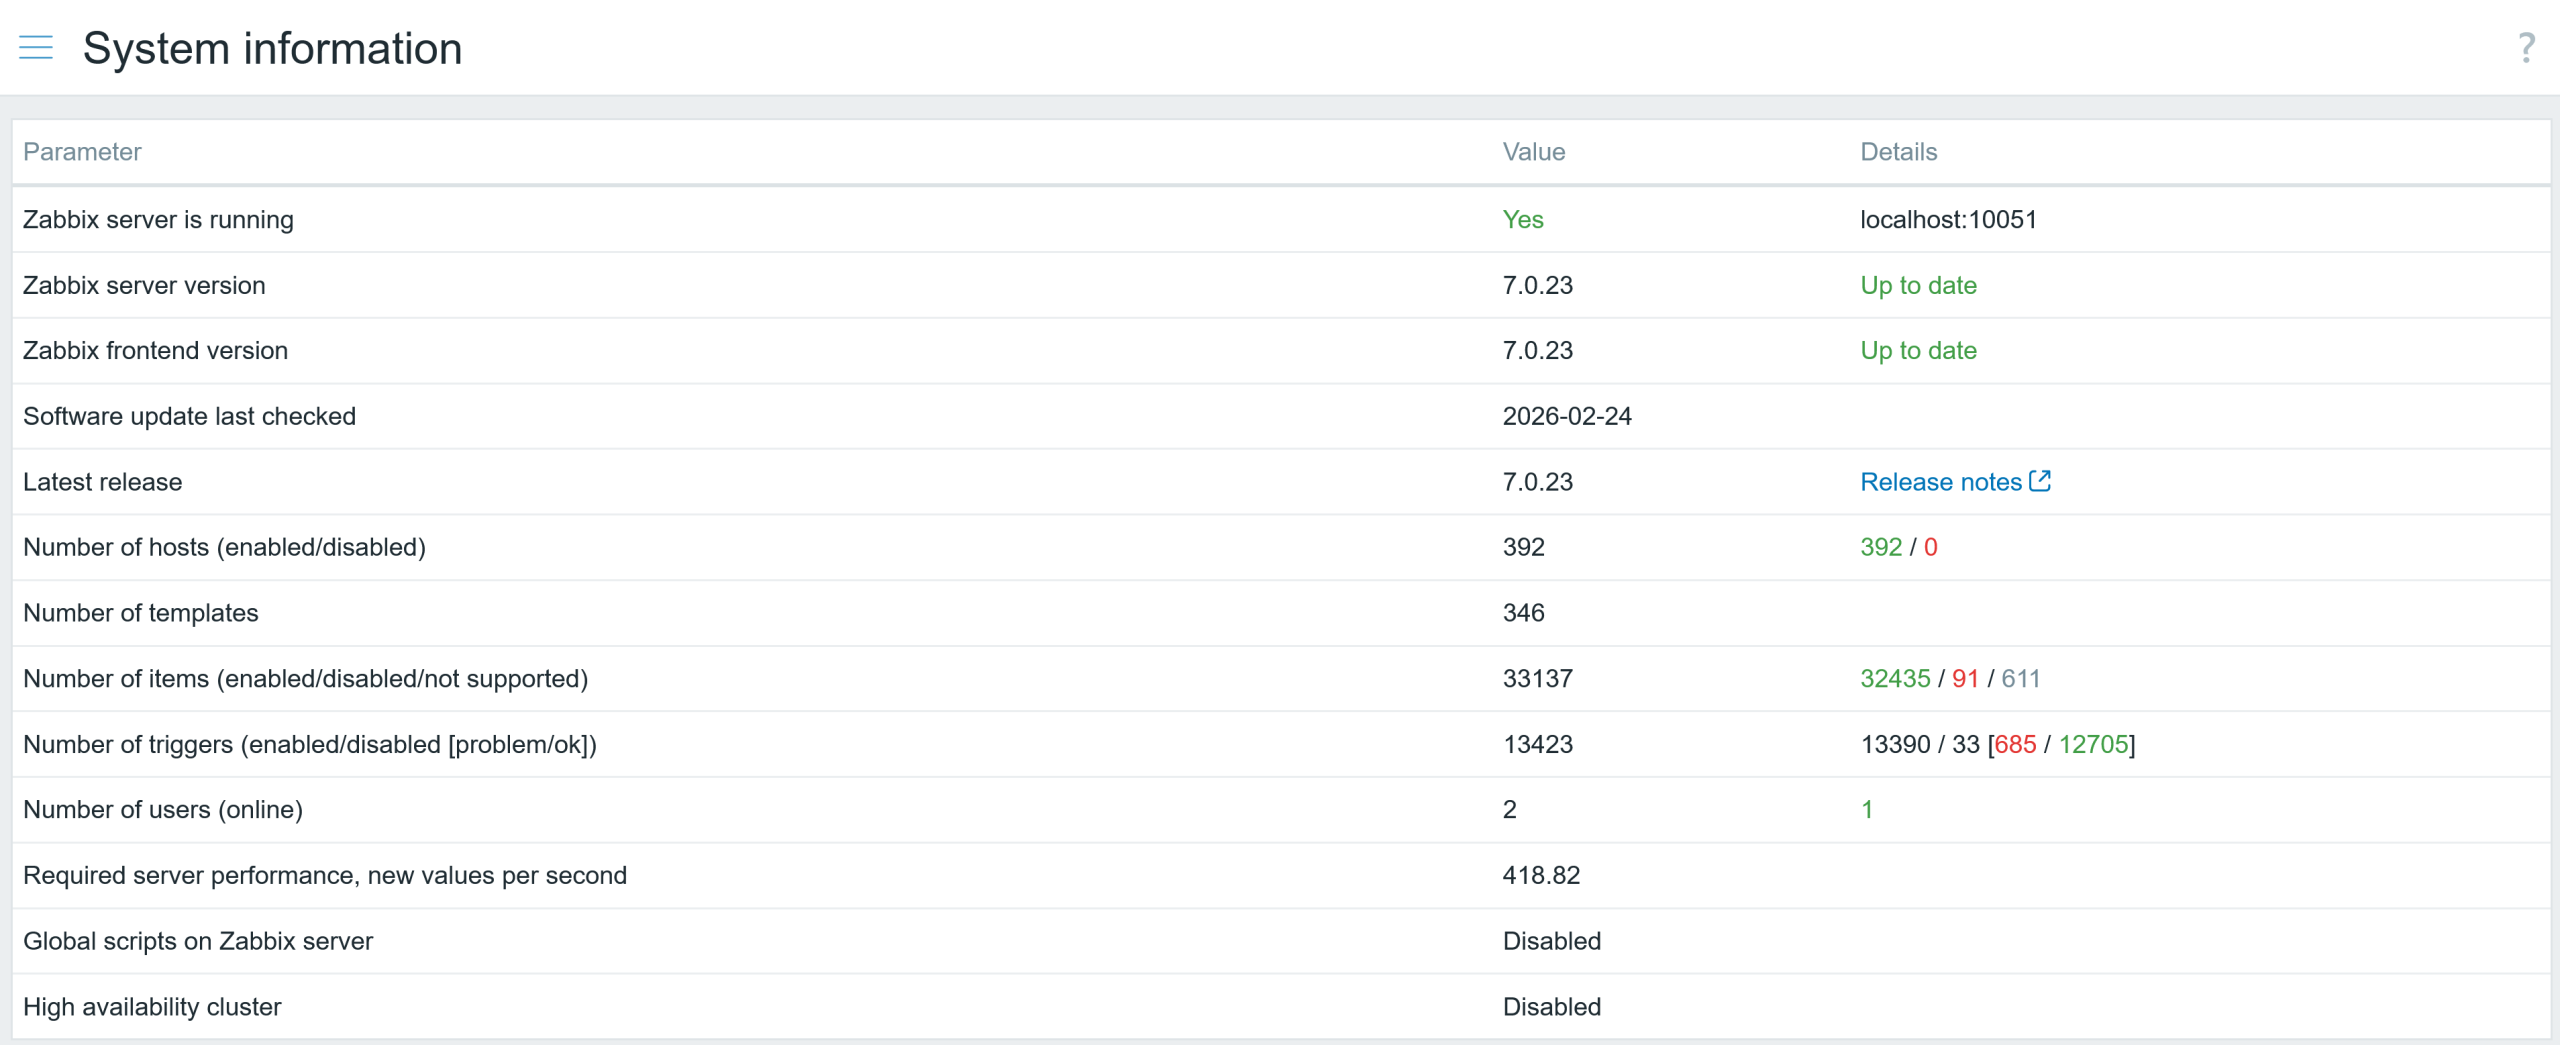
The solution is very simple: just increase the configuration cache size (two times or more) and restart the Zabbix server. If you expect a significant increase in hosts in the near future, you can be more generous and allocate more memory. My current Zabbix server is monitoring approximately 400 hosts.
Consequences of running out of value and history cache
So, what happens if you run out of value cache? Zabbix server performance will degrade, and the frontend will become noticeably less responsive. Why is that? Value cache stores item values used for calculated items and evaluating triggers. Now, for each trigger calculation that does not contain an item metric in the history cache will be retrieved directly from the database.
The history cache stores historical data that will be written to the database. If it’s mostly full, it means you might have issues with your database performance – the Zabbix server is unable to write data fast enough to the database. This can trigger a cascading performance degradation with a negative feedback loop. In my case:
- A full value cache leads to additional DB read queries
- DB performance drops, which leads to slow historical data writes to the database
- The history cache also starts to fill up
- The data collection is delayed due to the full history cache
- As more data is collected, database read queries retrieve more data, progressively worsening the cycle
Technically, it does not require your value cache to be 100% full to have this issue – if a lot of triggers use a long-time interval for evaluation, you could have a situation where your value cache is only 85% or 90% full, but the Zabbix server is unable to fit the required item history records in available memory.
The issue with running out of value cache will also be logged in the Zabbix server’s log file.
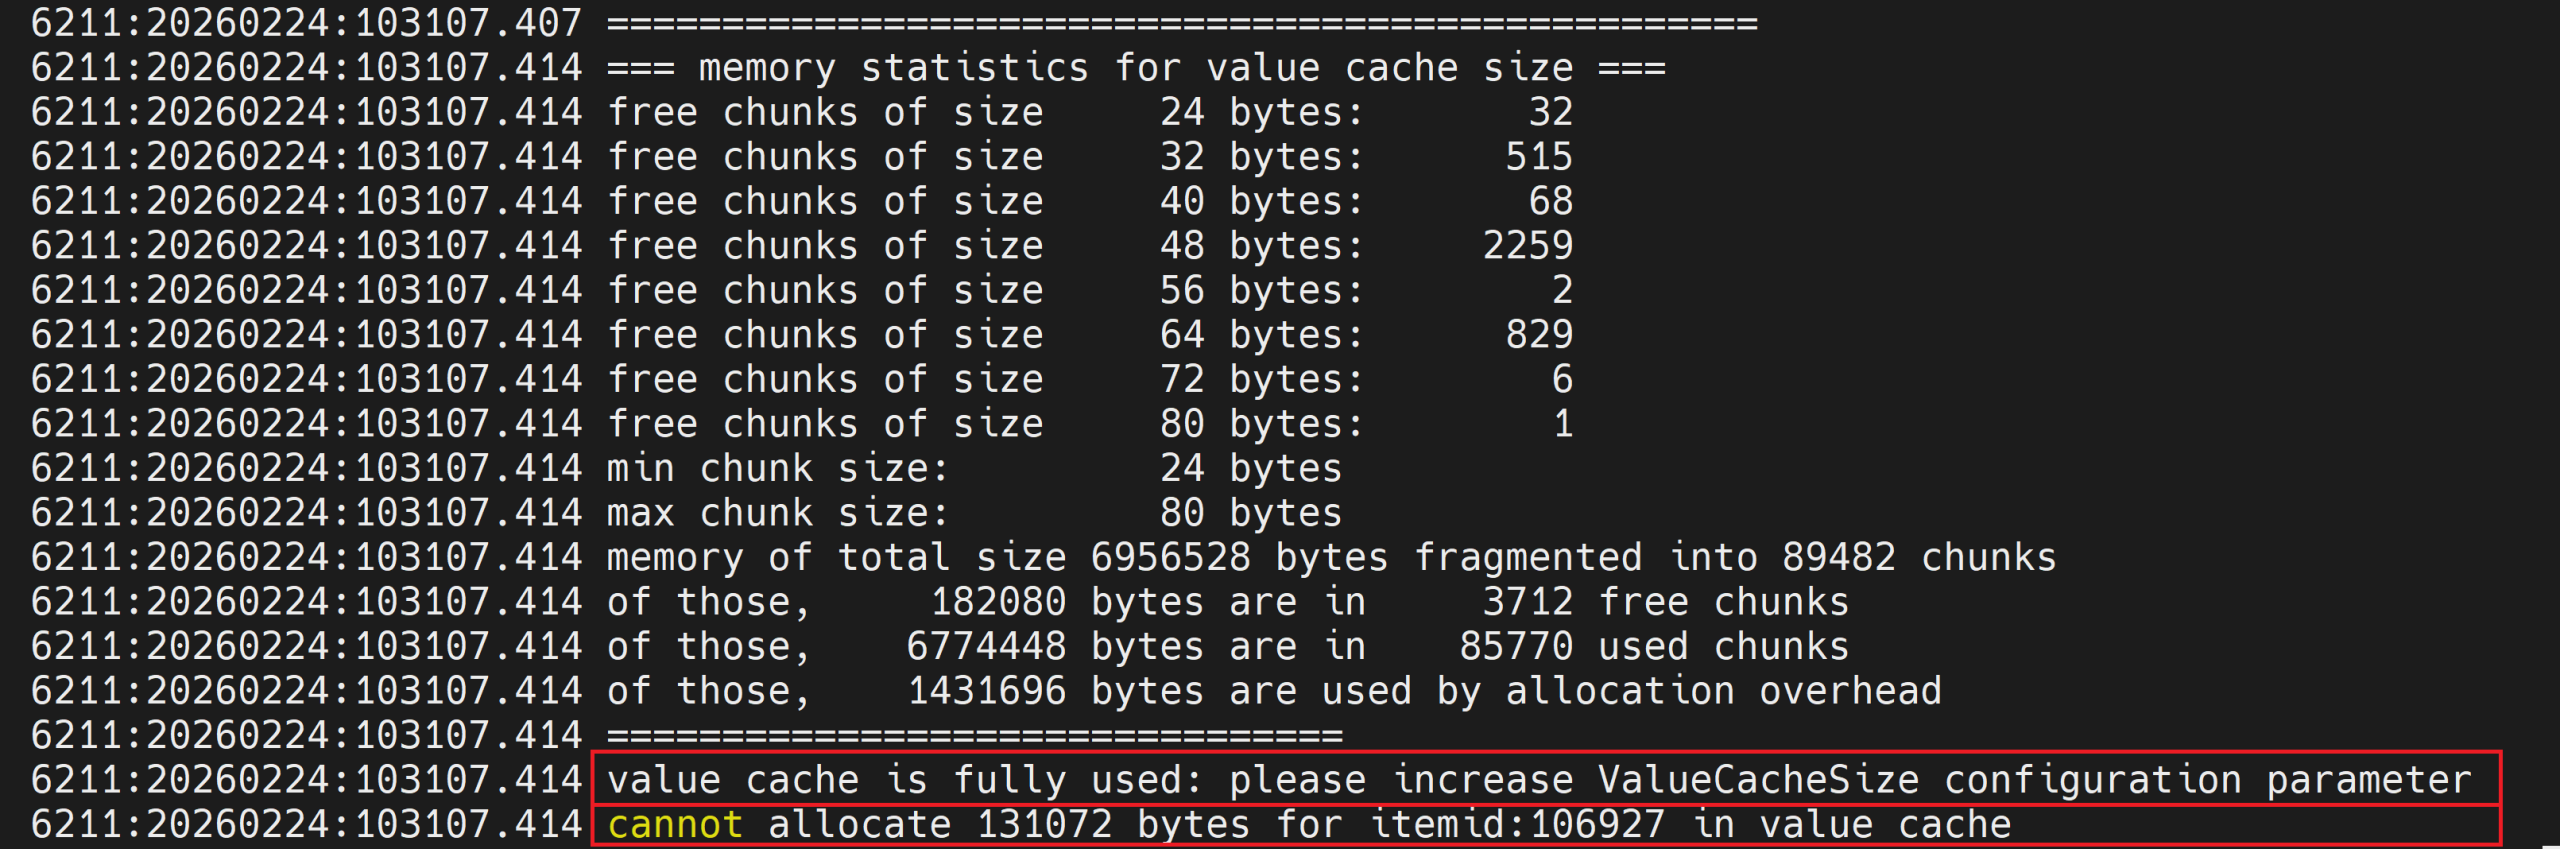
The solution to this issue is simple: increase the value cache size and restart the Zabbix server.
If you monitor your Zabbix server with the health template, problem events will be automatically generated when:
- Value cache works in a low memory mode
- History cache utilization exceeds 75 %

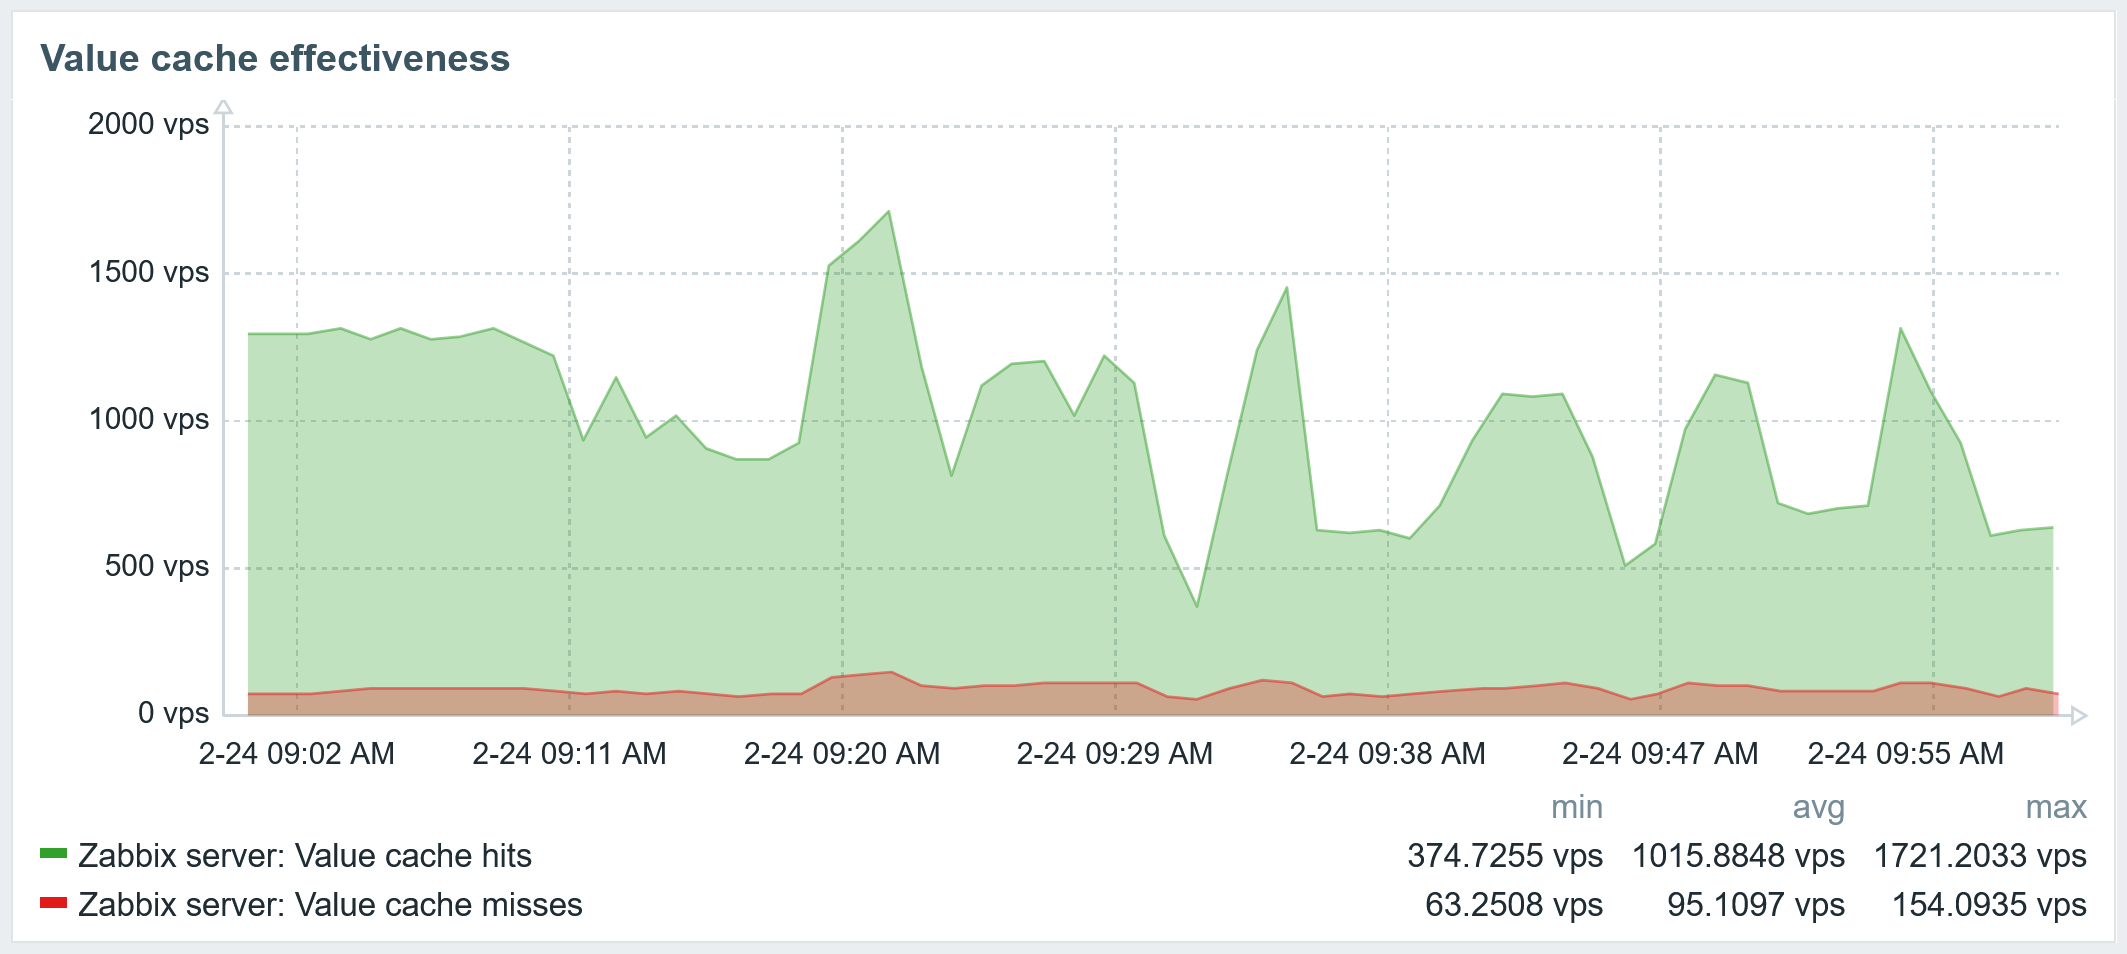
The issue with the Value cache working in low memory mode can also be seen in the graph below. Here you can see how many historical item values were present in cache, and how many had to be retrieved from the database directly.
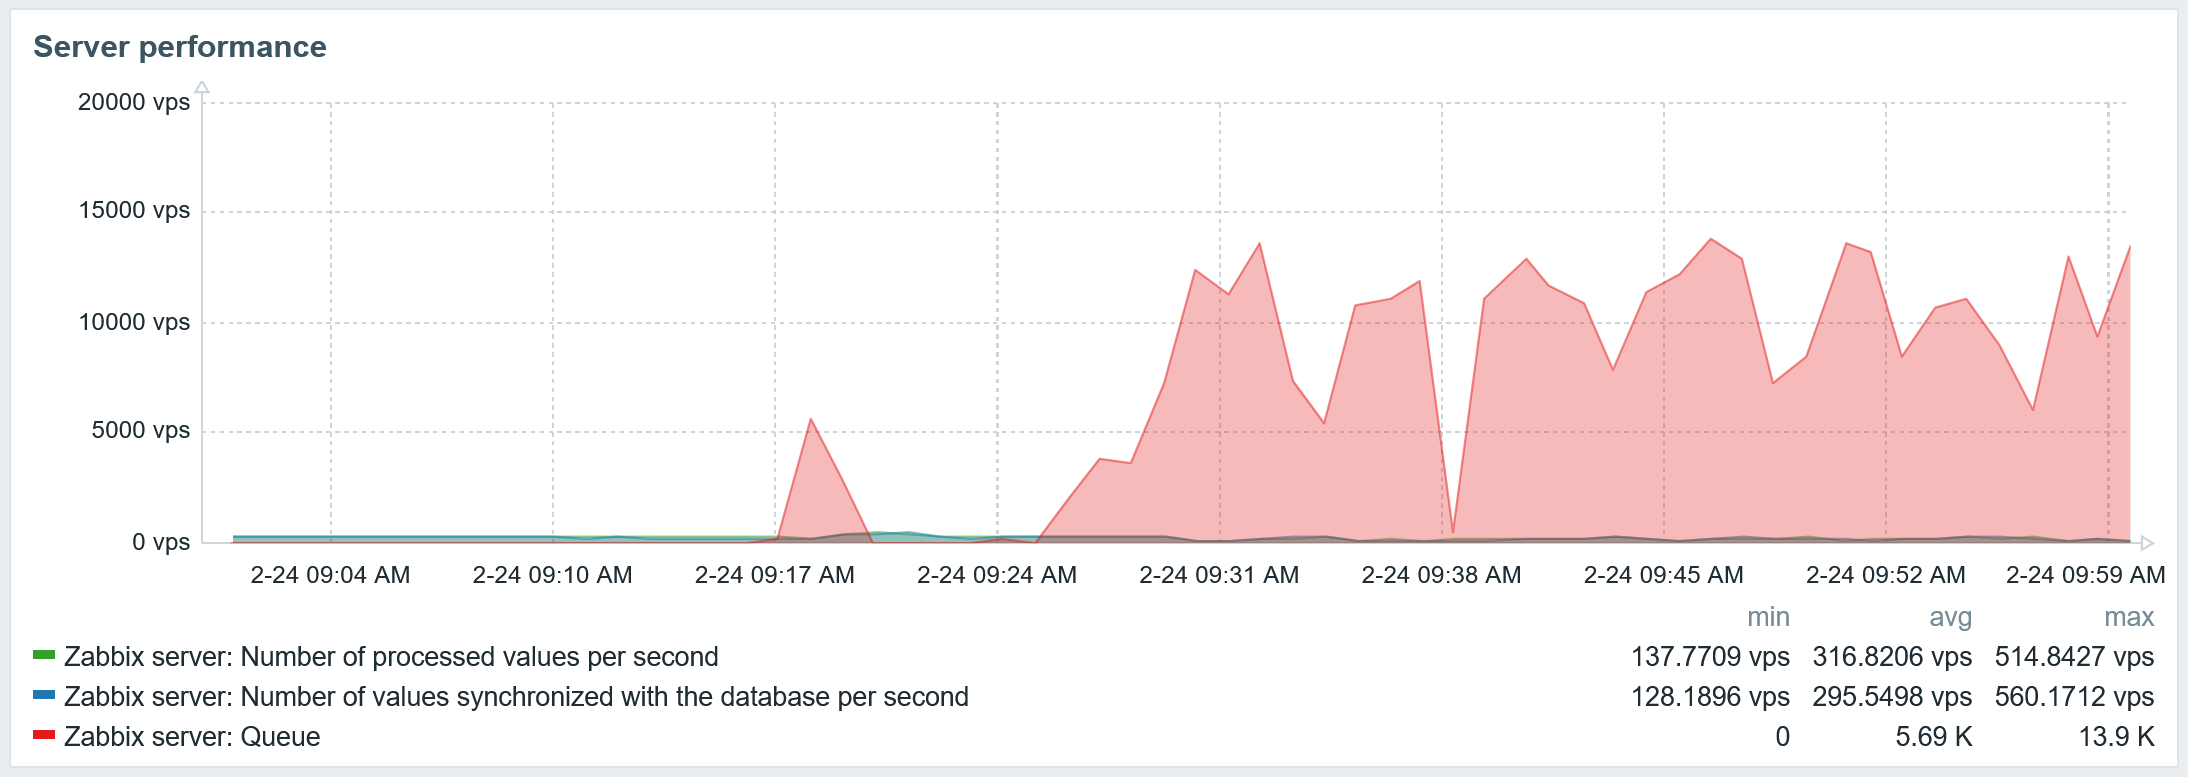
Due to the terrible performance of the untuned database, when my history write cache fills up the data collectors are throttled, causing a pileup of delayed item collection.
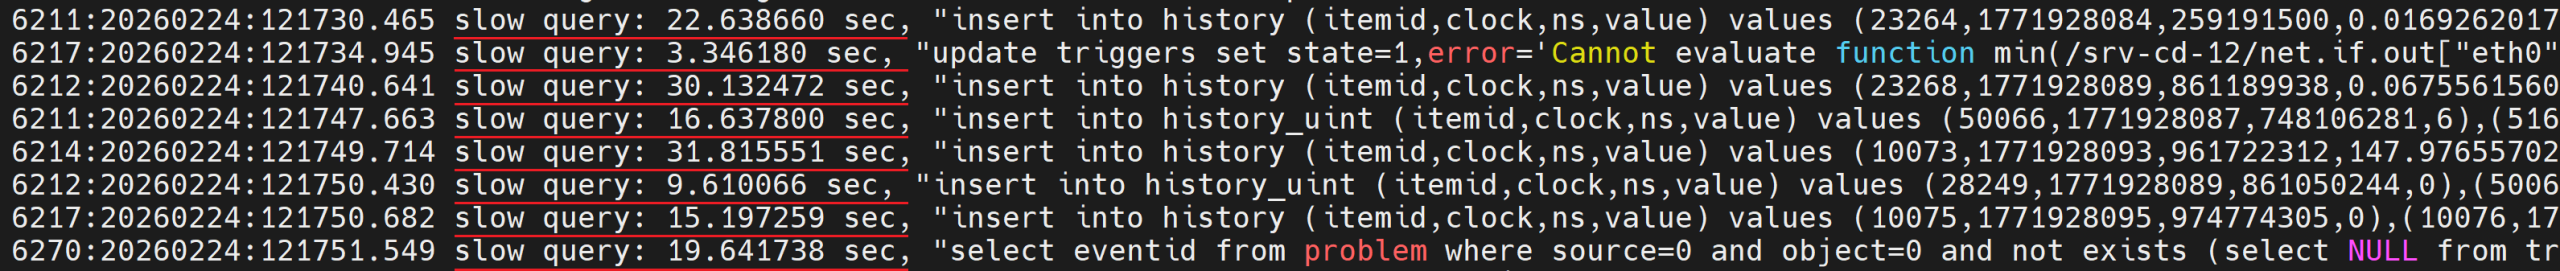
Slow database queries will appear in the Zabbix server log file.
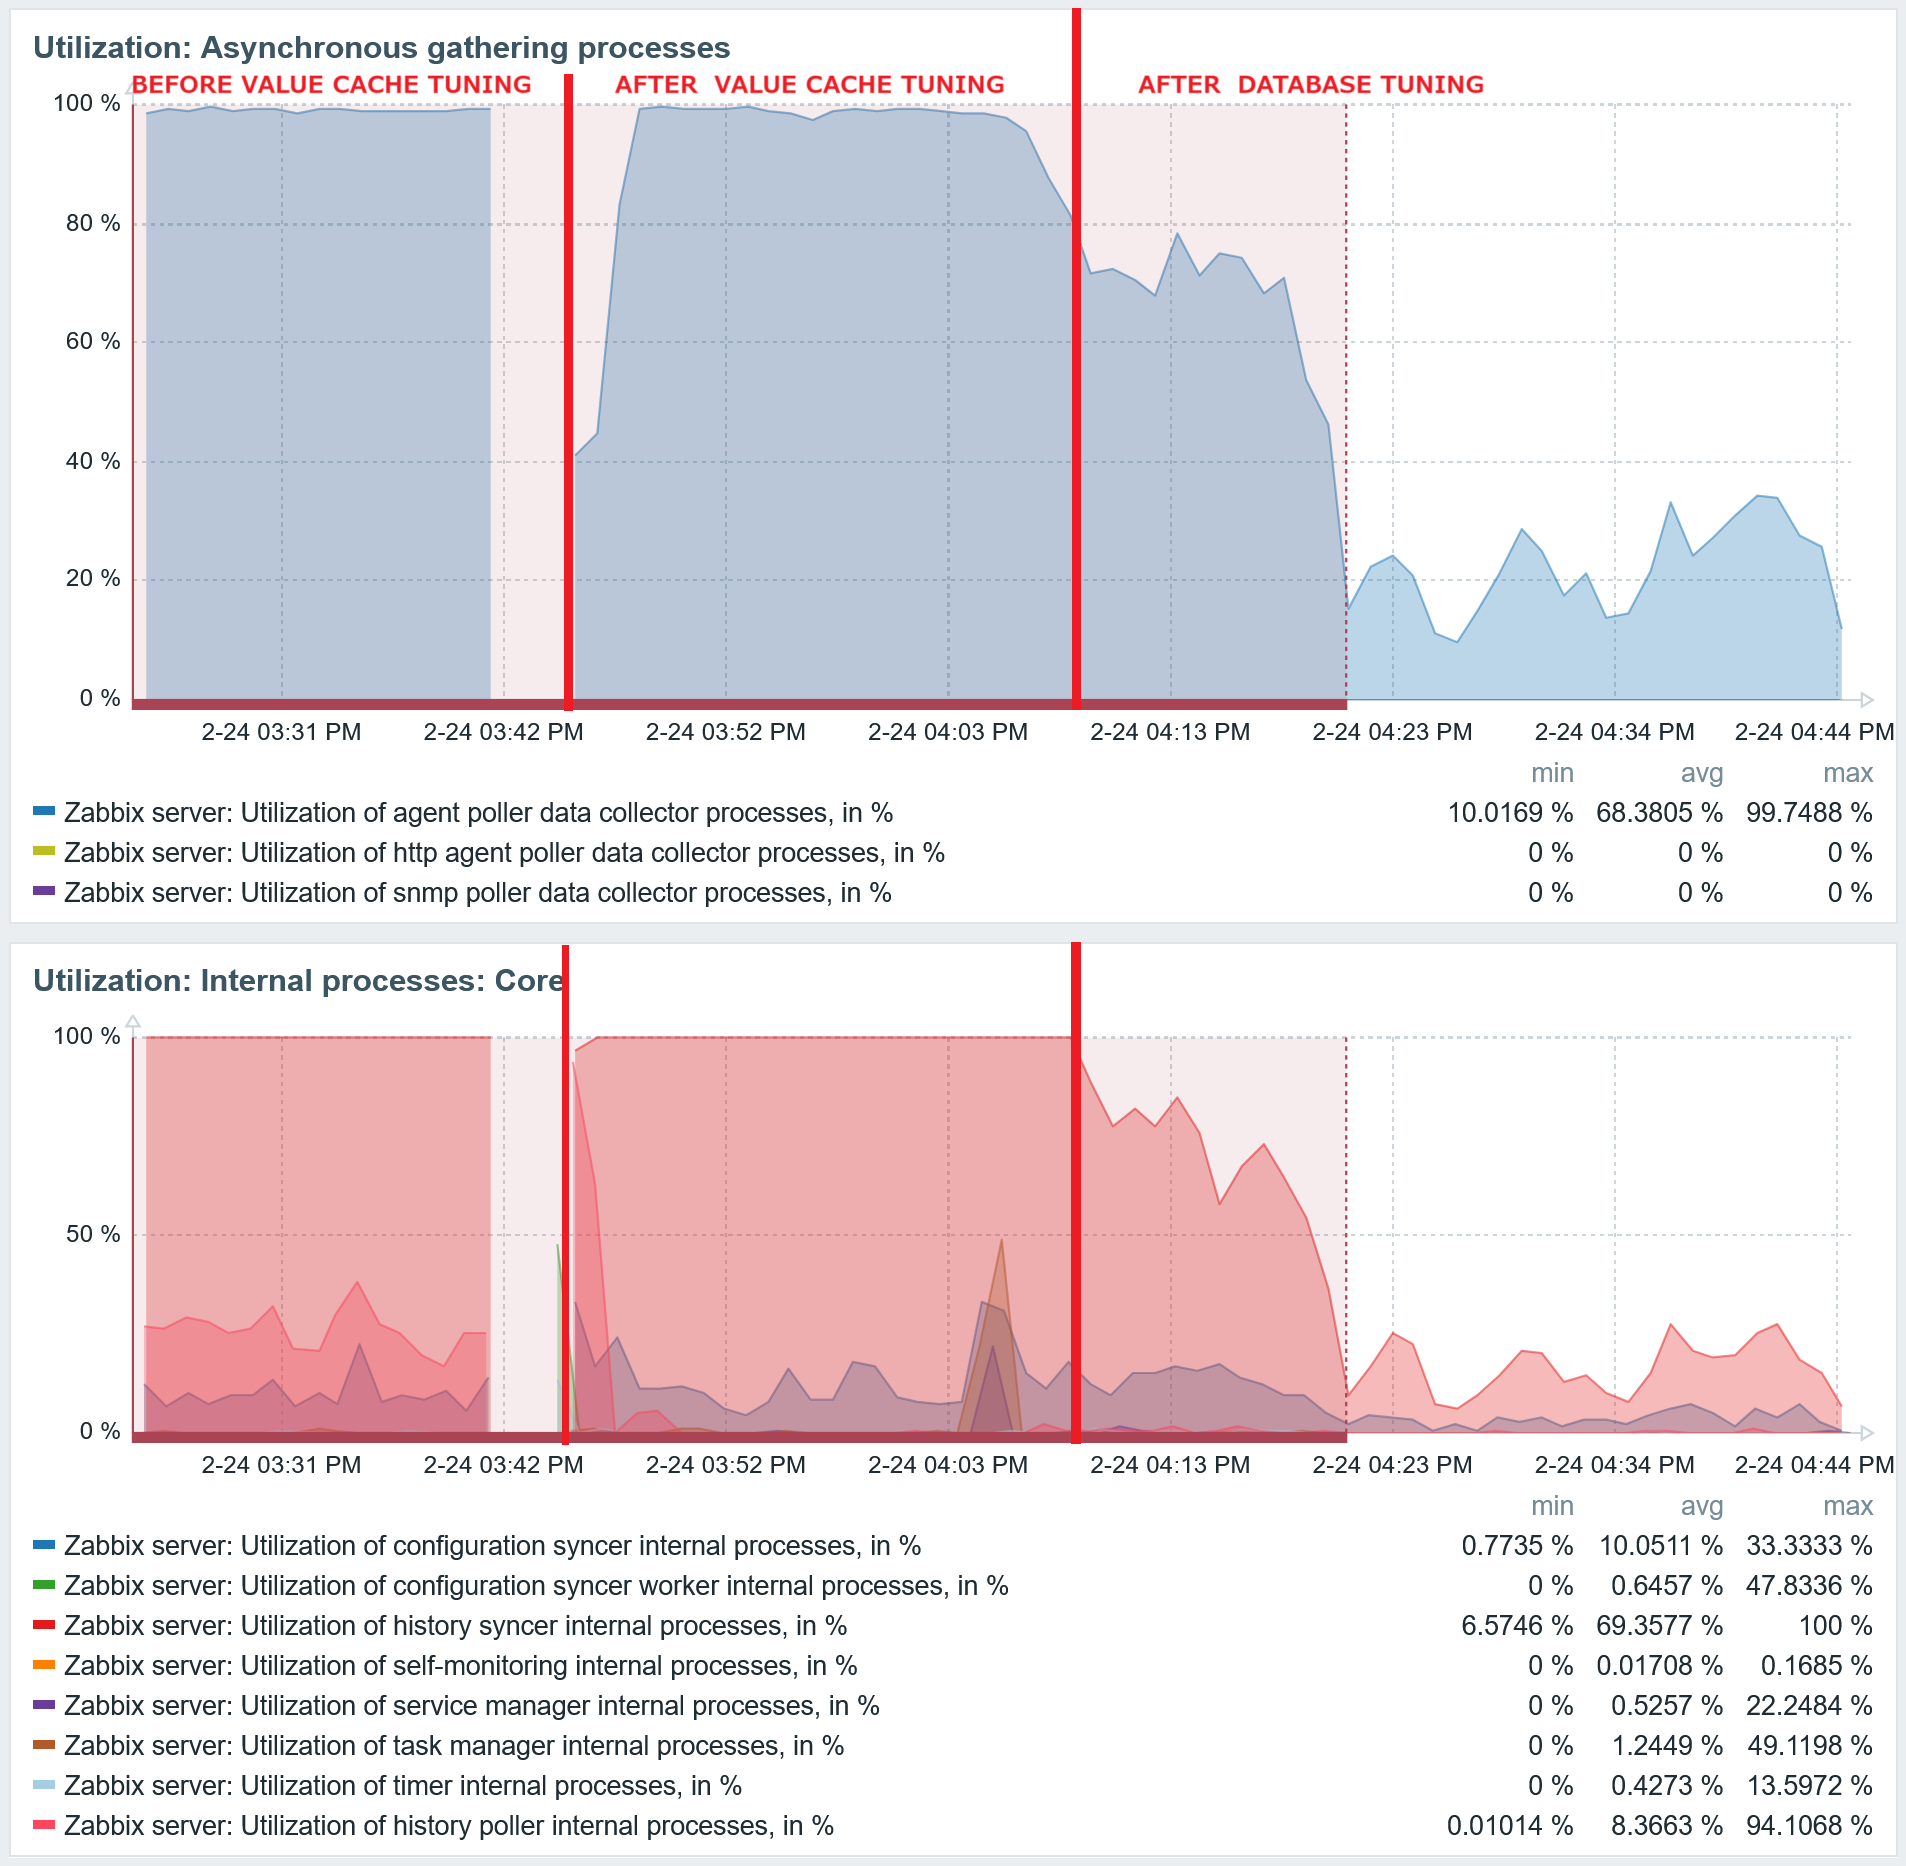
The result of cache tuning and database tuning
Increasing the value cache only partly solved one issue. After database tuning, database performance has improved significantly:
- The history cache is now empty
- No more value cache misses
- No more delayed items
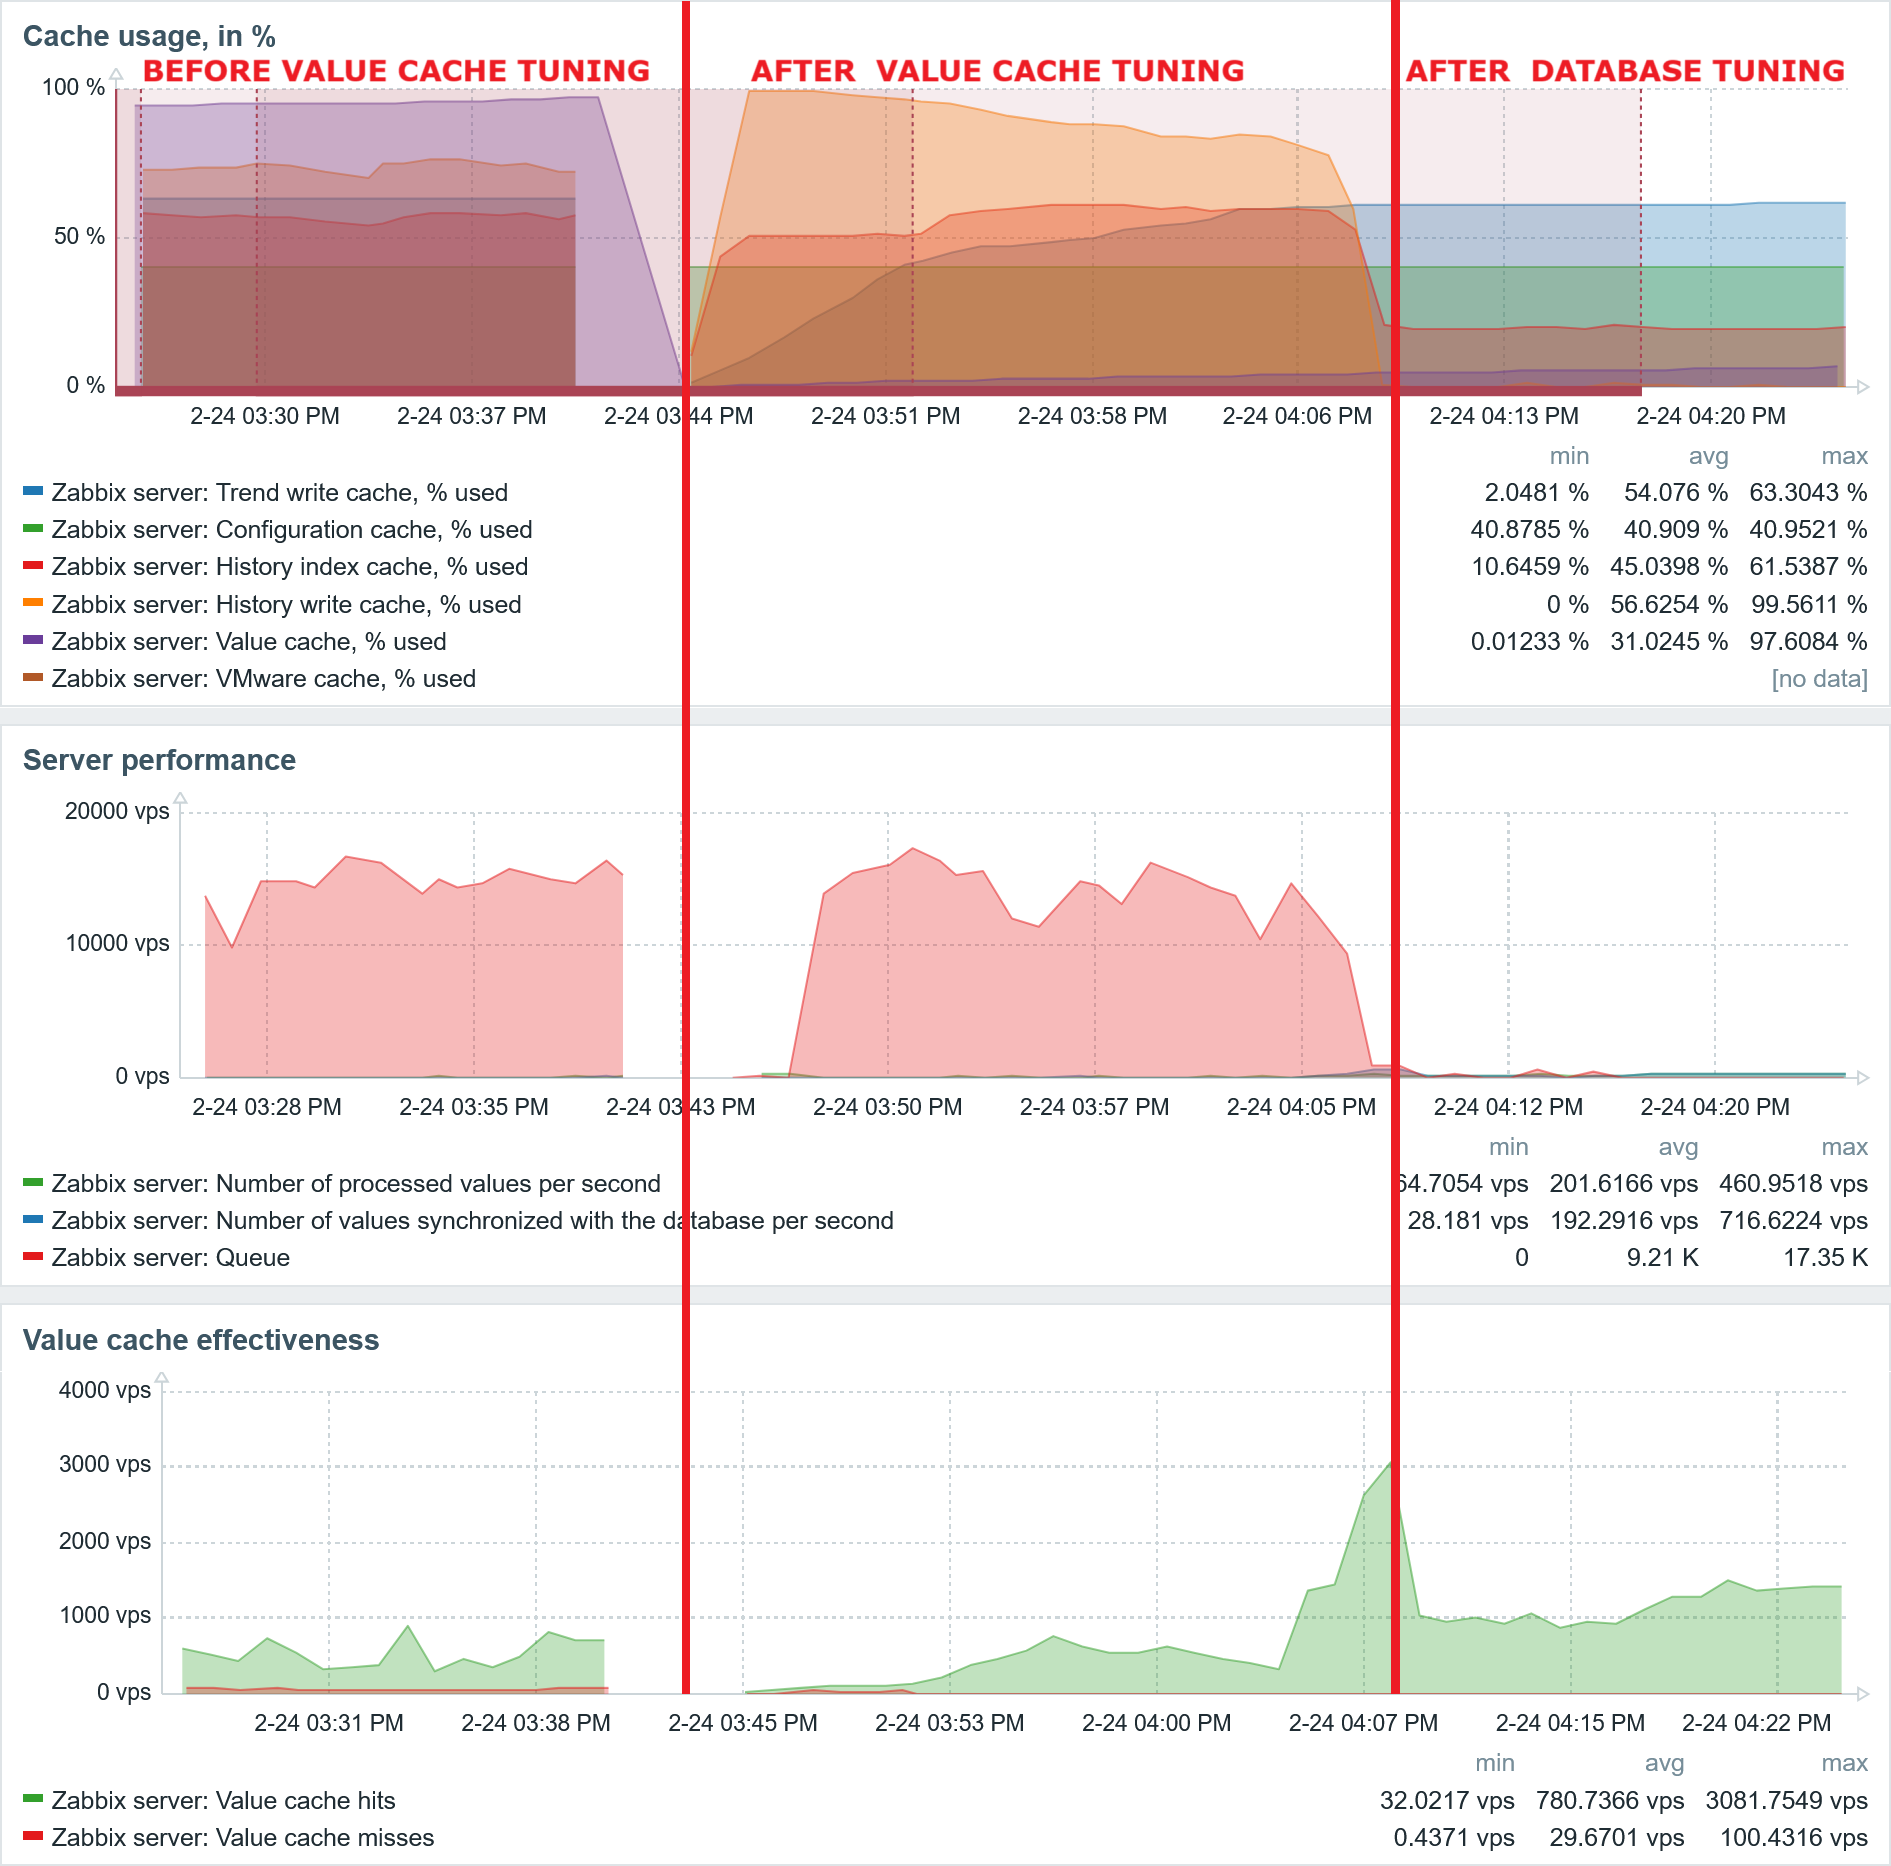
After the Database tuning, the agent poller process and history syncer utilization also decreased to a low level.
Tune the Zabbix server configuration parameters
Check the Processes page in the Zabbix Health dashboard and adjust the parameters accordingly. Only adjust the parameters that you understand. Changing the parameters arbitrarily can lead to the following:
- Wasted resources without effective performance improvement
- Reduced Zabbix server performance
- Zabbix server crashes
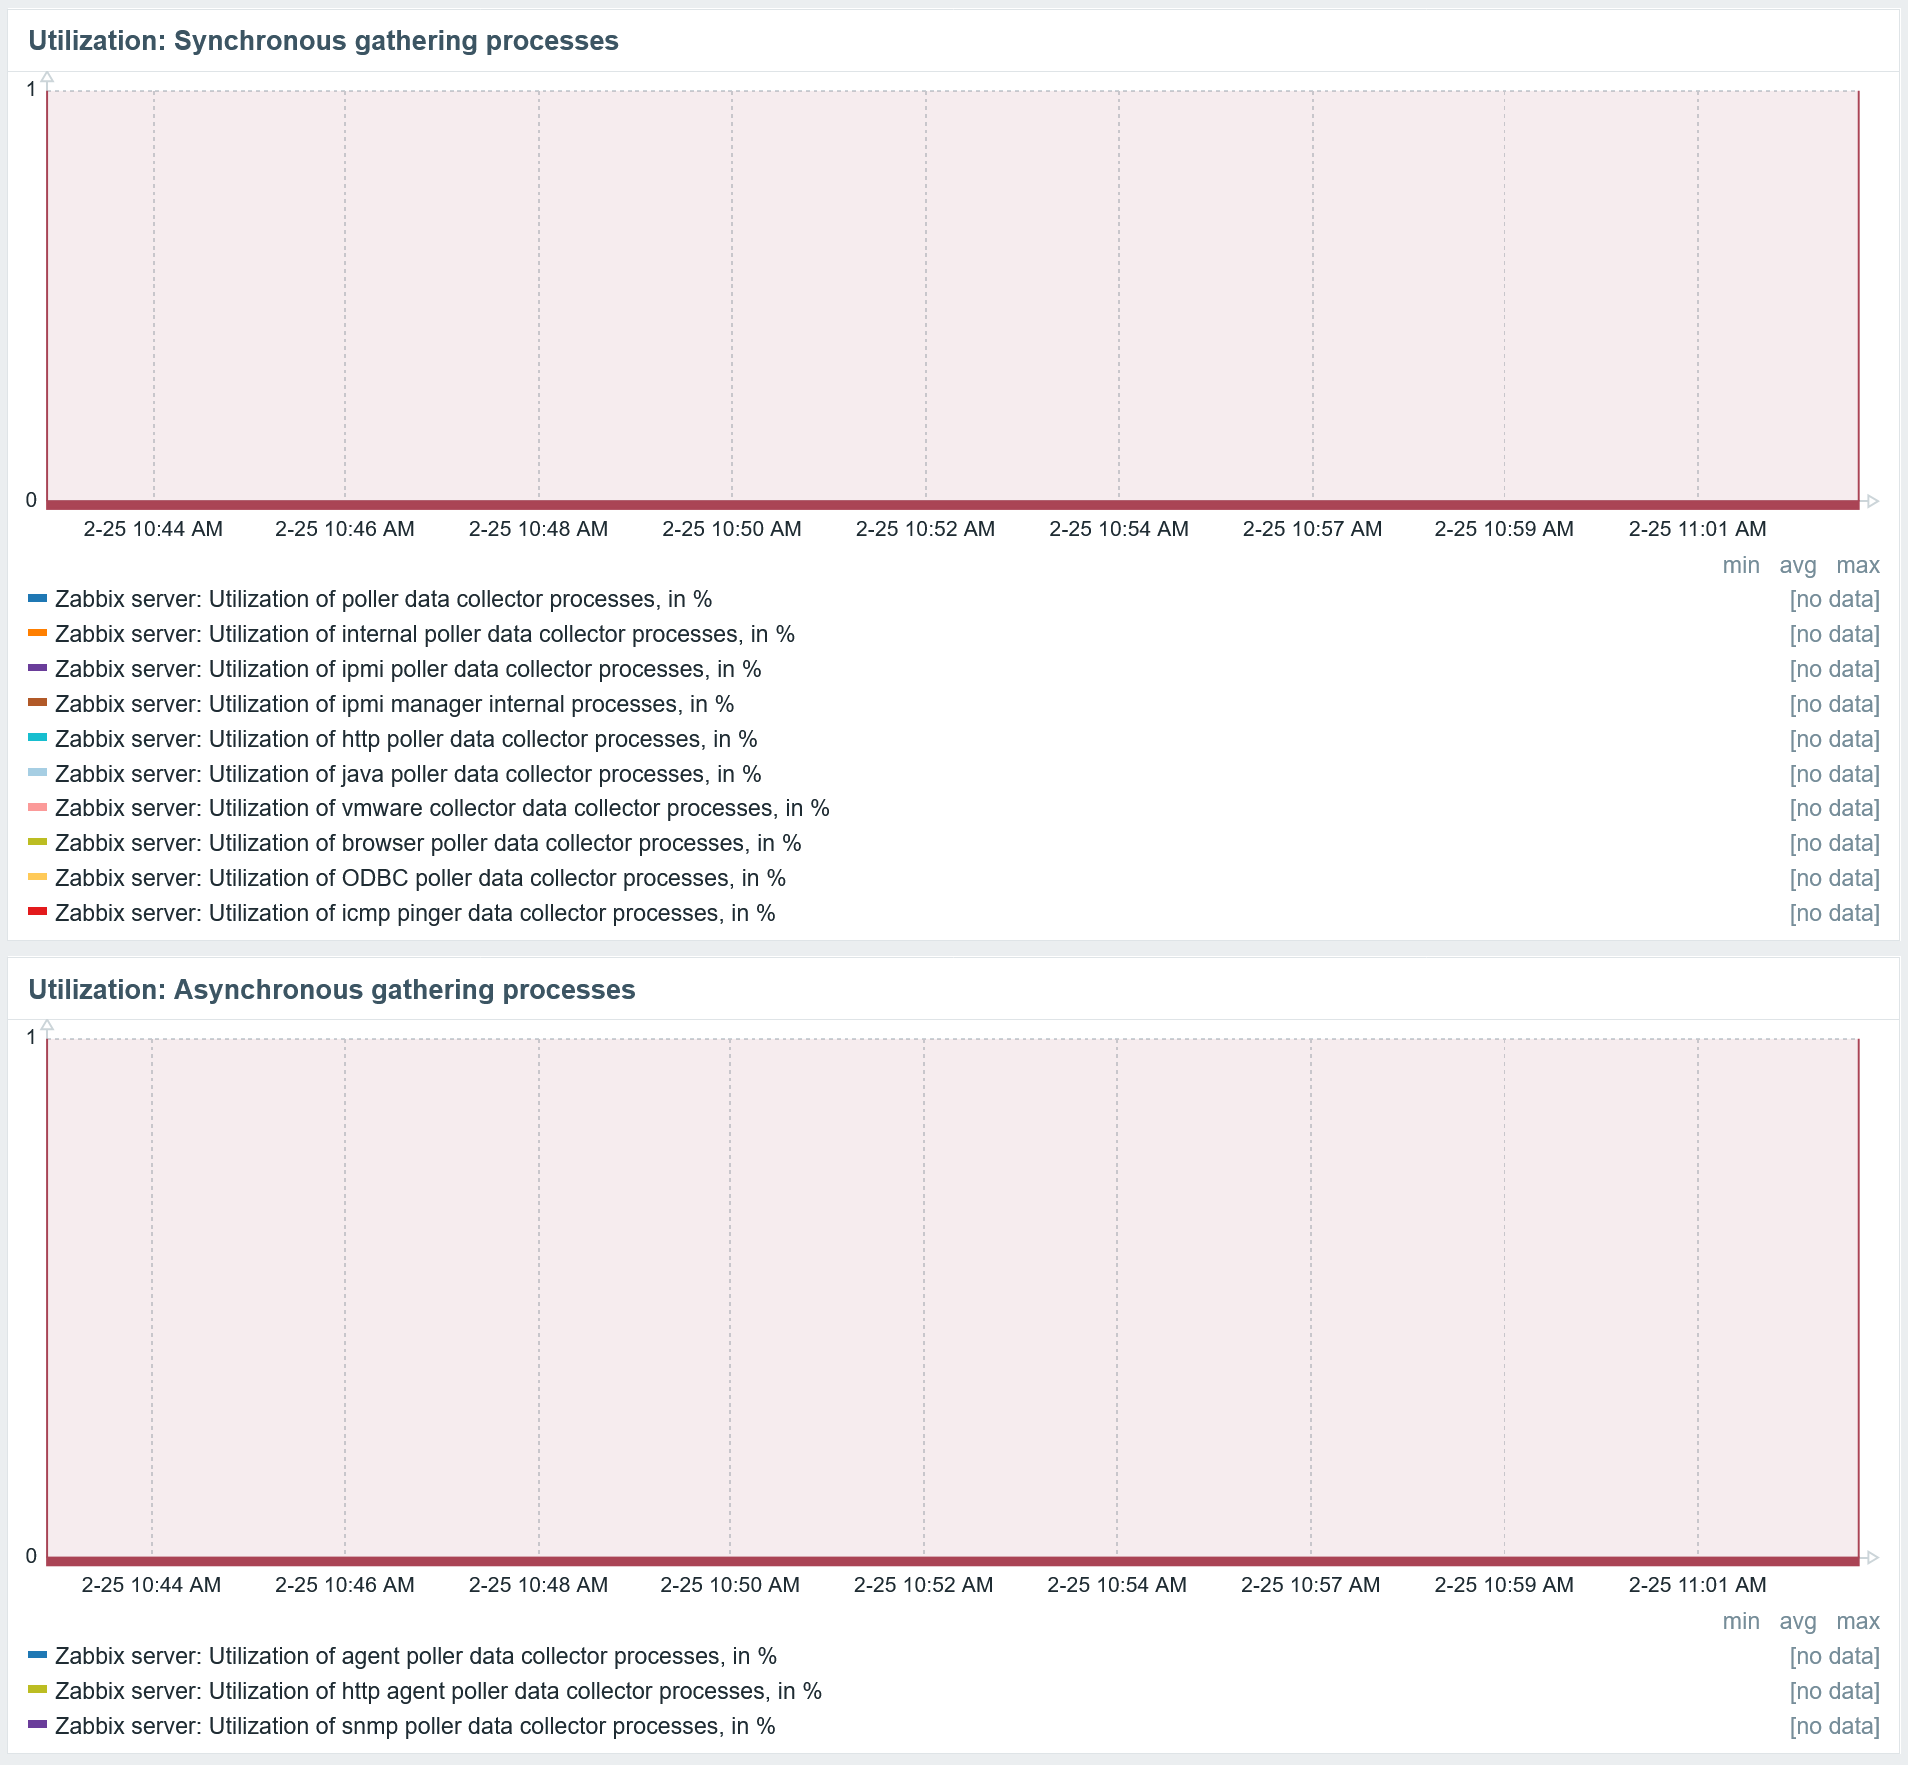
For the data collectors, generally you require only a relatively small number of asynchronous data collectors, as they are very efficient, relatively larger number of synchronous data collectors. The graphs showing the utilisation of the gathering processes are extremely useful for determining which ones need to be increased – if they are close to 100% utilized, it’s now time for you to take action and add more.
Pitfalls of misconfiguration
Now, regarding the pitfalls of misconfiguration or lack of tuning. Here is a scenario: installed the Zabbix components, MySQL database without any configuration tuning, except the configuration cache to avoid the Zabbix server crashing immediately. The Zabbix server is monitoring around ~400 hosts. The Zabbix agent poller process and history syncers are utilized close to 100%, like in the Fig.17 before the tuning.
You might think that increasing both of these processes would improve the situation, for example, by doubling the count of them: more parallel agent processes should collect more data, and the more history syncers should write more data to the database.
After restarting the Zabbix server and checking the graph, both processes are close to 100% busy and the metric collection is significantly delayed. This is much worse.
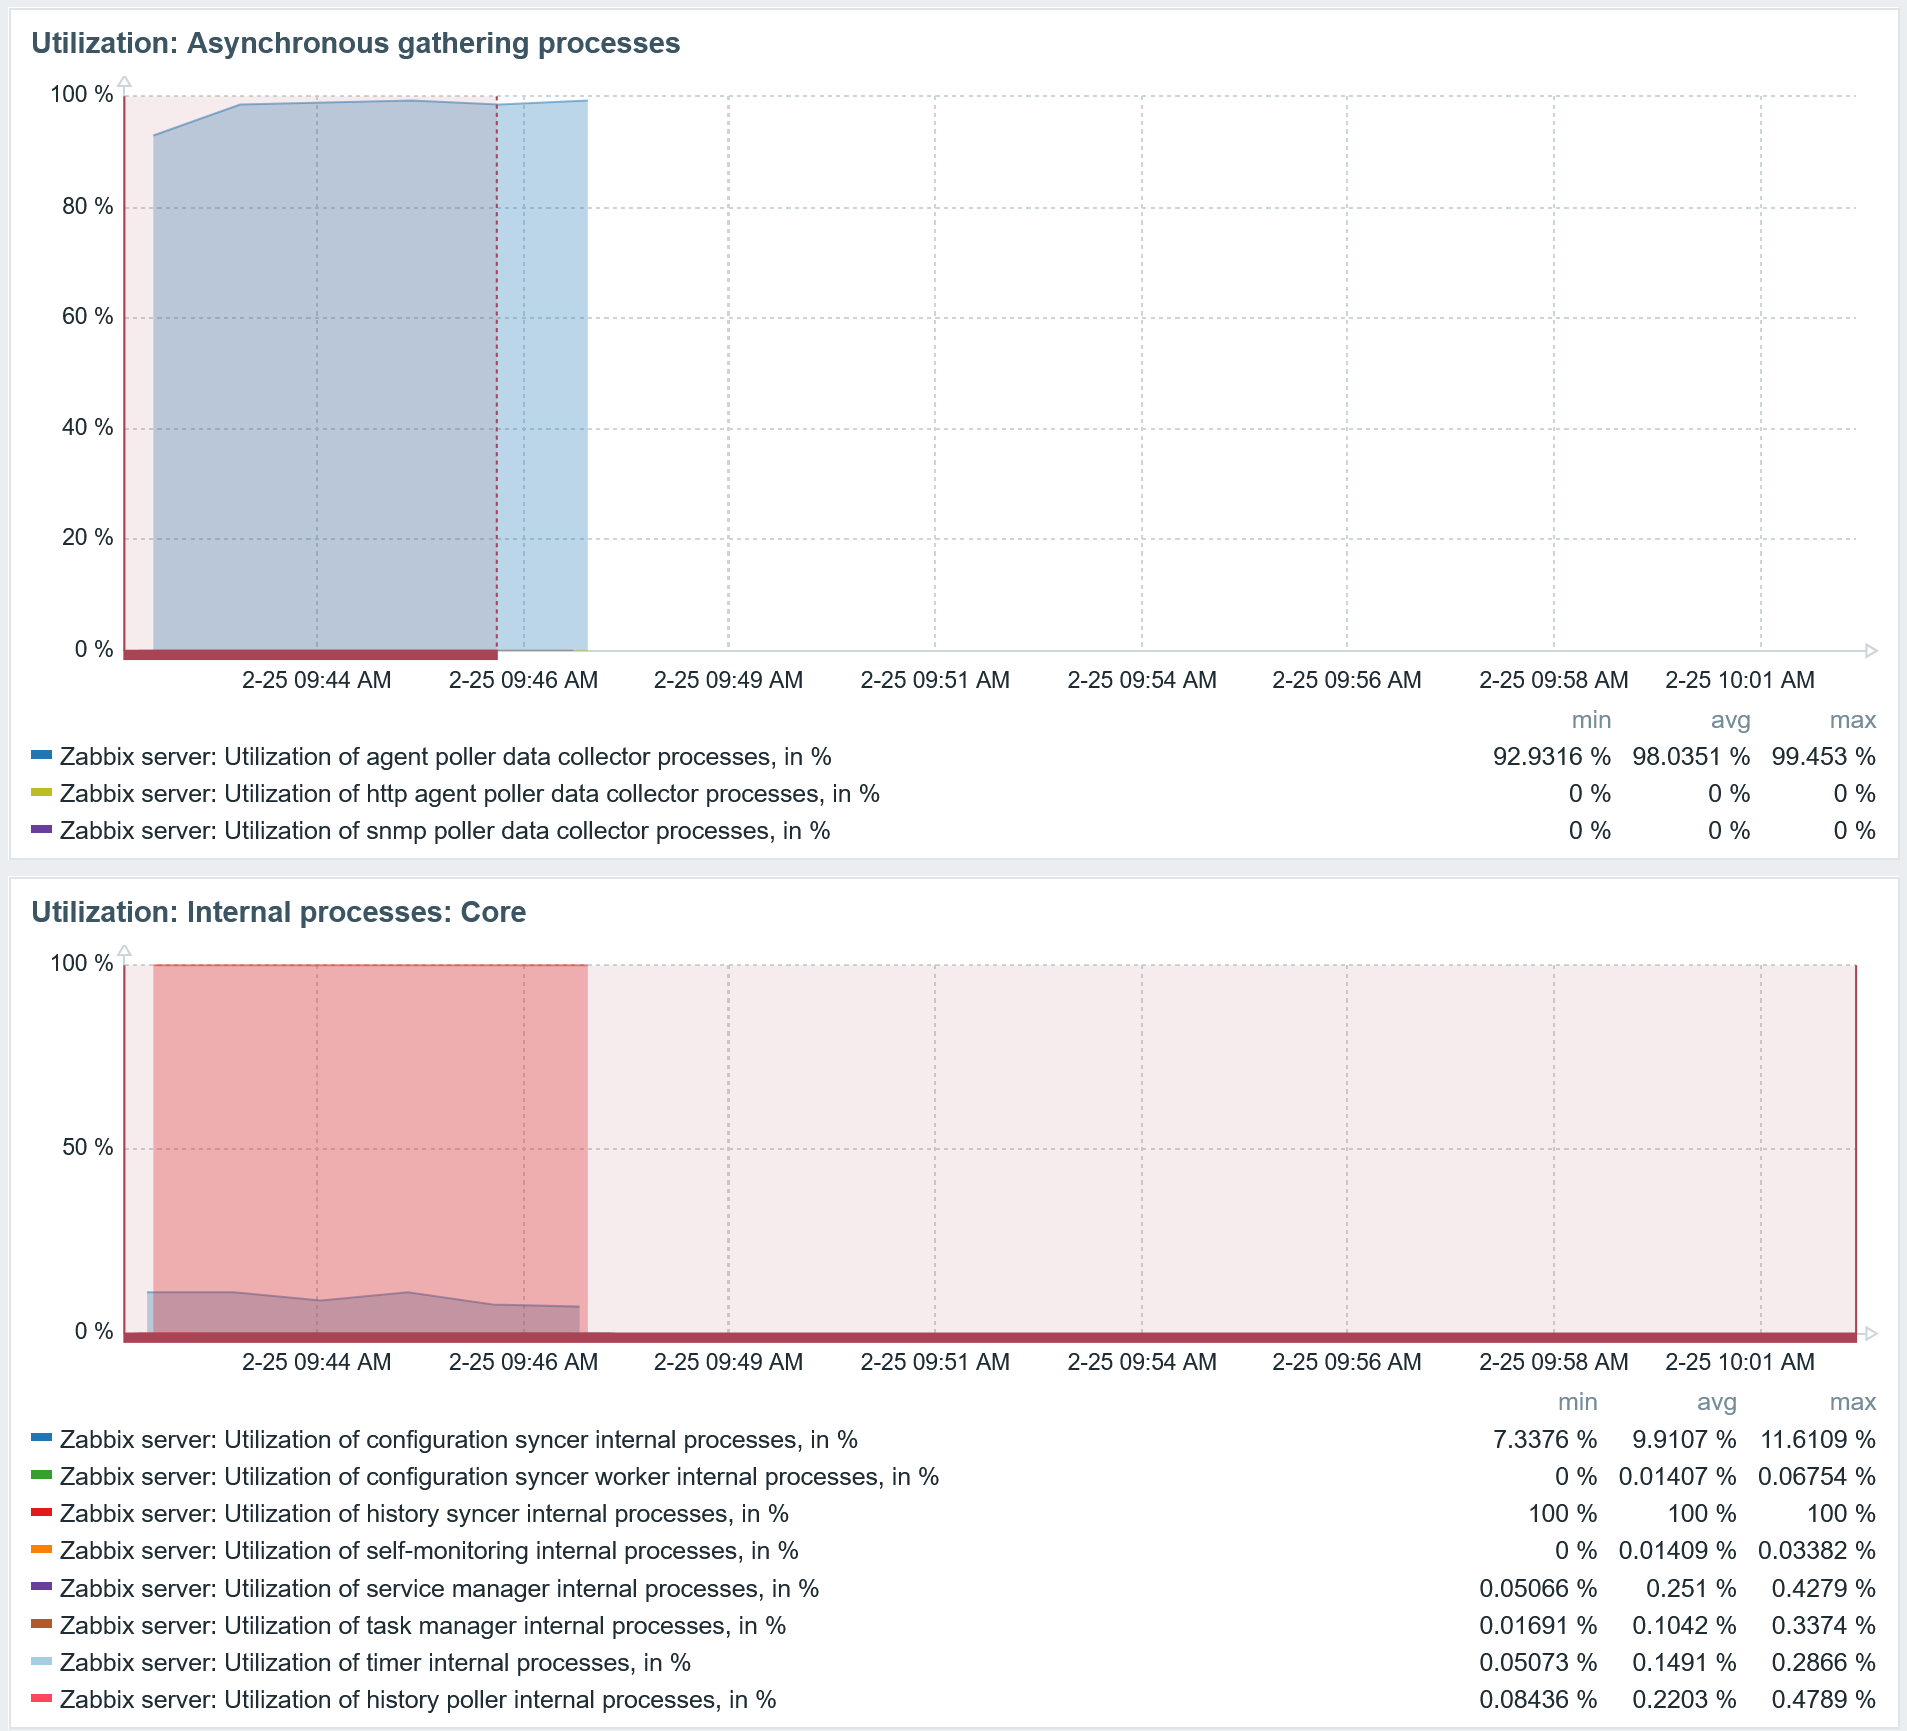
By quadrupling both processes, the result is even worse, with significantly delayed item value collection.
So, what is happening behind the frontend? Just increasing the number of agent poller collectors and history syncers results in even worse performance. Seems counterintuitive, right: more data collectors should mean more data will be collected, and more history syncers – should allow more data to be written in parallel to the database.
However, increasing the data collector count in this specific situation will just make things much worse: you can collect more data at the same time, but will still face the same bottleneck: the database. Increasing the history syncers in this case makes the situation much worse, as more simultaneous queries to the database force it to slow down even further. So once again, tune your database engine and get more performance out of it.
Summary
You should monitor all of your Zabbix components and react when issues occur. Also make sure that you receive the notifications in your preferred media type, so you can act immediately. The complete list of what to monitor is more extensive, but this blog post should provide you with some examples and inspiration. It is always a good idea to react proactively rather than deal with the issues after they occur.