The objective of this project was to establish a robust and integrated environment for the continuous monitoring of code quality and performance metrics. To achieve this, SonarQube, an open-source platform for the continuous inspection of code quality, was installed on AlmaLinux. Following its setup, SonarQube was seamlessly integrated with Zabbix, an enterprise-class open-source distributed monitoring solution, to enable the dynamic monitoring of various projects. This integration aimed to provide our team at Zen Networks with real-time visibility into key metrics such as bugs, vulnerabilities, and code smells for ongoing projects.
Table of Contents
Installing SonarQube on AlmaLinux
1. Pre-installation Requirements:
- We conducted a detailed review to ensure that the server met the minimum hardware requirements for running SonarQube effectively.
- Necessary dependencies, including Java Development Kit (JDK) and a supported database system, were installed and configured.
2. SonarQube Installation Steps:
- The SonarQube server was downloaded from the official website.
- Following best practices, a dedicated SonarQube user account was created for running the service.
- The SonarQube service was configured to start on boot, ensuring high availability.
3. Configuration:
- The sonar.properties file was meticulously edited to connect SonarQube to the chosen database, optimizing for performance and security.
- Network settings were adjusted to allow SonarQube to run on the desired port (9000) and be accessible from the developer’s workstations.
- Additional plugins were installed to extend the functionality of SonarQube and to support the languages used in our projects.
Project Setup in SonarQube
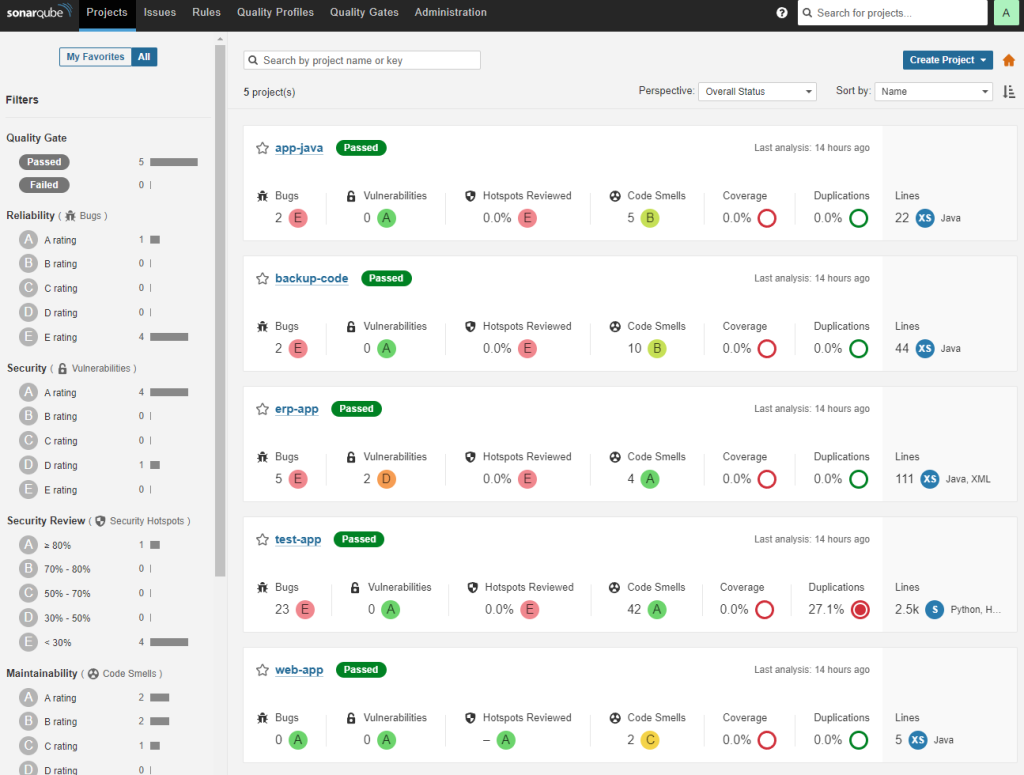
Upon successful installation and configuration of SonarQube on the AlmaLinux server, the next phase involved setting up projects for code analysis. Five test projects were created to demonstrate the capabilities of SonarQube and serve as a baseline for quality assessment.
Creation of Test Projects:
- We created a series of five distinct projects, namely app-java, backup-code, erp-app, test-app, and web-app, each configured within SonarQube.
- The projects were configured to assess various aspects of code quality, including reliability, security, and maintainability.
- We enabled the automated scanning of code to identify bugs, vulnerabilities, and code smells within each project.
Analysis and Metrics:
- Each project underwent a thorough analysis, with results indicating varying levels of bugs and vulnerabilities alongside code smells.
- Metrics such as coverage and duplication were configured to be monitored, though the initial test runs reflected 0.0% coverage, indicating a scope for further CI/CD integration.
- The test-app project notably showed a substantial number of bugs and a significant code smell count, highlighting areas for immediate improvement.
Quality Gate Status:
- All projects were set against predefined quality gates to ensure they met the organization’s standards for code quality.
- Despite some projects having bugs and code smells, all projects passed the quality gates, suggesting that non-critical issues were identified, which would be addressed in an ongoing manner.
Integration with Zabbix
The integration of SonarQube with Zabbix was aimed at leveraging Zabbix’s robust monitoring capabilities to keep a close eye on the projects’ health status in terms of code quality.
Zabbix Template Creation:
Our team built a Zabbix template dedicated to interfacing with the SonarQube API and designed to auto-discover SonarQube projects and their key metrics. For integrating Zabbix with the SonarQube API and enabling the auto-discovery of projects and key metrics, the following API calls and configurations were used:
Authentication:
Example API call to authenticate:
curl -u token: "http://sonarqube_ip/api/authentication/validate"
Project Discovery:
Example API call to list projects:
curl -u token: "http://sonarqube_ip/api/projects/search"
Metrics Retrieval:
Example API call to get project metrics:
curl -u token: "http://sonarqube_ip/api/measures/component?component=project_key&metricKeys=bugs,vulnerabilities,code_smells"
Zabbix Template Configuration:
-
- A customized Zabbix template was created to interface with the SonarQube API. The template includes discovery rules, item prototypes, and preprocessing steps to extract relevant metrics.
- Example of a discovery rule and item prototype in the Zabbix template:
<discovery_rule>
<name>sonarqube_project_discovery</name>
<type>HTTP_AGENT</type>
<key>sonarqube.project.discovery</key>
<delay>1h</delay>
<lifetime>3d</lifetime>
<item_prototypes>
<item_prototype>
<name>{#PROJECTNAME}: Metrics</name>
<type>HTTP_AGENT</type>
<key>sonarqube.project.metrics['{#PROJECTNAME}']</key>
<delay>5m</delay>
<url>{$PROTO}://{HOST.IP}:{$PORT}/api/measures/component?
component={#PROJECTNAME}&metricKeys=bugs,vulnerabilities,
code_smells,ncloc,complexity,violations</url>
<headers>
<header>
<name>Authorization</name>
<value>Basic YOUR_BASE64_ENCODED_TOKEN</value>
</header>
</headers>
</item_prototype>
</item_prototypes>
</discovery_rule>
In addition, our team set up items within Zabbix to track the number of bugs, vulnerabilities, and code smells, as presented in the SonarQube dashboard. We also configured triggers within Zabbix to alert the team when certain thresholds were reached, facilitating prompt action to maintain code quality.
Automation and Dynamic Monitoring:
We enabled the dynamic discovery of projects in SonarQube, allowing for new projects to be automatically detected and monitored without manual intervention. To enable the dynamic discovery of projects in SonarQube and ensure they are automatically detected and monitored by Zabbix, we implemented the following configurations:
- SonarQube Configuration:
- Webhooks: Configured SonarQube webhooks to notify Zabbix whenever a new project is created or updated.
- Project Tags: Used consistent tagging for SonarQube projects to facilitate easy identification in Zabbix.
- Zabbix Configuration:
- Discovery Rules: Created discovery rules in Zabbix that periodically query the SonarQube API to check for new projects.
- Low-Level Discovery (LLD): Implemented LLD in Zabbix to automate the creation of items, triggers, and graphs for each new SonarQube project.
- We also established a data flow between SonarQube and Zabbix, ensuring that updates in the code quality metrics were reflected in real time on the Zabbix dashboard.
Validation and Testing:
-
-
- We conducted a series of tests to ensure that the integration was functioning correctly.
- Our team verified that metrics reported in SonarQube matched those displayed in Zabbix, confirming the accuracy and reliability of the monitoring setup.
-
With the projects and metrics being actively monitored, the focus shifted to presenting the data effectively. A custom dashboard was created in Zabbix to aggregate and display the information gleaned from SonarQube.
Design and Layout:
We created a user-friendly dashboard to provide a quick overview of the status of all projects.
- The dashboard was organized to show metrics such as the number of bugs, vulnerabilities, code smells, and the Quality Gate status of each project at a glance.
- Particular attention was paid to visual hierarchy and layout, ensuring that the most critical metrics were immediately visible.
Custom Widgets and Visualizations:
Widgets were customized for each key metric to enhance readability and instant understanding of the project statuses.
Visual indicators, such as color-coded status icons and progress bars, were incorporated to give a clear visual cue about the health of each project.
Real-time Data Representation:
We configured the dashboard to refresh at regular intervals, providing real-time updates to the development team.
Ensured that the most current data was always available, enabling a proactive approach to quality assurance and code health.
Results and Benefits
The integration of SonarQube with Zabbix and the creation of a dedicated dashboard yielded significant benefits for development workflow and project management.
Improved Code Quality Monitoring:
- The real-time monitoring of code quality metrics allowed for quicker identification and resolution of issues.
- Developers received immediate feedback on the quality of their code, fostering a culture of quality-first in the development process.
Enhanced Visibility:
- The Zabbix dashboard provided a centralized view of the health status of all projects, enhancing visibility for both developers and management.
- Critical issues could be identified at a glance, allowing for prioritization and resource allocation to address the most pressing problems.
Streamlined Workflow:
- Automated project discovery and monitoring reduced manual overhead, allowing developers to focus on coding rather than reporting.
- Alerts and notifications from Zabbix ensured that no critical issues went unnoticed.
Decision-making Support:
- The collected data and trends visible on the dashboard supported informed decision-making regarding code quality improvements and technical debt management.
- The ability to track historical data enabled the team to measure the impact of implemented changes over time.
Proactive Issue Management:
- The early detection of bugs and vulnerabilities allowed the team to address issues before they escalated, reducing potential risks to project timelines and quality.
- The Quality Gate statuses helped maintain a consistent standard of code quality across all projects.
Special thanks to the team at Zen Networks (Oumaima Naami, Karim Chadil, and Fayçal Noushi) for their work on this project.


 Prev Post


