My name is Mark Vilensky, and I’m currently the Scientific Computing Manager at the Weizmann Institute of Science in Rehovot, Israel. I’ve been working in High-Performance Computing (HPC) for the past 15 years.
Our base is at the Chemistry Faculty at the Weizmann Institute, where our HPC activities follow a traditional path — extensive number crunching, classical calculations, and a repertoire that includes handling differential equations. Over the years, we’ve embraced a spectrum of technologies, even working with actual supercomputers like the SGI Altix.
Table of Contents
Our setup
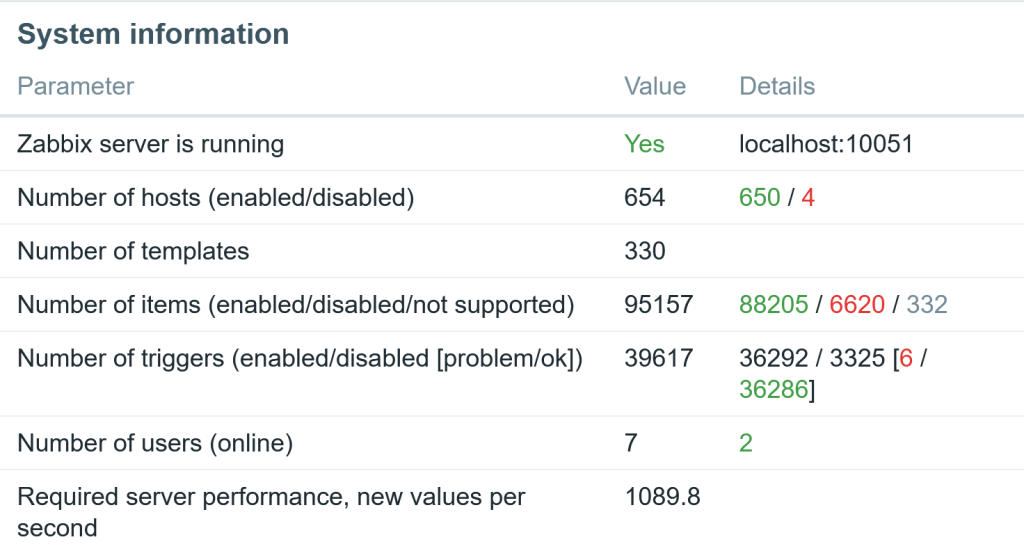
As of now, our system boasts nearly 600 compute nodes, collectively wielding about 25,000 cores. The interconnect is Infiniband, and for management, provisioning, and monitoring, we rely on Ethernet. Our storage infrastructure is IBM GPFS on DDN hardware, and job submissions are facilitated through PBS Professional.
We use VMware for the system management. Surprisingly, the team managing this extensive system comprises only three individuals. The hardware landscape features HPE, Dell, and Lenovo servers.
The path to Zabbix
Recent challenges have surfaced in the monitoring domain, prompting considerations for an upgrade to Red Hat 8 or a comparable distribution. Our existing monitoring framework involved Nagios and Ganglia, but they had some severe limitations — Nagios’ lack of scalability and Ganglia’s Python 2 compatibility issues have become apparent.
Exploring alternatives led us to Zabbix, a platform not commonly encountered in supercomputing conferences but embraced by the community. Fortunately, we found a great YouTube channel by Dmitry Lambert that not only gives some recipes for doing things but also provides an overview required for planning, sizing, and avowing future troubles.
Our Zabbix setup resides in a modest VM, sporting 16 CPUs, 32 GB RAM, and three Ethernet interfaces, all operating within the Rocky 8.7 environment. The database relies on PostgreSQL 14 and Timescale DB2 version 2.8, with slight adjustments to the default configurations for history and trend settings.
Getting the job done
The stability of our Zabbix system has been noteworthy, showcasing its ability to automate tasks, particularly in scenarios where nodes are taken offline, prompting Zabbix to initiate maintenance cycles automatically. Beyond conventional monitoring, we’ve tapped into Zabbix’s capabilities for external scripts, querying the PBS server and GPFS server, and even managing specific hardware anomalies.
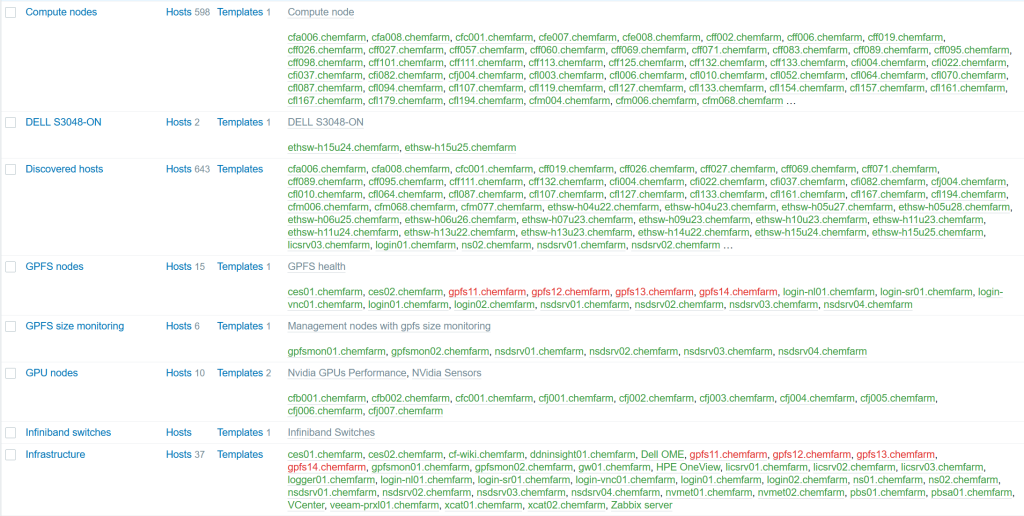
The Zabbix dashboard has emerged as a comprehensive tool, offering a differentiated approach through host groups. These groups categorize our hosts, differentiating between CPU compute nodes, GPU compute nodes, and infrastructure nodes, allowing tailored alerts based on node types.
Alerting and visualization
Our alerting strategy involves receiving email alerts only for significant disasters, a conscious effort to avoid alert fatigue. The presentation emphasizes the nuanced differences in monitoring compute nodes versus infrastructure nodes, focusing on availability and potential job performance issues for the former and services, memory, and memory leaks for the latter.
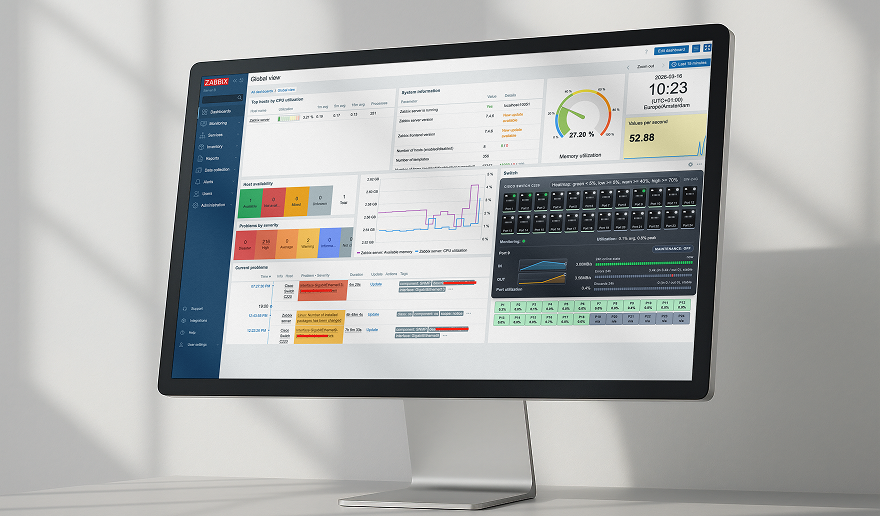
The power of visual representations is underscored, with the utilization of heat maps offering quick insights into the cluster’s performance.
Final thoughts
In conclusion, our journey with Zabbix has not only delivered stability and automation but has also provided invaluable insights for optimizing resource utilization. I’d like to express my special appreciation for Andrei Vasilev, a member of our team whose efforts have been instrumental in making the transition to Zabbix.


 Prev Post


