The Ventspils International Radio Astronomy Center (VIRAC / VSRC) is a radio astronomy installation belonging to the Ventspils University of Applied Sciences.
It observes a wide variety of near-Earth and deep-space objects in the radio-wave spectrum, using RT-32 and RT-16 telescopes, which are parabolic antennas with diameters of 32m and 16m as well as a LOFAR phased antenna array.
Among its most notable ongoing projects is the establishment of cooperation with the Swedish Space Corporation (SSC) and participation in the European VLBI Network (EVN), where VIRAC performs joint simultaneous observations with similar stations worldwide.
We spoke with Arturs Orbidans, Head of the Engineering and Technical Operation Group at VIRAC, and Software Engineer Kristaps Blumbergs to find out how Zabbix keeps millions of Euros worth of high-tech equipment up and running.
What are the main tasks, objectives, and problems addressed by monitoring tools at VIRAC?
The main objective of our monitoring is to obtain values from the equipment used in radio-astronomical observations, such as the antenna control system, receivers (including cryogenic ones), a stable frequency source (active hydrogen maser), digitizers, and data recorders.
If any of these values deviate from the defined norm, or if a device reports an error state, engineers are notified via email so the issue can be resolved. In addition, the availability of all servers and computers located in Irbene is monitored and their parameters are tracked.
Why Zabbix? Was there a migration from another tool?
Previously, there was no single monitoring tool that did everything in one place – there were only methods for retrieving the required values or tools intended to monitor a specific server. This meant that extending or expanding the tooling was too complex, if not impossible.
We needed a solution that could monitor values from the required equipment in one place and notify engineers about errors. We chose Zabbix because it was already used in the VSRC High-Performance Computing (HPC) department, and Zabbix itself had been recommended to that department by the ITML department of the Ventspils University of Applied Sciences.
We’d like to ask about some Zabbix infrastructure specifics at VIRAC. How are the following used?
Zabbix proxy. There are plans to introduce a Zabbix proxy to reduce the load on the Zabbix server, as it is currently the only system collecting all data.
High availability. Not implemented at the moment, but we definitely have services where it would be necessary, for example the maser–GPS PPS signal delay reader, which determines the delay between the two signals with microsecond precision. This is important for defining an accurate time reference for observations.
Reports (Scheduled reports). One weekly scheduled report is used, which graphically shows changes over time in important parameters of the active hydrogen maser.
Scripts. None have been created yet, because for now the provided templates and the use of system.run() for obtaining other values are sufficient.
Overview of items (what is collected and how). Most items come from standard Linux/Windows server templates. Custom items very often use system.run(), which executes custom scripts for data collection. In addition, .json files are read and then split into multiple items.
Problem detection (what type of triggers are used and how complex they are). The created triggers are quite basic, since the obtained data is already closely tied to the actual equipment. Therefore, for most triggers associated with the created items, we check to see whether the value is equal to a specific value or whether a numeric value falls within a defined range.
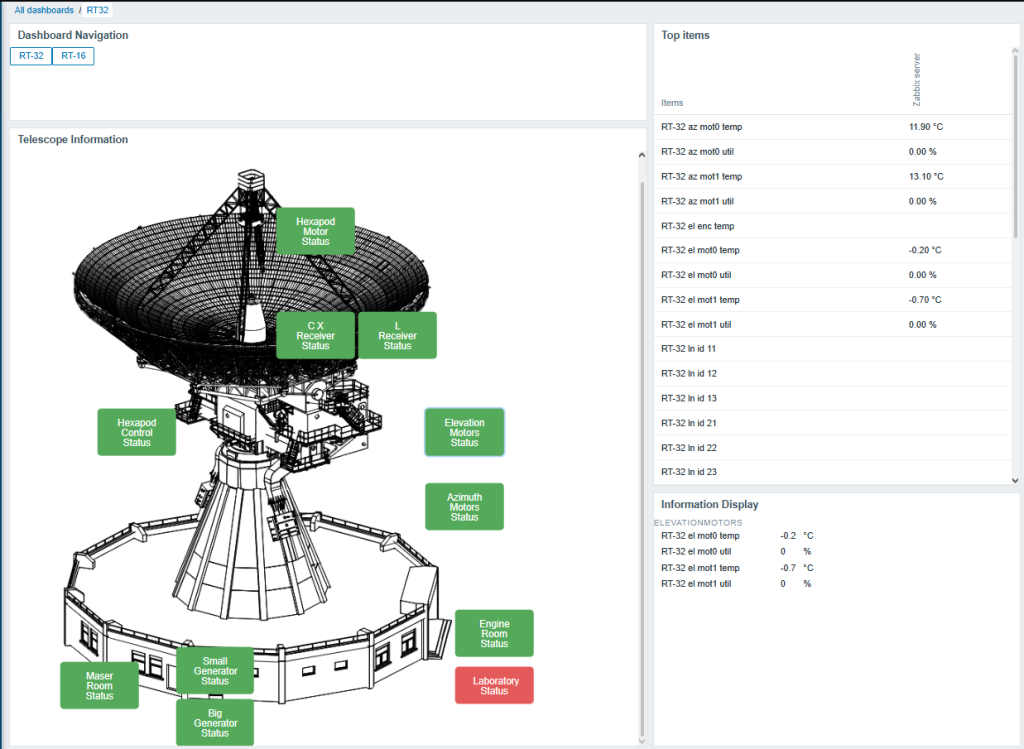
Visualization (widgets and maps). From the built-in widgets, the graph and problems widgets are used. Shortly before the release of Zabbix 7.0, custom Zabbix widgets were developed, one of which is used to navigate Zabbix dashboards. This widget consists of two buttons with links to other dashboards.
The main widget displays the radio telescopes, with additional buttons placed at specific locations that indicate whether there are any problems with equipment in that particular area. For example, the laboratory button is placed on the radio telescope schematic at the location where the laboratory is located. It is shown in green when everything is fine and in red when a problem has occurred with one of the servers in that room.
This widget functions as a custom map, and when one of the buttons is clicked, another widget displays the values associated with the selected location. At the moment, all settings for the created widgets use constant values, so they cannot yet be dynamically applied to other use cases.
The described widgets can be seen in the image shown below, where Telescope Information is the above-mentioned “map,” and the Information Display widget shows the related items/values when one of the available buttons is pressed. Meanwhile, in the top-right corner, all key values are displayed for cases where there is no desire to click on specific buttons.
Is there a specific scheme for user roles or permissions?
There is no special user scheme, because our team is very small. It consists only of an admin user and guest users, who can view the custom widgets and see whether there are any problems.
What are your impressions after working with Zabbix?
So far, we have not encountered any problems and are very satisfied with Zabbix. In fact, Zabbix has saved several important scientific observations!


 Prev Post


