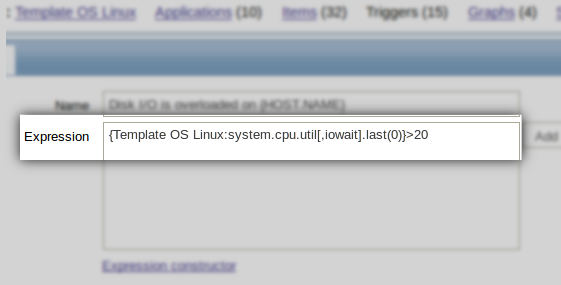
Zabbix trigger expressions provide an incredibly flexible way of defining problem conditions. If you can express your problem using plain English or any other human language, there is a great chance it could be represented using triggers.
I’ve noticed that even experienced Zabbix users are not always aware of the true power of triggers. The article is about defining problems in a smart way so that all alerts generated by Zabbix will be about real issues. No flapping, no false alarms anymore. Interested?
Let us start with some definitions first. According to Zabbix documentation, a trigger is a logical expression that defines a problem threshold and is used to “evaluate” received data.
Triggers are not limited to a single item (metric) or a host, you are free to create triggers to analyze performance and availability information from different hosts.
Simple thresholds.
A simple trigger expression may look like this:
{MySQL DB1:vfs.fs.size[/var/lib/mysql,pfree].last(0)} < 10
The first part of the expression: MySQL DB1:vfs.fs.size[/var/lib/mysql, pfree] is a unique reference to the item we process data from. In this case it is the percentage of free disk space on the MySQL DB1 host.
last(0) is a function that returns the most recent value.
Therefore the whole expression means that if the percentage of free disk space on /var/lib/mysql volume goes below 10% we have a problem.
A few more examples:
CPU load is too high
{MYSQL DB1:system.cpu.load.last(0)} > 2
MySQL is overloaded, too many transactions per second
{MySQL DB1:mysql.tps.last(0)} > 10000
Incoming traffic is more than 50Mbps
{Firewall:net.if.in[eth0].last(0)} > 50M
No Apache processes running
{MySQL DB1:proc.num[apache2].last(0)} = 0
Do you see any issues? Think again. Right, such triggers may lead to flapping when values are jumping above and below our threshold in case of isolated performance or availability issues.
Note that Zabbix comes with templates that use simple thresholds. We did it for simplicity’s sake. Simple trigger expressions are easy to understand, especially for beginners.
It is probably the reason why sometimes our users say that Zabbix is too sensitive, it generates too many alarms or there is no flapping detection.
Making it less sensitive.
This is where more advanced trigger functions come in handy. Our CPU load is too high trigger expression may take advantage of the min() function. Look:
{Oracle DB1:system.cpu.load.min(5m)} > 2
Now we are calculating the minimum of all values for the last 5 minutes. This expression means that CPU load stayed above 2 for the last 5 minutes, i.e. there were no values below 2.
Great! Now the trigger has become much less sensitive. It will not alert us any time the CPU load jumps above 2.
Eliminating flapping and false alarms – hysteresis.
Hysteresis is an extremely useful but often overlooked feature. It allows us to define different conditions for problem and recovery state. Suddenly our triggers become much smarter if powered by hysteresis.
How does it work? Zabbix supports a {TRIGGER.VALUE} macro, which returns the current trigger status as an integer (0 – ok, 1 – problem) and can be used directly in trigger expressions.
Let’s have a look at this example:
({TRIGGER.VALUE}=0 & {Oracle DB1:system.cpu.load.last()} > 2)
|
({TRIGGER.VALUE}=1 & {Oracle DB1:system.cpu.load.last()} > 1)
The {Oracle DB1:system.cpu.load.last()} > 2 part defines when a problem starts, while the second part of the expression: {Oracle DB1:system.cpu.load.last()} > 1 defines the condition to stay in the problem state.
The problem definition is much smarter now. We have a problem if CPU load is more than 2, while recovery happens only if the CPU load goes below 1.
A few more examples, note the use of different trigger functions.
CPU load is too high
({TRIGGER.VALUE}=0 & {Oracle DB1:system.cpu.load.min(5m)} > 2)
|
({TRIGGER.VALUE}=1 & {Oracle DB1:system.cpu.load.min(10m)} > 0.5)
Lack of free disk space on /var/lib/mysql
({TRIGGER.VALUE}=0 & {MySQL:vfs.fs.size[/var/lib/mysql,pfree].last(0)} < 10)
|
({TRIGGER.VALUE}=1 & {MySQL:vfs.fs.size[/var/lib/mysql,pfree].last(0)} < 30)
Best practices
- Do not start writing trigger expressions before you know precisely what problem you are trying to describe; define and pronounce it first.
- Do not rely on standard templates; review everything: data you are collecting, data collection frequency, trigger expressions, thresholds. Remember that you know your environment better than we do.
- Define problem conditions wisely. Use advanced trigger functions and hysteresis.
- Use global, template, and host-level macros instead of fixed values in trigger expressions. You will be able to tune the thresholds of thousands of triggers with two or three mouse clicks this way.
Additional reading
- List of available trigger functions
- Detect anomalies: time-shift functions (search for time_shift)
- User macros explained


 Prev Post


Another useful example (I hope;)).
To monitor fast growth of a database that is located in dedicated disk we use item key vfs.fs.size[t:,free] for watching free space on disk T:.
Then we have trigger which is called “DBname grows quickly on {HOST.HOST}: 10GB for 2 hours” with following expression:
({hostname:vfs.fs.size[t:,free].max(2h)} – {hostname:vfs.fs.size[t:,free].last(0)}) > 10G
Nice example, thanks. Also we may use several threshold values in the same trigger:
{hostname:vfs.fs.size[t:,free].max(2h)}<10G

|

{hostname:vfs.fs.size[t:,free].last(0)}<5G
In this case we''ll be notified immediately if there is less than 5G or after two hours if there was less than 10G for the last two hours on disk t:.
I would also like to encourage using triggers that can detect deflection from the normal baselines, rather than defining strict thresholds.
For example – alert if the minimal value of the last 3 temperature measurements is 4 degrees higher than the avarage temperature for the last 90 days:
({PDU:temp_sensor.avg(90d)}+4)<{PDU:temp_sensor.min(#3)}note that grabbing history information over 90 days can be a performance killer on larger installations
Hello!
I want to create trigger for Interface utilization. Using LLD i get item Interfaces:InterfaceUTILIZATION[{#SNMPVALUE}]
I want to create trigger that fires if item value is higher than 75% for last 5 pools and returns OK if it’s lower than 75% for last 5 pools.
I have set trigger like that:
({TRIGGER.VALUE}=0].min(#10)}>75)
|
({TRIGGER.VALUE}=1].max(#10)}<75)
And now it's flapping… with every pool it changes state for OK to PROBLEM or vice versa..
Here is copy of notifications I get…
STATUS: PROBLEM
Last 5 values:
#1: 76.28 %
#2: 76.92 %
#3: 76.91 %
#4: 78.42 %
#5: 79.38 %
STATUS: OK
Last 5 values:
#1: 79.04 %
#2: 76.28 %
#3: 76.92 %
#4: 76.91 %
#5: 78.42 %
STATUS: PROBLEM
Last 5 values:
#1: 75.15 %
#2: 79.04 %
#3: 76.28 %
#4: 76.92 %
#5: 76.91 %
STATUS: OK
Last 5 values:
#1: 77.38 %
#2: 75.15 %
#3: 79.04 %
#4: 76.28 %
#5: 76.92 %
What am I doing wrong? Is my logic broken (most likely…:))?
sorry…
i have set trigger like that:
({TRIGGER.VALUE}=0&{Interfaces:InterfaceTrafficINUtil[{#SNMPVALUE}].min(#10)}>75)

|

({TRIGGER.VALUE}=1&{Interfaces:InterfaceTrafficINUtil[{#SNMPVALUE}].max(#10)}<75)
Sorry for the late response, just noticed your comment. Note that the second part of the expression defines condition to stay in problem state. Here is a correct trigger expression, I renamed host name and item keys so it could fit here without scrolling:
({TRIGGER.VALUE}=0&{Host:IfIn[{#SNMPVALUE}].min(#5)}>75)

|

({TRIGGER.VALUE}=1&{Host:IfIn[{#SNMPVALUE}].max(#5)}>75)
Thank you that helps a lot. Is there a way to identify the most instable Triggers easily?
Cheers
I’ve searched and posted elsewhere but still have not had success. I wish to have a problem triggered on a windows event ID ‘error 190’ The program continually retries until it succeeds. At which point I want the trigger to recover to ok on event ID ‘info 190’
Closest I get is clearing the trigger with .nodata but its not truly the notifications I want. Tried this.
({TRIGGER.VALUE}=0 and ({WIN-TEST:eventlog[Backup,,Error,,190].logeventid(190)}=1 or
({TRIGGER.VALUE}=1 and ({WIN-TEST:eventlog[Backup,,Information,,190].logeventid(190)}=1
Any thoughts/ help appreciated.
[…] followed the examples in some article and tried […]