


Tag:
monitoring

Optimized Monitoring for Hybrid Environments with ICT Solutions

April 15, 2026
Case Study
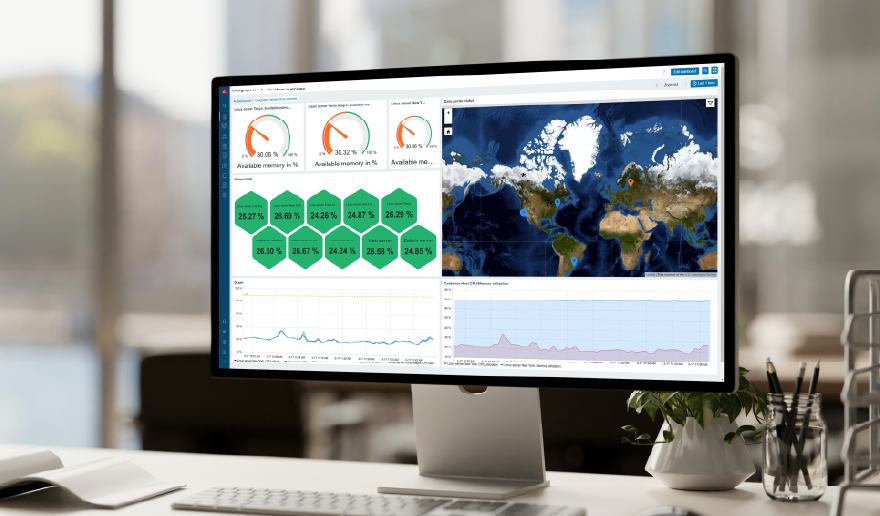
ICT Solutions is a managed service provider (MSP) specializing in fully managed IT Support, cloud, cybersecurity and more. Based in Liverpool, they offer IT support across the UK.

Detect Issues in Your Zabbix Instance Before It’s Too Late

March 25, 2026
How To
In this blog post, I will show you how to detect performance issues in your Zabbix instance – in advance!
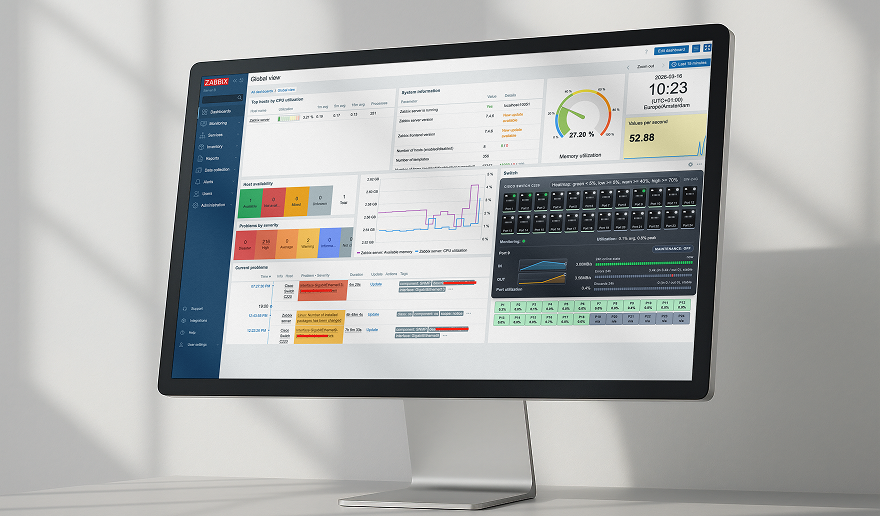
Port Monitoring with the Zabbix Widget Switch

March 18, 2026
Integrations
If you’ve ever monitored network switches in Zabbix, you know perfectly well that the data is there. Interfaces are polled via SNMP, triggers fire when a port goes down, and events are logged. Technically, everything works.

Showcasing Our Potential at Europol Industry and Research Days
March 11, 2026
News
On February 24-26, Europol, the official law enforcement agency of the European Union. welcomed leading innovators, researchers, and law enforcement representatives to its headquarters in The Hague for the third edition of Europol Industry and Research Days.

Modernizing Public Service Monitoring with Zabbix and Prodemge
February 25, 2026
Case Study
Prodemge is the public IT company responsible for supporting the digital systems and services that drive the Government of Minas Gerais in Brazil. Its operations cover essential areas such as healthcare, education, public safety, finance, and infrastructure, ensuring that public policies reach citizens quickly, securely, and efficiently.

Monitoring the Stars with Zabbix and VIRAC
February 10, 2026
Technical
The Ventspils International Radio Astronomy Center (VIRAC / VSRC) is a radio astronomy installation belonging to the Ventspils University of Applied Sciences.

Zabbix in 2025: A Year of Growth, Community, and Innovation
January 20, 2026
Community
2025 has been a dynamic and crucial year for Zabbix — marked not just by global events and major releases, but also by meaningful community engagement, an important milestone in our history, new ways of sharing expertise, and headcount growth around the world – all while making sure our product evolves to provide even more […]
Keep Your Printers Happy with Zabbix and PaperCut NG
December 23, 2025
Integrations
We all know the panic when the print system goes down. As I’ve written about before, PaperCut NG is a fantastic tool for managing printing, but even the best software needs a watchful eye to prevent unexpected downtime.
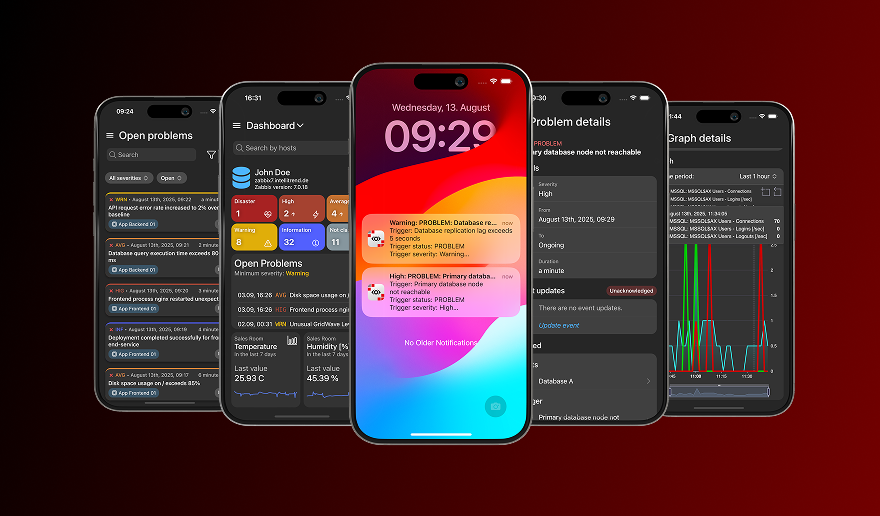
Put Zabbix at your Fingertips with the IntelliTrend Mobile App

December 16, 2025
Integrations
The official Zabbix frontend works great on desktop, but it isn’t built for mobile. Monitoring doesn’t end when you step away from your workstation, and a reliable Zabbix mobile app keeps you connected to your Zabbix environment, gives you instant notifications, and allows you to react to problems or just check your host configuration at […]
24/7 Alerting and Two-Way Integration with Zabbix and SIGNL4

December 9, 2025
Handy Tips
It’s a familiar story for many IT operations teams: a critical server went down overnight, but the alert was buried in someone’s inbox. By the time anyone noticed, valuable time was lost, SLAs were breached, and the team spent the next morning explaining why an email hadn’t been seen. Email (or even SMS text) alone […]
Saving Time with a Custom Zabbix Agent Installer

December 4, 2025
Handy Tips
When managing large-scale infrastructure, the process of installing monitoring agents is often repetitive and time-consuming. Administrators must log into each server, manually run installation commands, and configure the agent to connect to the Zabbix server. To address this issue, the Zabbix Agent Deployer custom module was created. This module enables the direct installation of Zabbix […]
Aruba Central API Monitoring with Zabbix

November 25, 2025
Handy Tips
Aruba Central is a SaaS solution that allows you to manage your Enterprise Aruba network environment. Due to the increasing number of cloud migrations, we can expect that more and more Aruba customers will move their on-premise environment to it, which will also mean a change in their monitoring environment. In this article, I will […]
