Our Premium Partners at the ATS Group work with a large federal government agency in the United States. They primarily provide storage and compute-as-a-service for the agency, which relies on them to stay up and running at all times.
The challenge
The agency’s primary goal was to simplify their capacity and performance monitoring without extra costs. They had very strict regulatory and SLO oversight requirements that had to be met, especially when it came to capacity and performance.
There was no commercially available software that could accomplish everything they needed directly out of the box, but they still required a solution that was powerful and flexible enough to monitor almost anything.
The solution
Because the agency has several different data centers of different sizes, they use a distributed proxy set up, intense SLA reporting, a ServiceNow integration, a variety of internal integrations, and a monitoring solution provided by Zabbix that includes a predictive alerting setup.
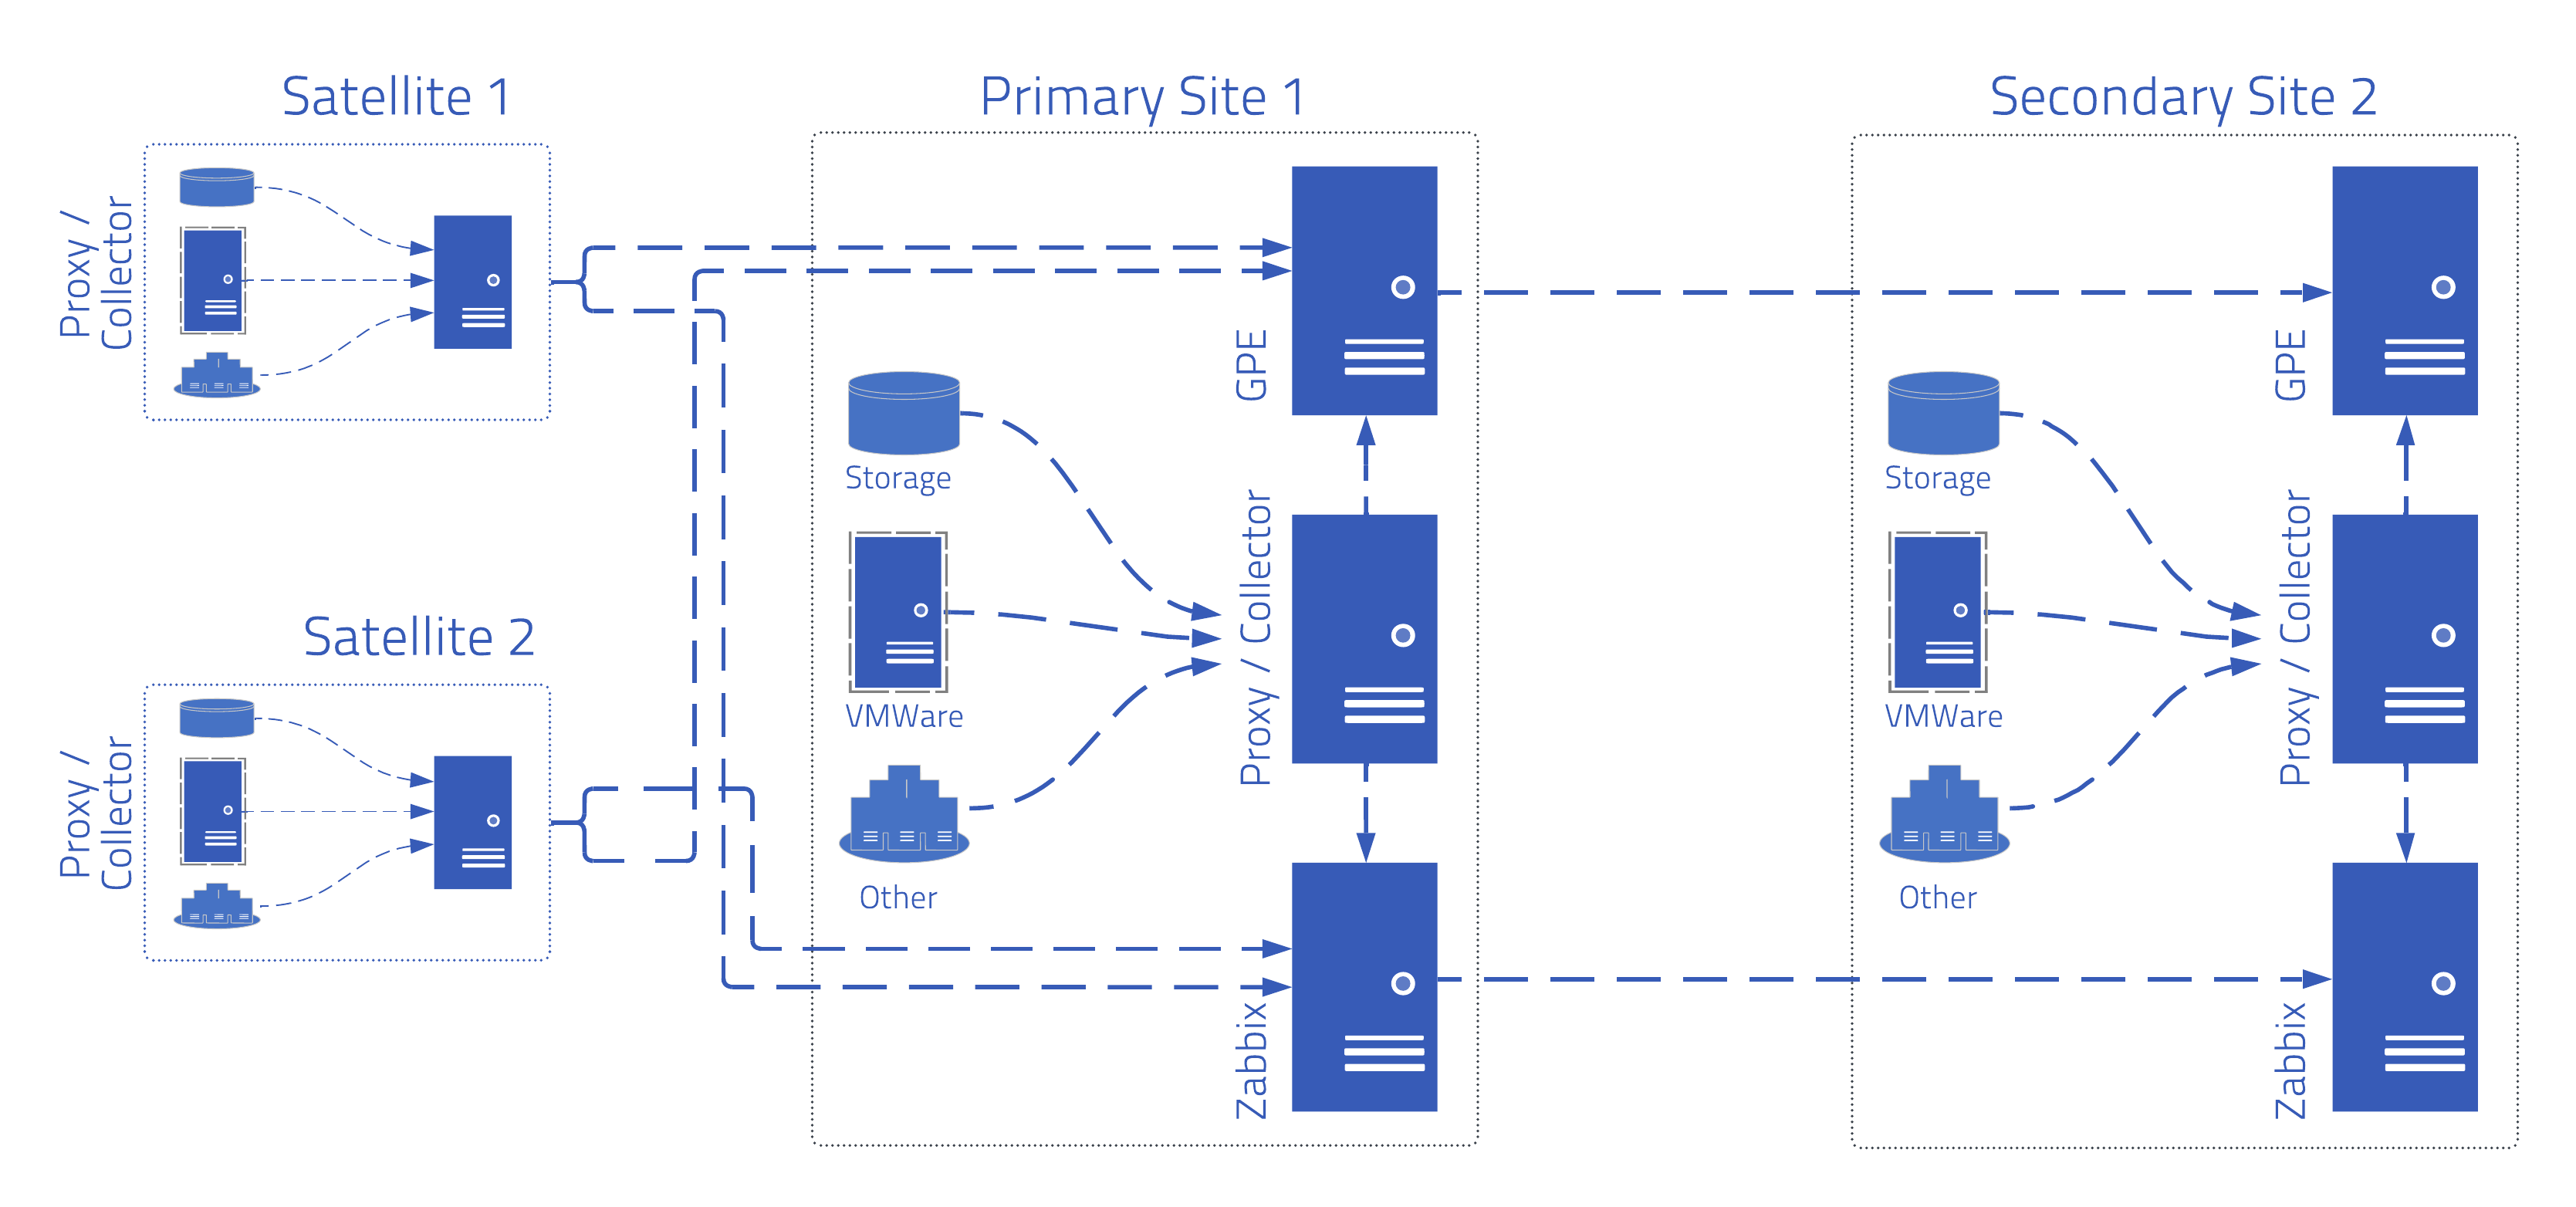
The agency has plenty of software in the mix, but it primarily relies on storage, VMWare, and Kubernetes. They also have multiple satellite offices and data centers, so that in the event of a data center failure, another can come online with minimal downtime in between.
On top of that, they have over 30 metrics and more than a trillion data points across 10 major technologies that they need to measure, primarily from a regulatory perspective. Thousands of granular metrics needed to have solutions and reporting designed for them in Zabbix, including (for example) CPU cores and frequency, processor-to-core usage metrics, and virtualization ratios from hosts to virtual machines.
Their Kubernetes-based Openshift environment also needs to be monitored to exact specifications. Deployment took place via Helm Chart, with Zabbix components being installed as Kubernetes resources, node-level resources, and applications being monitored, while data was aggregated and sent to the Zabbix server.
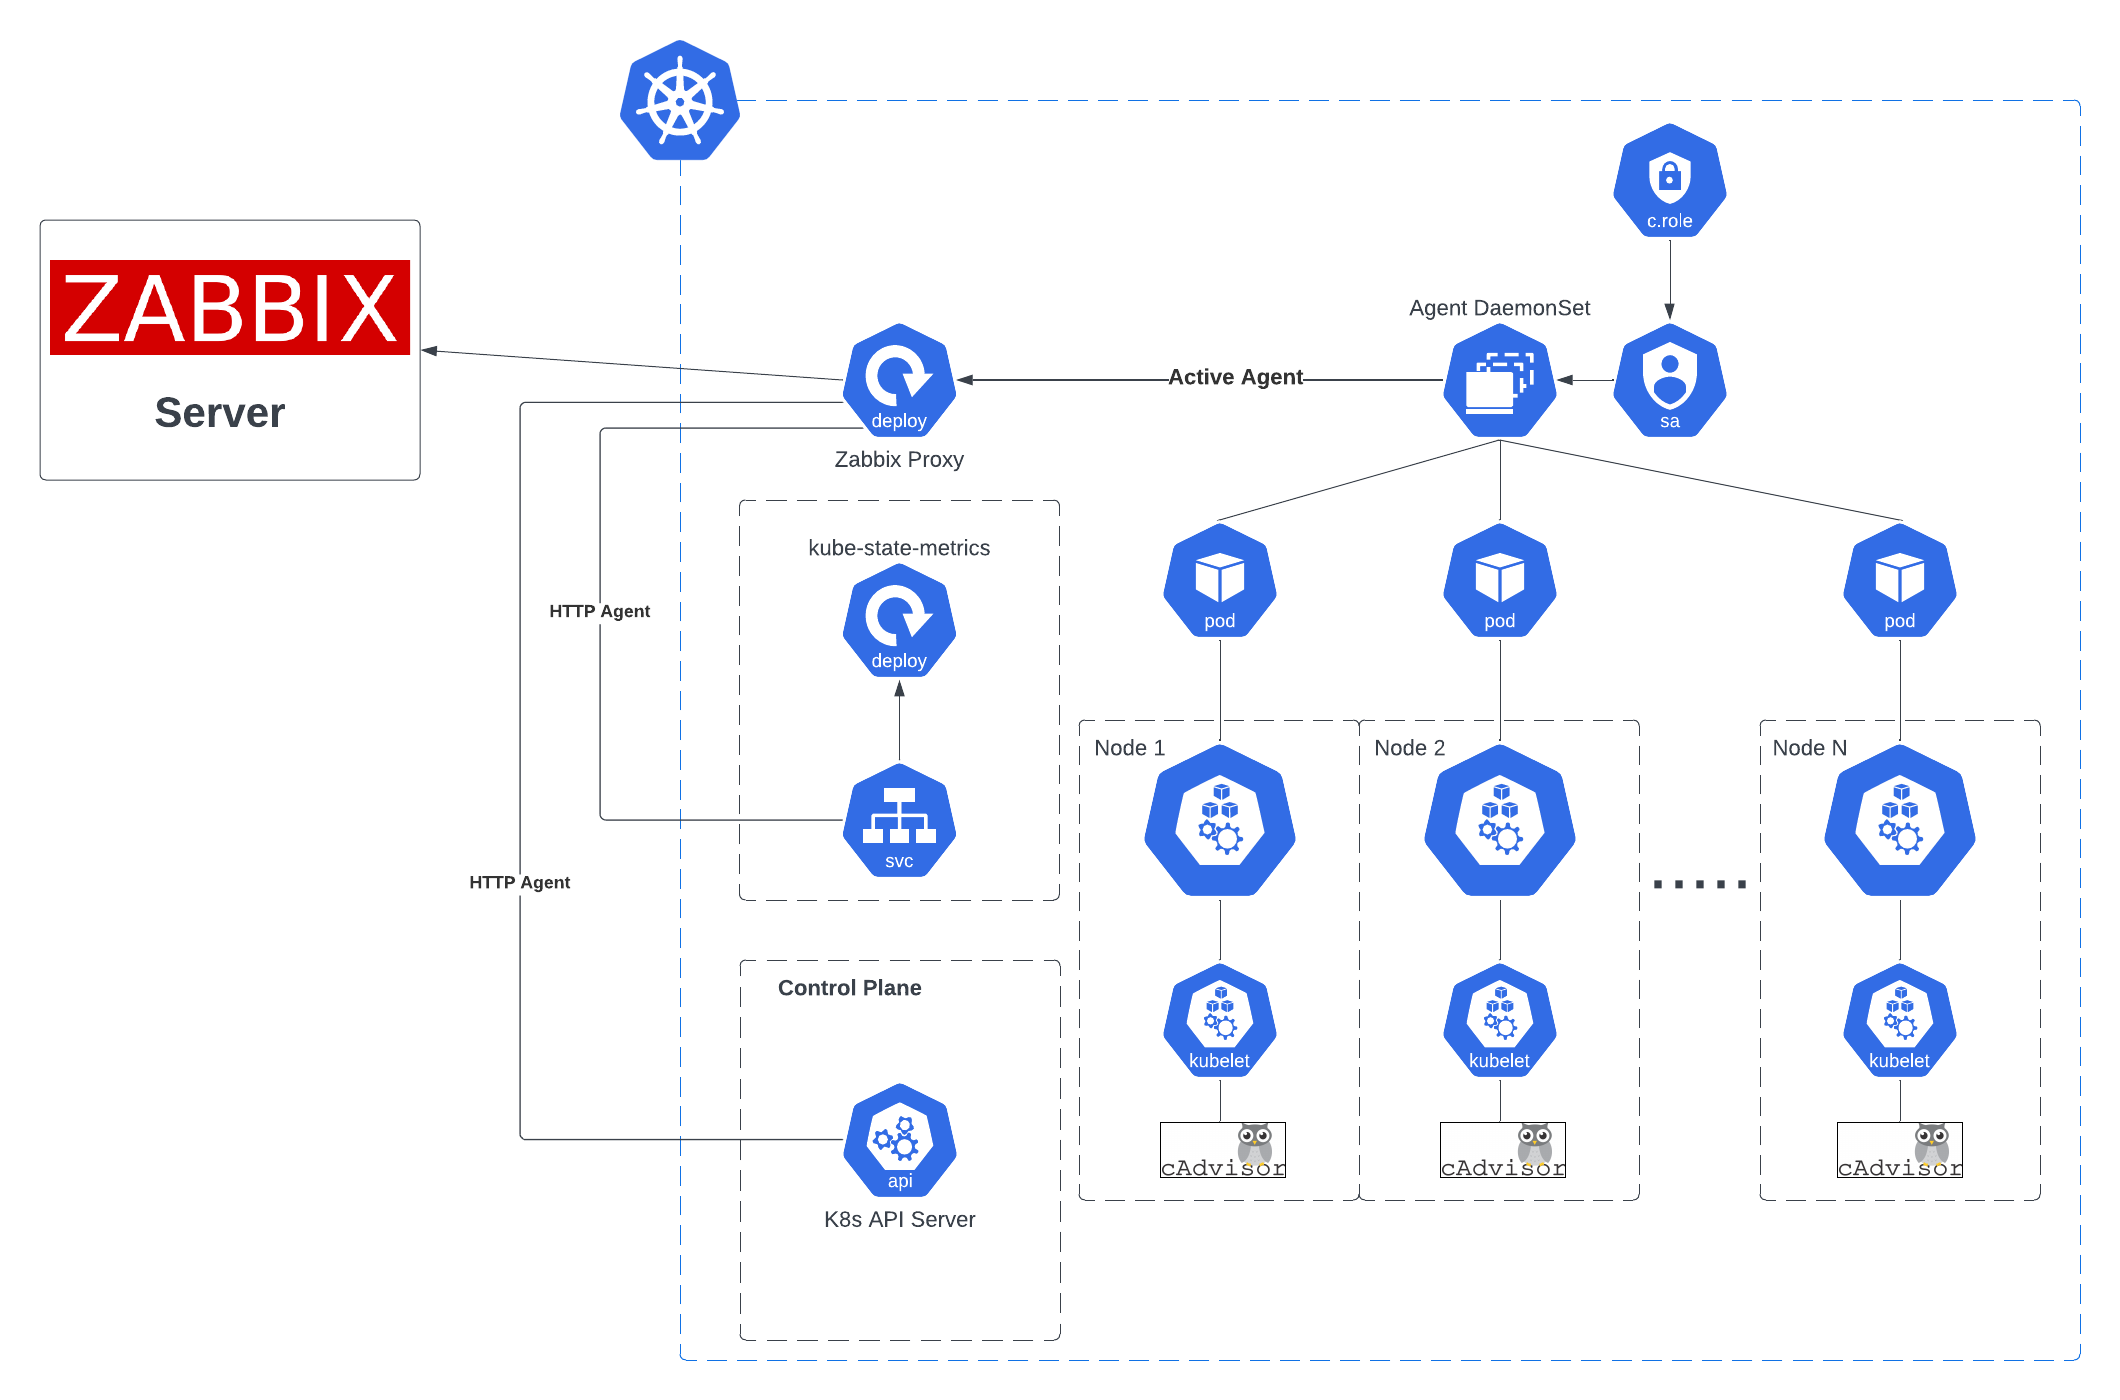
Metrics are collected via the Kubernetes API and kube-state metrics, and the solution uses Prometheus-exported metrics or direct HTTP endpoint calls. When it comes to configuration, proxies and hosts are created in Zabbix to represent Kubernetes nodes and clusters, while templates and macros are configured to point to the Kubernetes API and kube-state-metrics endpoints.
The results
Thanks to Zabbix, the federal government agency in question has a solution that provides centralized monitoring of Kubernetes alongside other IT resources, supports application-specific metrics without requiring Prometheus endpoints, and offers plenty of flexibility to customize and scale.
In addition, Zabbix’s predictive alerting capabilities identify abnormalities in operational data and predictively alert the agency about anything that could potentially impact an application or service, which lets them meet SLAs, optimize user experience, and increase productivity.
In conclusion
Zabbix’s flexibility and ease of customization make it ideal for customers who need a single source of truth that can be relied on in even the most stringent regulatory environments.
To learn more about what Zabbix can do for customers in the public sector, visit us here.