


Creating complex maps is a time-consuming job. Actually, even designing a rather small map of 25 elements can take you an hour. That’s time you rather want to spend on something useful or fun, unless you’ve got a fetish for repetitive work. All we need to automate this task, is a network/graph library like Networkx and the Zabbix API.
Notice: I’ll use the broader terms node and edge instead of the Zabbix terms map element and map link interchangeably throughout this writing. Node does not refer to distributed monitoring here.
Manual mapping
Why does it take so long to create a map manually? The work consists of two steps, once you know what you’re going to draw:
- Add and set up all the nodes and edges
- Move things around until you are happy with what you see
Adding new map elements isn’t a terribly efficient process: Click, drag, configure, repeat. Since you can’t move multiple elements at once, you have to drag them away from where they spawn one by one. Not being able to move multiple elements is particularly painful when you’re re-arranging major parts of your map. You also can’t bulk-add hosts. Even if you could, what if you wanted to bulk-add images?
If you are adding hosts to a map, each element must be configured to actually represent an existing host. That’s individual configuration, so you can’t just do it by selecting multiple elements. You also can’t clone an existing element, letting it serve as a template. You have to go through the whole creation process again instead. If you’re using icon mapping, you’ll notice that the mappings are not there while you’re editing your map. That forces you to layout elements without knowing their actual size. Needless to say, you won’t get it right on the first try!
By all means, a computer is probably better in lay-outing a complex graph anyway, trying to avoid unnecessary intersections and all that! That job is slightly aggravated by Zabbix’ exclusively using straight edges to connect nodes.
So what?
In the face of the above, we should dismiss the idea of manual editing for any non-trivial map. What we want instead, is something that can process source information that we already have or can easily provide, in order to produce ready-to-use Zabbix maps. This involves transforming information into the domain of map elements and map links, as well as laying out the nodes. The transformation is mostly up to us. We’ll leave the lay-outing to Networkx though, which will serve as an intermediate layer to a layout engine like Graphviz, Matplotlib or one of their own implementation. Let’s put the idea into action! The below provides examples for two different sources of information. The provided scripts use gescheit’s API module.
Map created from Graphviz DOT file
The Graphviz’ DOT language is a simple, plain-text syntax to define graphs. Thus it is very well suited to be diff-ed and stored in versioning systems, much like Tex. The three lines below are enough to define a graph containing two connected nodes, A and B:
graph {
  A -- B
}
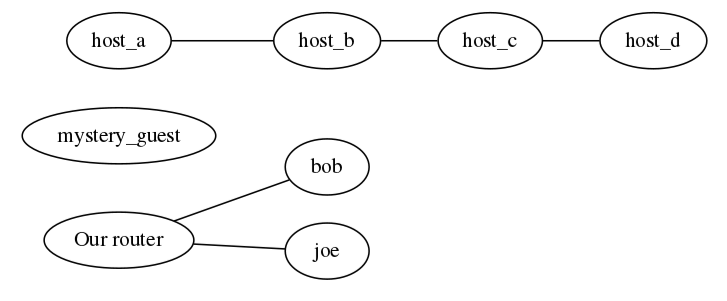
More often than not, you’ll want to add attributes to your nodes that contain valuable information for your map, such as actual host names, labels, line colours or which icons to use.
graph {
  //Look, ma, comments!
  //Let's define node details

  //We don't want to type the long host names when defining edges
  bob [hostname="bob.example.com"]
  joe [hostname="joe.tx123.ops.example.com"]

  router [label="Our router" zbximage="router"]

  mystery_guest

  //---------------------------------------------
  //Let's define connections between the nodes

  //This notation allows for muliple edges from "router" in one go
  router -- { bob joe }

  //An otherwise unconnected daisy chain of nodes without further details
  host_a -- host_b -- host_c -- host_d
 }
The syntax above defines an undirected graph. That is, the connections don’t imply a direction of flow, like on a flow chart. You could create a directed graph as well, if it helps your layout or understanding. Zabbix still won’t show arrows. Notice, if you’re using Networkx, you’ll have to patch it to allow for the curly brace notation!
You can write your DOT files in any text editor. If you desire visual feedback or syntax validation, you’re better off with vimdot or another specific editor. Sadly, vimdot doesn’t work very well for me.
The example Python script reads the DOT file into a graph. The graph is then lay-outed and the resulting coordinates are supplied to the map.create API call. Nodes that feature a hostname attribute are considered to be Zabbix hosts, while other nodes are created as images. label and color are standard Graphviz attributes. hostname and zbximage are used to hold additional information.
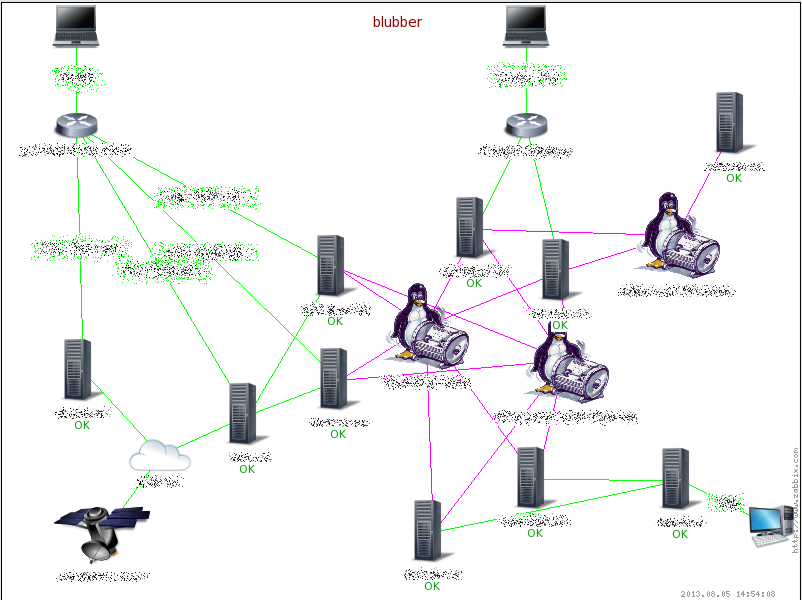
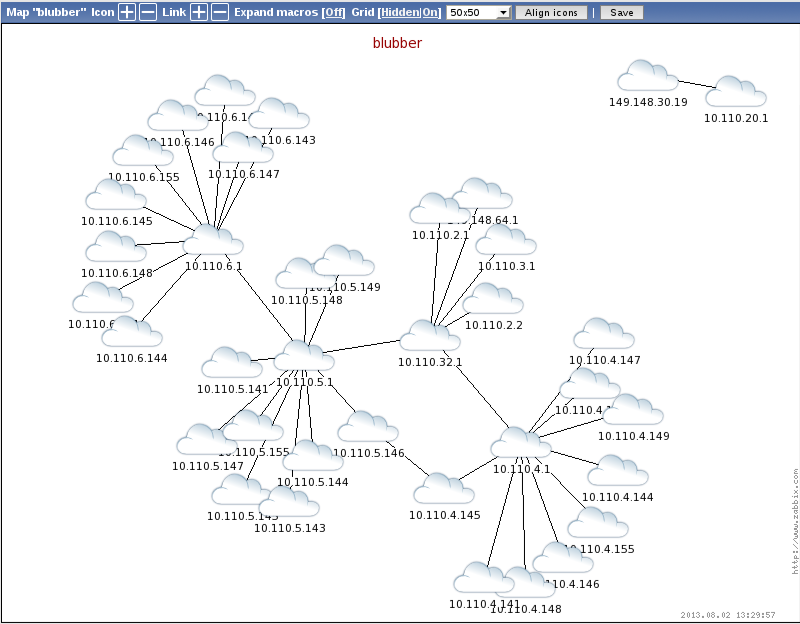
Simple topology map from neighbourhood protocol data
This example is sort of a follow-up to my talk at Zabbix Conference 2012. I felt pretty ashamed when I was asked for an actual map rendering and couldn’t provide one. I had produced a few draft renderings, but they were far from what I wanted them to be. I was still using Zabbix 1.8 at that point. Generating 1.8 map XML was a plague, due to the mixed use of XML elements and attributes. Worse yet, the XML stanzas had to be in a particular order, as they were parsed as read. This time around, we’re not generating XML, but we are using the API.
Our source data resembles the neighbourhood export format of Cisco Prime data, Cisco’s management suite, previously known as Cisco Works. You could potentially retrieve similar information via SNMP as well. The CSV file is read and a graph is constructed from the supplied data. In practice, such a graph can easily end up being too large to display on a single map, which calls for segmentation. Furthermore, you may like to add firewalls or remove irrelevant edges. The script has some hints, but I’m not going to cover these topics here. The script is not making any lookups. It just creates image nodes and adds static labels. Let your fantasy run wild about how it could be extended!
Bottom line
Generating your maps with a script can save you a lot of tedious work. Drastically speaking, it doesn’t even matter if the produced layout is total garbage. Even if you have to re-arrange everything, you still saved a lot of clicking and scrolling and waiting and dragging.
As with all generated things, manual modifications are in constant danger of being lost. It’s particularly annoying to lose the fine-adjustment you made to the layout. As long as you’re using hosts as map elements, certain changes in Zabbix configuration will be reflected. This is not the case for images, of course. Newly added hosts won’t magically appear on maps either, so manual labour or clever scripting is still necessary.
You can’t modify Graphviz layout results in a very direct manner. Different algorithms and various settings strongly influence the result, but that needs exploration. The example DOT file is showing some of them — most likely in a poor manner.
But what if …
What if we just defined maps inside Zabbix, using a Graphviz-like syntax in the first place? What if a Javascript library would layout it dynamically? It should be possible to grab existing map links and elements via the API and render a map using a library like D3 or Sigma, instead of using the Zabbix map rendering facility. That would allow for zooming, dynamic navigation and so forth. D3 could also be the weapon of choice, when it comes to chart rendering, covering wishes such as new chart types, overlays, mouse-over effects.
What if maps could be created automatically in the first place? The most prominent use case might be topology. Suites like NAV or Netdisco can gather topology information and display maps based on it. NAV is using D3 for this purpose, by the way. I don’t know if it makes any sense to duplicate the effort of gathering that data. If Zabbix could store and process topology information, a bridge might be an option. For the time being, you can still create static maps with a script periodically. Maps based on dependency are another interesting consideration and so are maps based on IP networks.
Let’s see what the future brings! Hopefully the above example scripts can help save at least one intern from carpal tunnel syndrome or a nervous breakdown.


as for “Newly added hosts won’t magically appear on maps either, so manual labour or clever scripting is still necessary.”, just wanted to note that there is a built-in (albeit somewhat limited at this time) way to make new hosts appear automatically on the maps – set the element type to ‘host group’ and then choose “host group elements”. this will show individual icons for all hosts from that group. adding new hosts to the group will make them appear on the map automatically
Hi Team,
We have used the script given to create Zabbix maps. We had tested and used it fine till 2014. Accidently the hosted node got crashed and all the files got removed. Now somehow I have build a new node and when I try to run the map creation script I’m getting the below error:
Trigger Exception is: list indices must be integers, not str
list indices must be integers, not str
Not sure how to proceed. The same map script worked fine…. So I don’t think anything to be changed in the script….
Please help
I’m afraid that’s too little information for me to help. Also, there are two scripts in this article. Which one are you referring to? Maybe you want to discuss this on Freenode IRC? I’m “volter” there.
Here is the customized script
#!/usr/bin/python2
# -*- coding: utf-8 -*-
# Volker Fröhlich, 2013
# [email protected]
“””
Creates a Zabbix map from a Dot file
zbximage and hostname are custom attributes that can be attached to nodes.
Nodes with a hostname attribute are considered Zabbix hosts and looked up
for. Other nodes are treated as images. zbximage and label can be used there.
Edges have their color and label attributes considered.
This script is meant as an example only!
“””
# Curly brace edge notation requires a patched networkx module
# https://github.com/networkx/networkx/issues/923
###### Comments By RK Date: 3AUG2016###########################
import networkx as nx ##### NetworkX is a Python language software package for the creation, manipulation, and study of the structure, dynamics, and functions of complex networks.
#from networkx.Graph import read_dot
import sys ############### Imports System Specific Parameters. Please go to the URL for more details https://docs.python.org/3.0/library/sys.html
from zabbix_api import ZabbixAPI
import math ############# Imports Math functions & Library
###### Comments By RK Date: 3AUG2016###########################
### matplotlib.pyplot is a collection of command style #
#functions that make matplotlib work like MATLAB. Each #
#pyplot function makes some change to a figure: e.g., #
#creates a figure, creates a plotting area in a figure, #
# plots some lines in a plotting area, decorates the #
#plot with labels, etc. In matplotlib.pyplot various #
# states are preserved across function calls, so that #
#it keeps track of things like the current figure and #
#plotting area, and the plotting functions are #
#directed to the current axes (please note that .axes. #
# here and in most places in the documentation refers #
# to the axes part of a figure and not the strict #
#mathematical term for more than one axis). #
#
#import matplotlib.pyplot as plt########################
###### Comments By RK Date: 3AUG2016#####################
#
from pylib.options import get_options #
from pylib.zabbix_utils import GraphCreator #
from pylib.zabbix_utils import ItemCreator #
from pylib.zabbix_utils import TriggerCreator #
from pylib.zabbix_utils import MapCreator #
from pylib.zabbix_utils import TemplateCreator #
import getpass #
import time #
import processmap as pm #
#
########################################################
###### Comments By RK Date: 3AUG2016#####################
######### Defining class for ZabbixMap with ############
#
class ZabbixMap: #
def __init__(self, config): #
self.config = config #
self.parse() #
#
def parse(self): #
pass #
########################################################
#dot_file=”main.dot”
#width = 800
#height = 600
#mapname = “TestOnramp”
###### Comments By RK Date: 3AUG2016#####################
######## Setting U Values for Elements ##################
#
ELEMENT_TYPE_HOST = 0 #
ELEMENT_TYPE_MAP = 1 #
ELEMENT_TYPE_TRIGGER = 2 #
ELEMENT_TYPE_HOSTGROUP = 3 #
ELEMENT_TYPE_IMAGE = 4 #
#
ADVANCED_LABELS = 1 #
LABEL_TYPE_LABEL = 0 #
#########################################################
#TODO: Available images should be read via the API instead
###### Comments By RK Date: 3AUG2016#####################
############ Defining Dictionary ########################
#Dictionary is collection of data PAIRS. In this case ###
#we are storing Imageds and it’s numbers as pairs under#
# a Dictionary named icons#############################
icons = { #
“router”: 23, #
“cloud”: 26, #
“desktop”: 27, #
“laptop”: 28, #
“server”: 29, #
“sat”: 30, #
“tux”: 31, #
“default”: 40, #
} #
#
#########################################################
###### Comments By RK Date: 3AUG2016#####################
######Below is the Dictionary named colors that will ####
#store Color and Color code as PAIRS#####################
#
colors = { #
“purple”: “FF00FF”, #
“green”: “00FF00”, #
“default”: “00FF00”, #
} #
#
#########################################################
if __name__ == “__main__”:
options, args = get_options()
print options
# Convert your dot file to a graph
dot_file = options.graphfile
G = nx.read_dot(dot_file)
height = int(G.graph[‘graph’][‘height_map’])
width = int(G.graph[‘graph’][‘width_map’])
mapname = G.graph[‘graph’][‘mapname’]
deletemap = “true”
addnode = “true”
addlink = “true”
addurl = “true”
addtrigger = “true”
if ‘deletemap’ in G.graph[‘graph’]:
deletemap = G.graph[‘graph’][‘deletemap’]
if ‘addnode’ in G.graph[‘graph’]:
addnode = G.graph[‘graph’][‘addnode’]
if ‘addurl’ in G.graph[‘graph’]:
addurl = G.graph[‘graph’][‘addurl’]
if ‘addlink’ in G.graph[‘graph’]:
addlink = G.graph[‘graph’][‘addlink’]
if ‘addtrigger’ in G.graph[‘graph’]:
addtrigger = G.graph[‘graph’][‘addtrigger’]
G = pm.process_map(options)
# Use an algorithm of your choice to layout the nodes in x and y
pos = nx.graphviz_layout(G)
#print “Hello Im here”;
#pos = nx.circular_layout(G)
# Find maximum coordinate values of the layout to scale it better to the desired output size
#TODO: The scaling could probably be solved within Graphviz
# The origin is different between Zabbix (top left) and Graphviz (bottom left)
# Join the temporary selementid necessary for links and the coordinates to the node data
poslist=list(pos.values())
maxpos=map(max, zip(*poslist))
for host, coordinates in pos.iteritems():
# pos[host] = [int(coordinates[0]*width/maxpos[0]*0.95-(((coordinates[0]*width)/maxpos[0])*0.01)), int((height-coordinates[1]*height/maxpos[1])*0.95+(((coordinates[1]*width)/maxpos[1])*0.01))]
print “ORIGNAL COORDINATES DATA X “+str(((coordinates[0]+maxpos[0])/(2*maxpos[0]))*width*0.95)+ “DATA Y :”+str(((coordinates[1]+maxpos[1])/(2*maxpos[1]))*height*0.95) + ” corr X ” + str(coordinates[0]) + ” maxpos[0] ” + str(maxpos[0]) + ” corr Y ” + str(coordinates[1]) + ” maxpos[1] ” + str(maxpos[1]) + ” width “+ str(width) + ” height ” + str(height)
X_cor = math.fabs(int((((coordinates[0]+maxpos[0])/(2*maxpos[0]))*width*0.95)))
Y_cor = math.fabs(int((((coordinates[1]+maxpos[1])/(2*maxpos[1]))*height*0.95)))
if X_cor <= 100:
X_cor = X_cor +100;
if Y_cor = (int(width)-100):
X_cor = X_cor – 100;
if Y_cor >= (int(height) – 100):
Y_cor = Y_cor -100;
pos[host] = [X_cor , Y_cor]
nx.set_node_attributes(G,’coordinates’,pos)
selementids = dict(enumerate(G.nodes_iter(), start=1))
selementids = dict((v,k) for k,v in selementids.iteritems())
nx.set_node_attributes(G,’selementid’,selementids)
link_params=[]
mp = MapCreator(options)
if deletemap != “false”:
print “map deletion”
mp.createEmptyMap(mapname,width,height)
nodenum = nx.get_node_attributes(G,’hostname’)
nodetype = nx.get_node_attributes(G,’elementype’)
# Prepare node information
for node, data in G.nodes_iter(data=True):
if “hostname” in data:
elementype=4
iconid_off=149
servicename=””
triggerDescription=””
hostname=data[‘hostname’]
x=data[‘coordinates’][0]
y=data[‘coordinates’][1]
if “elementype” in data:
elementype=int(data[‘elementype’])
if “iconid_off” in data:
iconid_off = int(data[‘iconid_off’])
if “servicename” in data:
servicename = data[‘servicename’]
if “triggerdescription” in data:
triggerDescription= data[‘triggerdescription’]
if “x” in data:
x = int(data[‘x’])
if “y” in data:
y = int(data[‘y’])
print “DATA X “+str(x)+ “DATA Y :”+str(y)+”HOSTNAME :”+str(hostname)+” elementype :”+str(elementype)+” iconid_off: “+str(iconid_off)+” servicename : “+str(servicename)+” triggerDescription: “+str(triggerDescription)
try:
print “1”
if addnode != “false”:
mp.AddSelementToMap(mapname,hostname,elementype,iconid_off,x,y,servicename,triggerDescription);
except Exception,e:
print “WARNING Selement BEING NOTADDED : “+”mp.AddSelementToMap(\””+str(mapname)+”\”,\””+str(hostname)+”\”,\””+str(elementype)+”\”,\””+str(iconid_off)+”\”,\””+str(x)+”\”,\””+str(y)+”\”,\””+str(servicename)+”\”,\””+str(triggerDescription)+”\”)”
print “Selement Exception is: “+str(e)
if “urls” in data:
s= data[“urls”]
if s:
urls = dict(item.split(“$”) for item in s.split(“,”))
for url in urls:
print “URL BEING ADDED :”+urls[url]
if url != “healthcheck”:
try:
print “1”
if addurl != “false”:
mp.AddURLToSelementInMap(mapname,hostname,elementype,url,1,urls[url])
except Exception,e:
print “WARNING URL BEING NOTADDED : “+”mp.AddURLToSelementInMap(\””+str(mapname)+”\”,\””+str(hostname)+”\”,\””+str(elementype)+”\”,\””+str(url)+”\”,\”1\”,\””+str(urls[url])+”\”)”
print “URL Exception is: “+str(e)
else:
try:
checkurl = “https://”+str(hostname)+”/”+urls[url]+”/healthcheck?detail&token=097eef45093f43402291447ea530f18a”
if addurl != “false”:
mp.AddURLToSelementInMap(mapname,hostname,elementype,url,0,checkurl)
except Exception,e:
print “WARNING URL BEING NOTADDED : “+”mp.AddURLToSelementInMap(\””+str(mapname)+”\”,\””+str(hostname)+”\”,\””+str(elementype)+”\”,\””+str(url)+”\”,\”0\”,\””+str(checkurl)+”\”)”
print “URL Exception is: “+str(e)
# Prepare edge information — Iterate through edges to create the Zabbix links,
# based on selementids
for nodea, nodeb, data in G.edges_iter(data=True):
print “NODE A :”+str(nodenum[nodea])+ ” TYPE A: “+str(nodetype[nodea])+” NODE B: “+str(nodenum[nodeb])+” TYPE B: “+str(nodetype[nodeb])+” DATA :”+str(data)
label=str(nodenum[nodea])+”—“+str(nodenum[nodeb])
if “label” in data:
label = data[‘label’]
try:
print “1”
if addlink != “false”:
mp.AddLinkToMap(mapname,nodenum[nodea],nodenum[nodeb],label,”,2,int(nodetype[nodea]),int(nodetype[nodeb]))
except Exception,e:
print “WARNING Link BEING NOTADDED : “+”mp.AddLinkToMap(“+str(mapname)+”\”,\””+str(nodenum[nodea])+”\”,\””+str(nodenum[nodeb])+”\”,\””+str(label)+”\”,\””+str(”)+”,2,”+str(int(nodetype[nodea]))+”\”,\””+str(int(nodetype[nodeb]))+”\”)”
print “Link Exception is: “+str(e)
if “triggerdescription” in data:
t= data[‘triggerdescription’]
if t:
triggers= list(item for item in t.split(“,”))
for trigger in triggers:
t = trigger.split(“$”)
print “Trigger BEING ADDED :”+str(t[2]) +” WiTH HOST “+str(t[0])+” WITH HOSTGROUP: “+str(t[1])
try:
print t
servicename = str(str(t[2]).split(“_”)[0])
if addtrigger != “false”:
mp.AddTriggerToLink(mapname,nodenum[nodea],nodenum[nodeb],int(nodetype[nodea]),int(nodetype[nodeb]),t[0],int(t[1]),”WPP: CPG: TRIGGER: “+t[2])
mp.AddTriggerToLink(mapname,nodenum[nodea],nodenum[nodeb],int(nodetype[nodea]),int(nodetype[nodeb]),t[0],int(t[1]),”WPP: CPG: TRIGGER: “+t[2]+”_nodata”,’00EEEE’)
except Exception,e:
print “WARNING TRIGGER BEING NOTADDED : “+”mp.AddTriggerToLink(\””+str(mapname)+”\”,\””+str(nodenum[nodea])+”\”,\””+str(nodenum[nodeb])+”\”,\””+str(int(nodetype[nodea]))+”\”,\””+str(int(nodetype[nodeb]))+”\”,\””+str(t[0])+”\”,\””+str(int(t[1]))+”\”,\””+”WPP: CPG: TRIGGER: “+str(t[2])+”\”)”
print “WARNING TRIGGER BEING NOTADDED : “+”mp.AddTriggerToLink(\””+str(mapname)+”\”,\””+str(nodenum[nodea])+”\”,\””+str(nodenum[nodeb])+”\”,\””+str(int(nodetype[nodea]))+”\”,\””+str(int(nodetype[nodeb]))+”\”,\””+str(t[0])+”\”,\””+str(int(t[1]))+”\”,\””+”WPP: CPG: TRIGGER: “+str(t[2])+”_nodata”+”\”,\”00EEEE\”)”
print “Trigger Exception is: “+str(e)
print “CHECK 1: Hello Im here”;
sys.stderr.write(str(e)+”\n”)
try:
if addtrigger != “false”:
mp.AddTriggerToLink(mapname,nodenum[nodea],nodenum[nodeb],int(nodetype[nodea]),int(nodetype[nodeb]),t[0],int(t[1]),”WPP: CPG: TRIGGER: healthcheckdatacollection_”+servicename,’0000DD’)
except Exception,e:
print “WARNING TRIGGER BEING NOTADDED : “+”mp.AddTriggerToLink(\””+str(mapname)+”\”,\””+str(nodenum[nodea])+”\”,\””+str(nodenum[nodeb])+”\”,\””+str(int(nodetype[nodea]))+”\”,\””+str(int(nodetype[nodeb]))+”\”,\””+str(t[0])+”\”,\””+str(int(t[1]))+”\”,\””+”WPP: CPG: TRIGGER: healthcheckdatacollection”+”\”,\”0000DD\”)”
print “Trigger Exception is: “+str(e)
print “CHECK 2: Hello Im here”;
sys.stderr.write(str(e)+”\n”)
#nx.draw(G)
#plt.show()
I’m getting error when adding links to elements and the error is
Trigger Exception is: list indices must be integers, not str
Not sure what is wrong 🙁
I’m sorry, but that’s pretty far away from the code I wrote.
Hi Volter,
I think i have a similar requirement and an existing Zabbix installation along with a separate CMDB of configuration items.
Would you say that the above scenario is still the Zabbix position, or are new tools available to easily derive Maps from Zabbix.
Thanks
Stuart
Dear Stuart!
I haven’t heard of any development in this area. That’s to say, there is still no mechanism to support dynamic data sources or to automatically create anything but the most trivial maps from within Zabbix.
https://github.com/jasonmcintosh/zabbix-map-creation
The content of the above repo is based on my original script and has a few improvements. It shouldn’t be too difficult to meet your goals with the data from your CMDB. Good luck! Feel free to contact me on Freenode IRC if you need help.
Hi volter,
I am fairly new to zabbix and programming and have been researching on ways to create a zabbix map automatically when a new host is added to zabbix server. But unfortunately haven’t found any solutions yet. As far as i can understand the dot file of your needs to be updated manually before running the python script. I was wondering if there was any other way using the discovery rules, script and cronjob to automatically create a map (just a thought). Any help is much appreciated. Thanks
Hello!
This article actually has examples for two datasources, a dot file (could be generated or maintained manually) and that Cisco prime dump.
There is no general or built-in method to gather that information for you and it’s probably not trivial, depending on how different environments can be. If you want to discuss this further, I recommend joining the IRC channel #zabbix on freenode. My name there is volter.