 In the past, quite often Zabbix users have been puzzled regarding some server tuning parameters – for example, how many pollers do they need? It was usually determined based on experience, testing and a bit of guesstimating. No more fuzzy attempts – get hard facts with Zabbix 1.8.5.
UPDATED 2011.11.02: new downloadable template version v2
UPDATED 2012.05.08: new downloadable template version v3 (for Zabbix 2.0.0rc3)
In Zabbix 1.8.5 a new feature has been financed by nice guys and gals from some Austrian company. And it seems to have turned out pretty well technically.
How many pollers should I have?
The usual problem is determining what to do regarding the amount of various Zabbix processes for whom the amount is configurable. For example, by default Zabbix server starts 5 pollers (as specified by StartPollers directive in the server configuration file), which is enough for small installations – but what to do when monitoring 100 hosts? 1000? 10 000? And then there’s the case of different environments requiring different amounts depending on what protocols are used for monitoring, performance of the monitored devices, network and lots of other things.
And in most cases that’s not the only thing to be concerned about – amount of all kinds of other processes is also configurable – for example, trappers that handle incoming connections, specific types of pollers, like the HTTP ones – used for running web monitoring scenarios and so on.
New internal items to the rescue
With such amount of unknowns the new feature comes really handy – and that feature is new internal items. As all internal items, their key is simply zabbix. To cite the Zabbix manual, full key and its parameter syntax is
- zabbix[process,<type>,<mode>,<state>]
– so we can see that first parameter is keyword process. Let’s take a look at other parameters.
Available states
Let’s start to look at the key parameters from the end. The first we’ll discuss – state. Currently there are only two supported states:
- busy
- idle
Simple, isn’t it? So we can monitor how much time (in percents) something was busy or idle. Here, “busy” means doing anything but waiting – so that might be connecting to some device over the network, looking up what items to check or anything else. There is no functionality at this time to distinguish between these activities – maybe that will appear at a later time.
Available modes
It is possible to monitor several different things, controlled by mode parameter.
Monitoring all processes of a specific type
Probably the most common use case will be to monitor all processes of a specific type (like all pollers or trappers). In that case, mode can be one of:
- avg – average value for all processes of a specific type. This is the default
- max – maximum value out of those processes
- min – minimum value out of those processes
So having 5 poller processes be busy (that is, doing anything more or less useful) each for 5, 10, 15, 20 and 25 percent of the time would yield 5 for min mode, 25 for max mode and 15 for avg mode.
Data is computed for last minute only, so to have reasonably correct values you should set item update interval to 60 seconds.
Monitoring a specific process
It is also possible to monitor individual processes. In that case, mode is process number. This number is sequentially number of the process as it was started – so if we have 5 poller processes, process numbers will be from 1 till 5. To monitor all of them individually, one would create 5 individual items.
The benefit would be much more detailed view on the state of things. For example, if one the pollers would hang for some reason and be in a 100% busy state while other 4 would be completely idle, average over all of them would show 20% busy – which we could consider as being completely normal. On the other hand, seeing one process completely busy while others not doing anything would surely make us investigate the situation. Of course, that would mean notably more configuration and slightly more data being collected.
Monitoring amount of processes
And the last mode that we have at our disposal – count. This simply gives us the amount of processes of a specific type. Of course, in this case we do not specify state at all – amount of processes can not be busy or idle.
Available process types
With state and mode cleared out we can look at the remaining parameter – type.
This parameter specifies process type to monitor. Zabbix server has quite a lot different process types – actually, in 1.8.5 there will be 17 in total. These processes are responsible for all kinds of different things, and if you have looked at Zabbix server logfile right after the server was started, you probably observed lines like these:
server #11 started [Trapper]
server #12 started [Trapper]
server #13 started [ICMP pinger]
server #0 started [Watchdog]
server #14 started [Alerter]
server #15 started [Housekeeper]
Starting with 1.8.5, process names are slightly improved and printed in lowercase.
Those are all kinds of Zabbix processes, and how busy they are – that’s exactly what these new internal items allow to monitor. Starting with 1.8.5, following process types are available for monitoring:
- alerter – this process is responsible for sending all kinds of notifications
- configuration syncer – this process manages cache of configuration data
- db watchdog periodically checks whether the database is still available and sends a message if not
- discoverer runs around the network to find any changes there
- escalator proceeds with, well, escalations
- history syncer writes gathered data to the database
- http poller processes web monitoring scenarios
- housekeeper periodically removes old historical data
- icmp pinger handles icmpping and icmppingpersec items
- ipmi poller handles IPMI items
- node watcher handles data sending in distributed setup
- self-monitoring is the one processing these internal checks we talk about here
- poller is probably the most popular process – it gathers data from passive Zabbix agents and SNMP devices
- proxy poller communicates with passive Zabbix proxies
- timer is a process for evaluation of time-related trigger functions and host maintenances
- trapper deals with all kinds of incoming connections, including active agents, zabbix_sender and active Zabbix proxies
- unreachable poller does the same poller does – but only for devices that are considered as being unreachable (and additionally IPMI devices as well)
So any of the above can be used as type in the key parameters here.
Looking at the process types we can figure out that knowing how busy they are will help us to figure out how well they are doing, have better understanding where the bottlenecks might be and configure the amount of some processes. But additionally gathered information can also help with debugging all kinds of other problems – we will be able to see how much time other internal processes like alerter or escalator spend doing their job.
See it in action
With all the theoretical information we might lose sight of our goal – getting the information. Let’s get to the real configuration.
Item details
To configure such items on your existing installation (but only in Zabbix 1.8.5 or later), decide – as usual – on layout. You can create them directly on the Zabbix server host or use a proper template. Things that are important for these items:
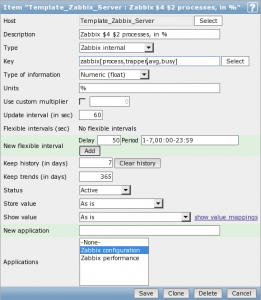
- Type must be set to Zabbix internal
- Key, of course, must be properly constructed
- Type of information will depend on mode. If mode will be count, type of information must be Numeric (unsigned). In all other cases it must be Numeric (float), because percentage with two digits after the decimal sign is returned
- Units could be set to % except if mode is count
- Update interval should be 60 seconds, because available data is about the last minute
As for the key, some examples:
- zabbix[process,unreachable poller,avg,busy] – how much time on average all unreachable pollers were busy. High values might indicate significant amounts of monitored devices not responding properly. Consider not monitoring removed devices and increasing the amount of unreachable pollers
- zabbix[process,trapper,min,busy] – minimum busy rate for trapper processes. High values might indicate lots of incoming connections from active agents, Zabbix proxies or other processes. Consider increasing the amount of running trappers
You can find more examples in the Zabbix manual.
Example item configuration might look like this. Note the usage of positional variables in item description to reference key parameters.
All screenshots in this post are from Zabbix trunk (development version). While there are minor differences, they do not concern the functionality we are looking at.Data coming in
OK, that’s what can be monitored – but what should be monitored? In general, whatever you need. People who have experienced uncertainty about the amount of, for example, pollers they should be running, would know that already. But even if you are not looking at a problem to solve right now, generic suggestion would be to monitor average busy percentage of time if not for all of the processes, then at least for the major ones like pollers, ICMP pingers, trappers etc. Given that there are 17 of these items, it wouldn’t be really feasible to check their trending over time individually. Using a single graph also would be fairly unreadable, so the suggested approach would be to split these items in two custom graphs. Here are two graphs, showing items being separated in two categories.
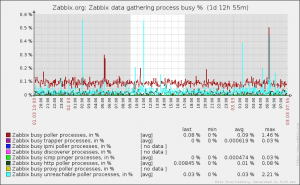
Data gathering processes
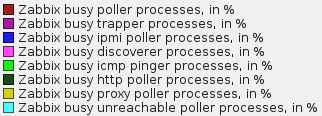
Data gathering processes mostly include processes that one way or another mostly are concerned with retrieving values. Here, 8 out of 17 process statuses have been added. We can see that over one and a half day period busy percentage is fairly even with some peaks mostly in unreachable pollers, and a few in pollers as well. Of course, if we pay attention to the y axis scale, we’ll quickly figure out that it’s just a few percent of the time. Some of the processes report that they have no data, though. Why could that be? If we look at these items in the configuration list view, we might find out the answer to that.
Thus we can see that monitoring processes that have not been started isn’t very useful – and also that a very nice problem reporting has been implemented as well. Such items will turn into unsupported state, but they should be disabled as already done in the screenshot above.
Internal processes
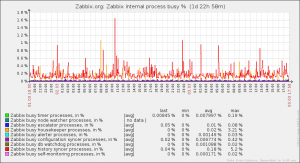
Internal processes are… well, all the other ones which are not directly gathering data. Escalator, housekeeper, various cache management processes and so on, including the process which deals with these internal items, 9 in total.
In the graph we can see that mostly the process which synchronises gathered data to the database (history syncer) is busy, with a few minor spikes by the housekeeper. They seem even less significant if we pay attention to the y axis scale again – just a few percent at most.
Individual processes
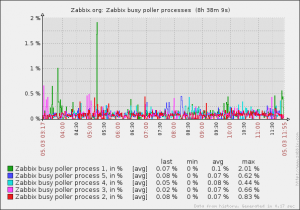
We also discussed possibility to monitor the busy state of individual processes. For that, mode would have to be set to sequential process number. In the case of default 5 pollers, we would have to create 5 items with mode going from 1 till 5. Then, if we would put them all on a single graph, it would look like this:
Graph reveals that no pollers have been stuck over this period and all of them have done small bits and pieces every now and then. While the very first poller process jumped up in the graph a couple of times, it was still just a few percent of the time spent working.
Readymade template
Download template here
UPDATE:
There were reports that people fail to spot/find template download here, so hopefully it will be better visible now. Template version v2 added the following:
- A graph with all cache items (as suggested by Zalex)
- Triggers for all internal process busy rate items
Template version v3 adds
- Item for new values per second
- Item for queue over 10 minutes
- Both of these items to the Zabbix performance graph
- More item and trigger descriptions
Zabbix server template v2 download (for 1.8)
Zabbix server template v3 download (for 2.0.0rc3)
/UPDATE
These items are so cool that next version of the Zabbix virtual appliance, 1.8.5, will ship with all of these items and also two graphs for them. If you don’t feel like configuring it all by yourself, here’s an XML of a template that should be applied to Zabbix server (but again, only if running 1.8.5 or later version Zabbix server). It could be extended by adding triggers, maybe even more items and graphs – but it should be at least a good starting point. Note that it contains also other internal items (total amount of items being 26).
Future improvements
This feature is really nice – but there’s usually bits and pieces that could be still improved. Two potential improvements have been considered:
- more detailed process activity information – but overloading and fracturing the information might result in unusable data
- low level discovery of processes for Zabbix 2.0 would allow to monitor all processes of a certain type individually, no matter how many are there. Individual items would be created by the low level discovery.
Now let’s enjoy this added insight into the inner workings of the Zabbix server.
h3



 Prev Post




Splendid! 🙂 The similar have been implemented using “pstree” cmd command and using several awks and greps to get active/idle zabbix_agentd processes.
How to improove node watcher? Utilization is always at 100%on my servers [distributed monitoring]
sorry for the late reply, but it’s better to discuss such issues on zabbix forums
Great info. A quick import of the template shows my busy pollers and busy unreachable pollers both consistently above 75%. Now I know where I need to focus my performance efforts.
Thanks for the template but,
If I import the v2 template on my v.1.8.5 the import utility tell me that the xml is not correct on line 2.
Which are the differences between the V2 and V1?
Thanks!
hmm. what’s the actual error message ? line 2 is just zabbix_export tag…
oh, regarding changes in v2 – they are listed just above the download link 😉
A graph with all cache items (as suggested by Zalex)
Triggers for all internal process busy rate items
Thank you very much for the template!
Especially the graphs are very useful for me and save a lot of manual setup…
Great!
Great tool! Is there a way to monitor performance levels of proxies also?
nope, that’s not possible yet
Thanks for the template!
My zabbix server 1.8.2 tell me that some items are not supported, but I’m debugging this problem.
Thanks!
hi
How can i Monitor the proxy pollers business percentage like ZABBIX server pollers?
Thanks
see the comment above on march 3rd and a response saying that it’s currently not supported 😉
btw, that’s feature request https://support.zabbix.com/browse/ZBXNEXT-1098
Also I voted the request 😉