


In part one of this blog post, I will show you how to monitor Podman pods using HTTP agent item to retrieve data from the Prometheus Podman exporter. Let’s get started!
Table of Contents
Installing and checking Prometheus Podman exporter
First, you will need to install and enable the Prometheus Podman exporter (my OS is CentOS Stream release 9). Then, check that the service is active and running.
# dnf install -y prometheus-podman-exporter

# systemctl enable prometheus-podman-exporter --now

# systemctl status prometheus-podman-exporter
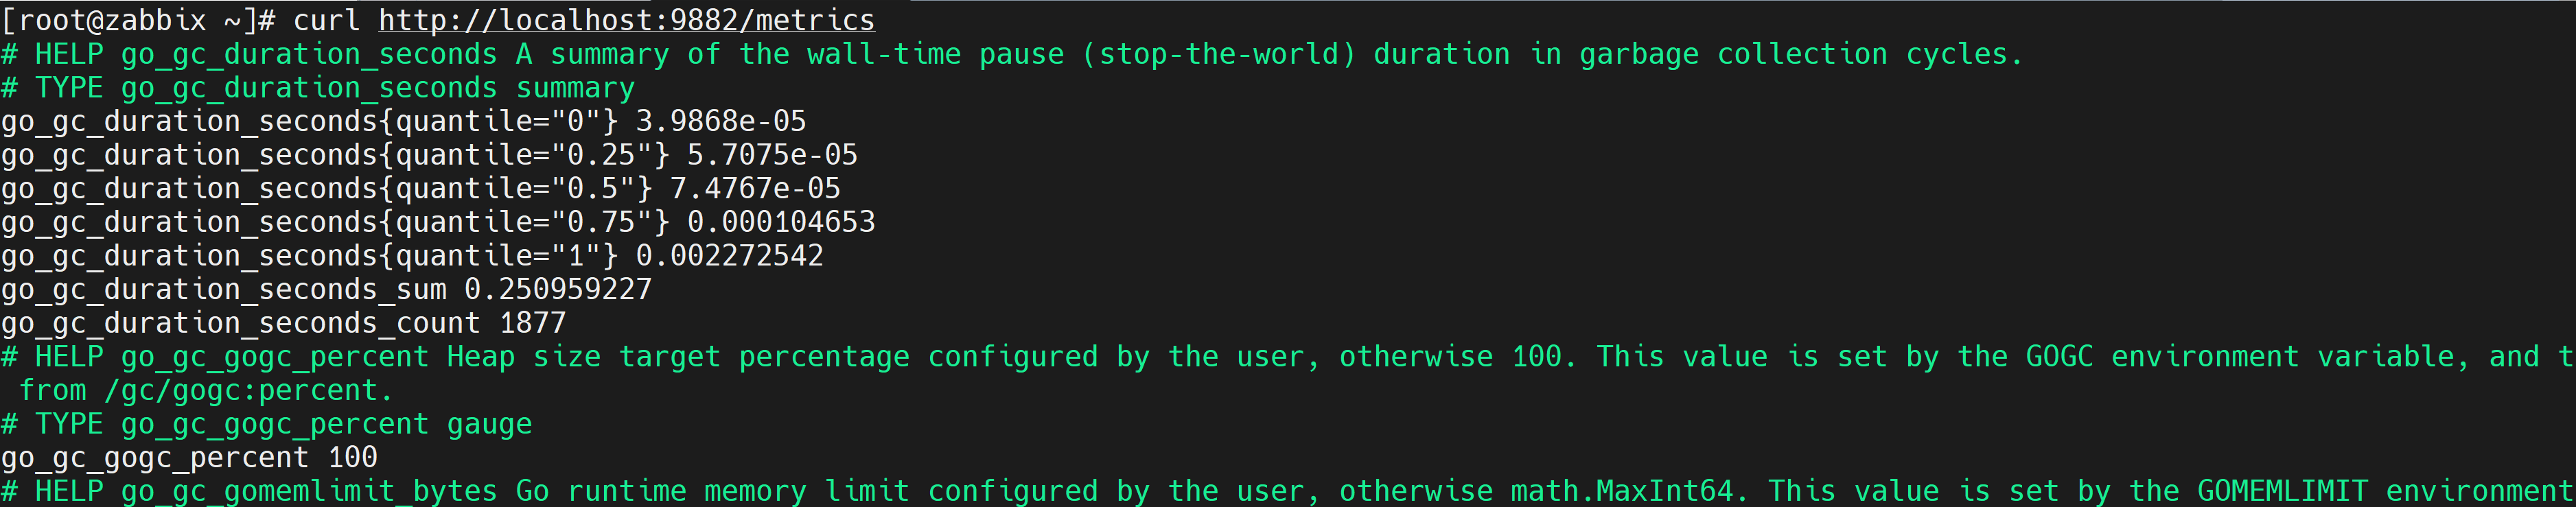
You can check that you are getting the data from the exporter with either the curl command from the machine/VM where the Prometheus podman exporter is installed and started:
# curl http://localhost:9882/metrics
Or through the browser (replace abc with the machine’s IP/DNS ): abc:9882/metrics.
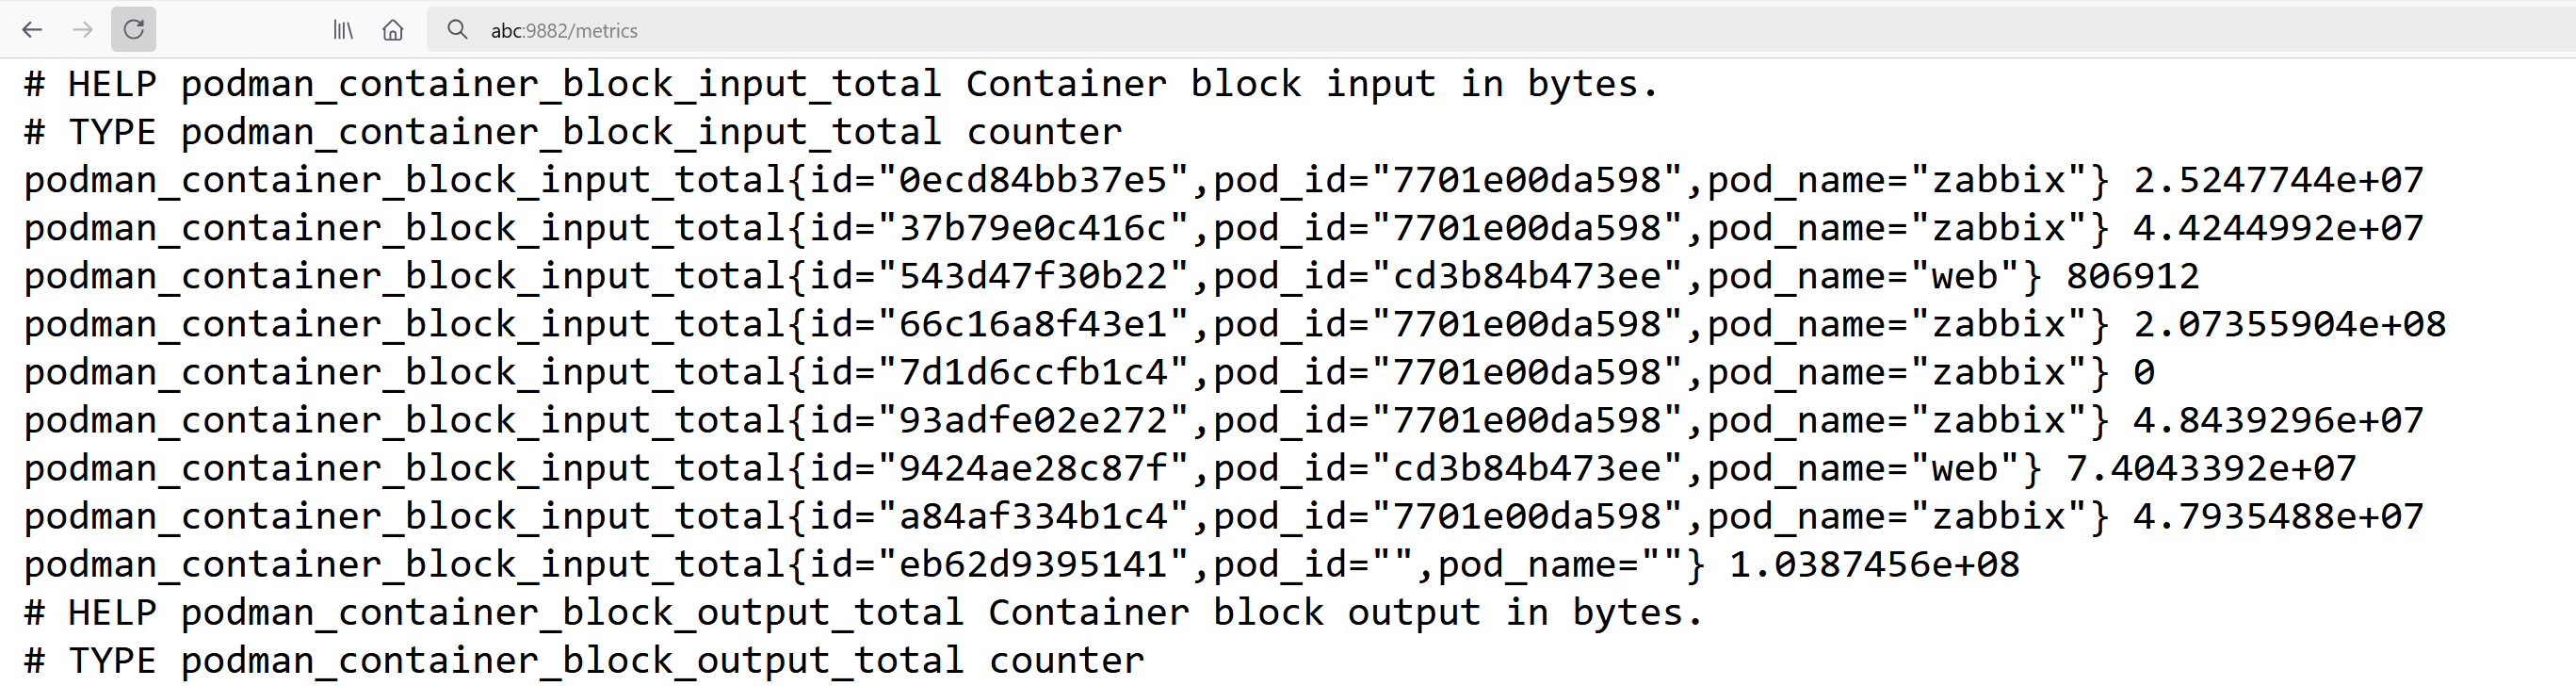
A line starting with # is a comment and contains an explanation regarding the metric; in this case, podman_container_block_input_total will return data in bytes. In Figure 2, after the comments, you can see several podman_container_block_input_total metrics, one for each container, with different container IDs, pod IDs, and pod names listed in each metric. The metric’s value is displayed on the right side after curly brackets.
Creating a template and template items
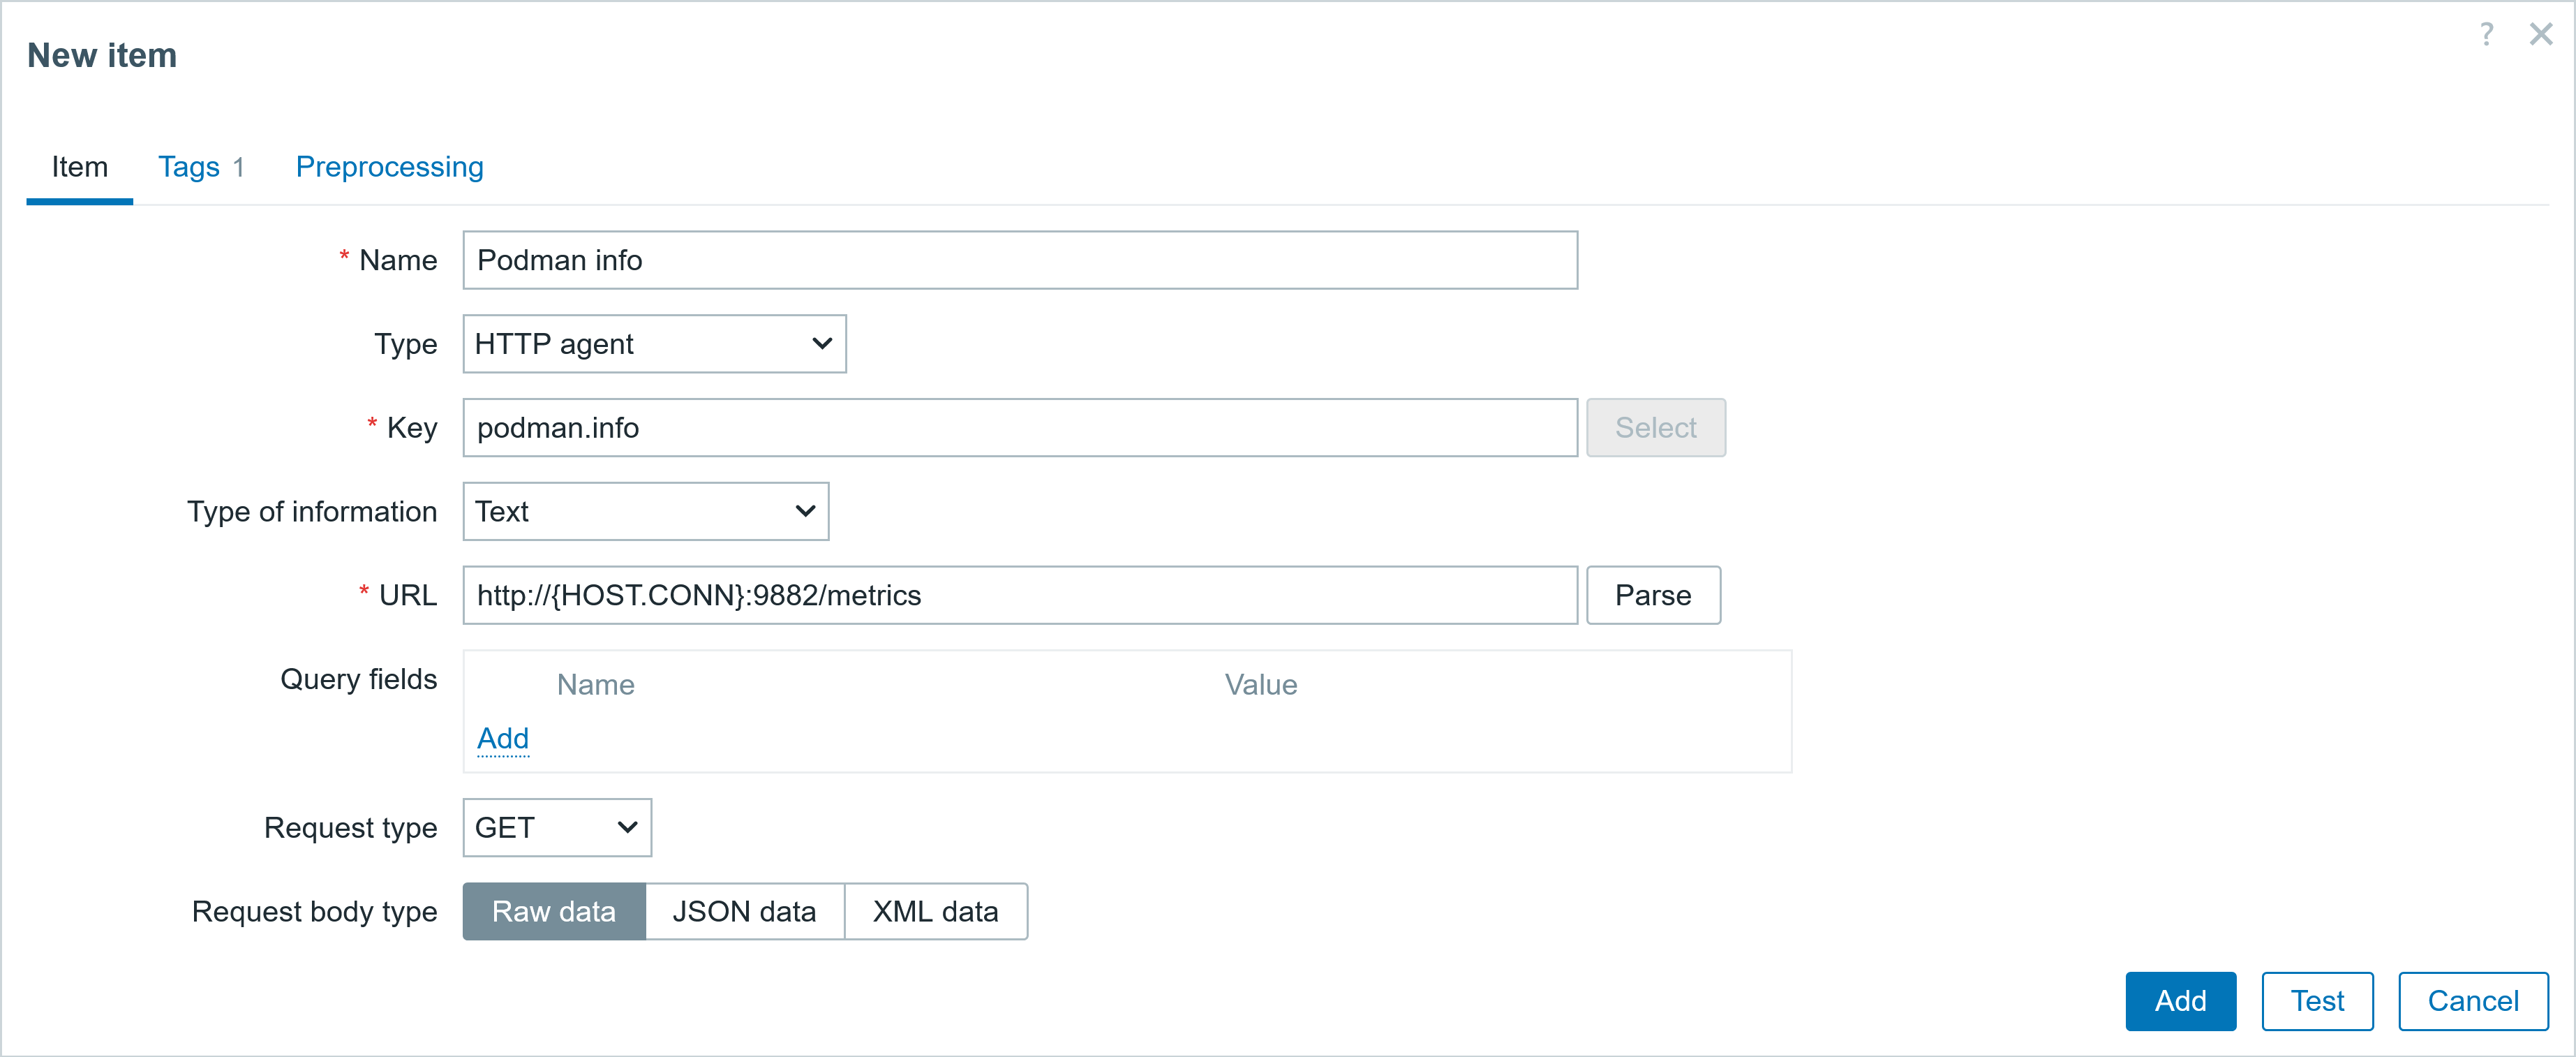
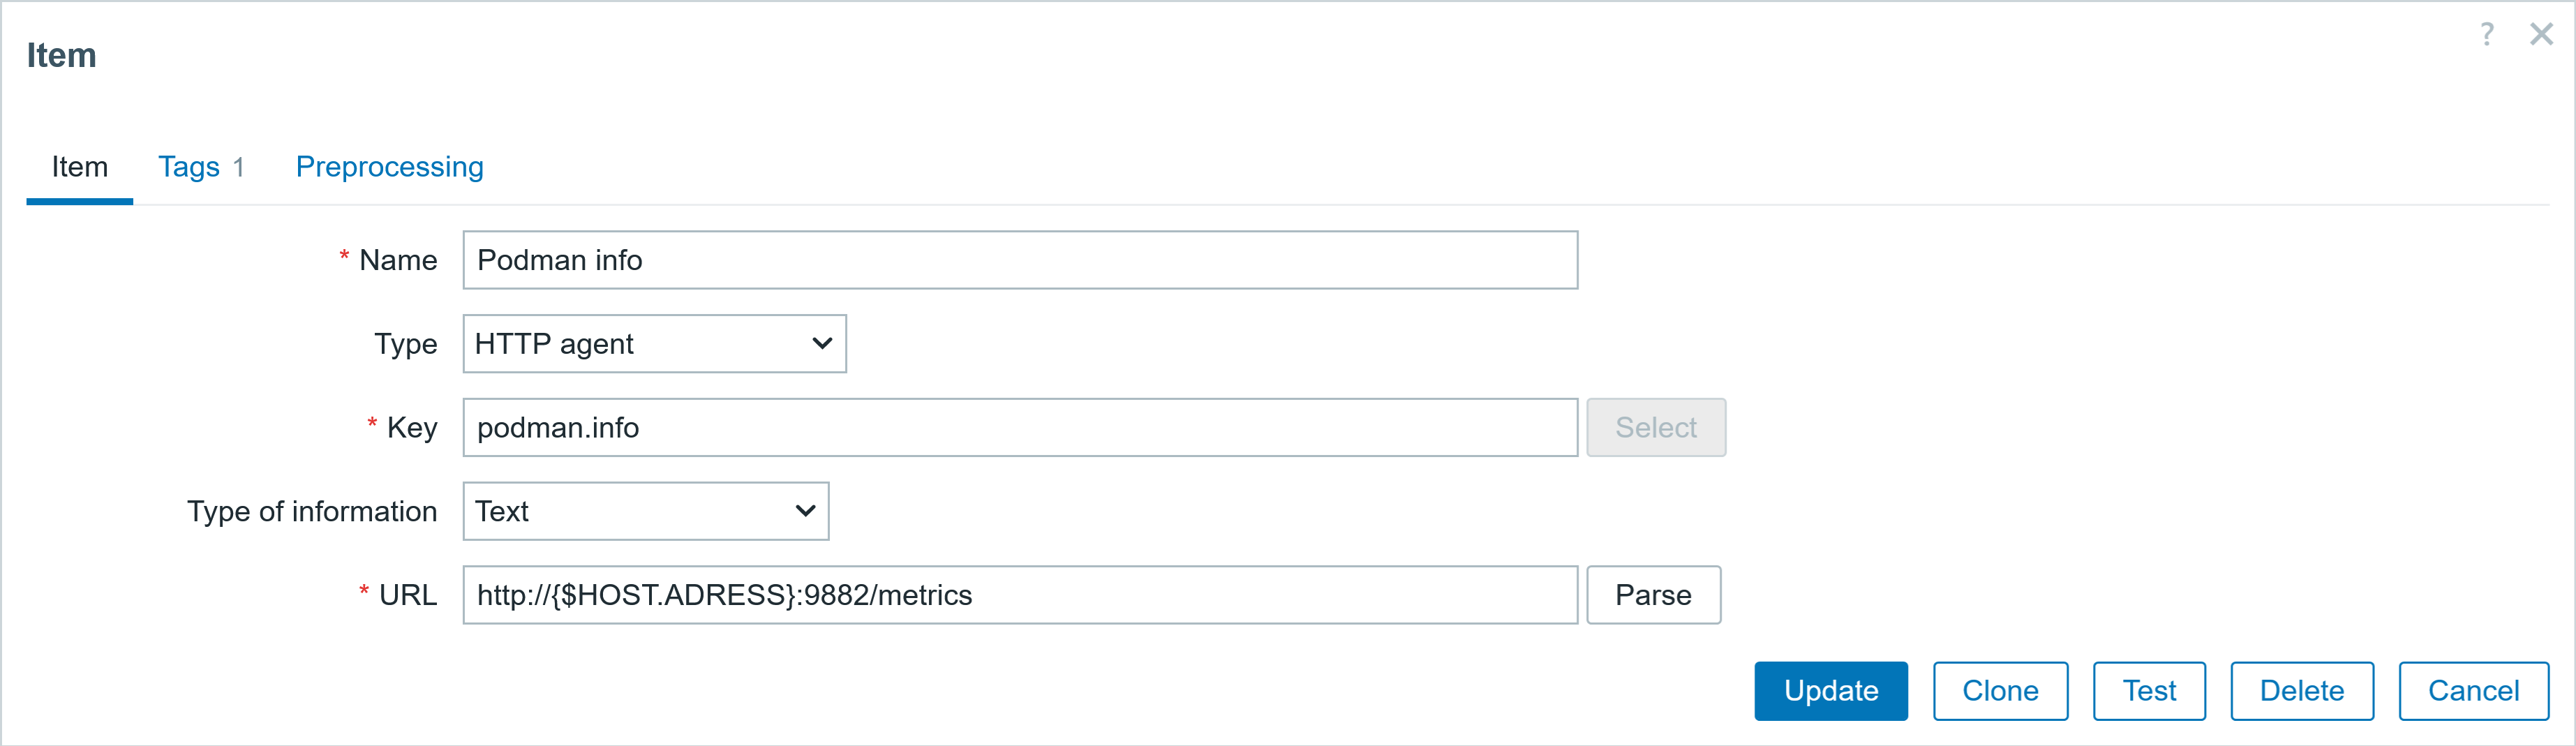
Next, I will create a template Podman containers by HTTP and Prometheus where I will put all of the entities (everything will be created on the template). In the template, I will create an item Podman info, which will gather all of the necessary data at defined intervals. This approach will be convenient from a data collection standpoint as the same item data will be used for LLD and item prototypes. During testing, you can set “History” to store data for some time, and when everything is working as expected, then set “History” not to keep any data. This item will be used for the Low-Level Discovery rule and the item prototype.
The item Podman info parameters are as follows:
Template: Podman containers by HTTP and Prometheus

○ Item
  ▪ Name:         Podman info
  ▪ Type          HTTP agent
  ▪ Key:          podman.info
  ▪ Type of inf   text
  ▪ URL           http://{HOST.CONN}:9882/metrics
  ▪ Request type  GET
  ▪ Update int.   5m
  ▪ Req status c. 200
  ▪ History       Do not store
◊ Tags
  ▪ Podman:raw
At this moment, this item will contain just raw data, without any preprocessing steps applied. The IP address will be taken from any host interface added to the host. You will get an error message if the host has no interface.

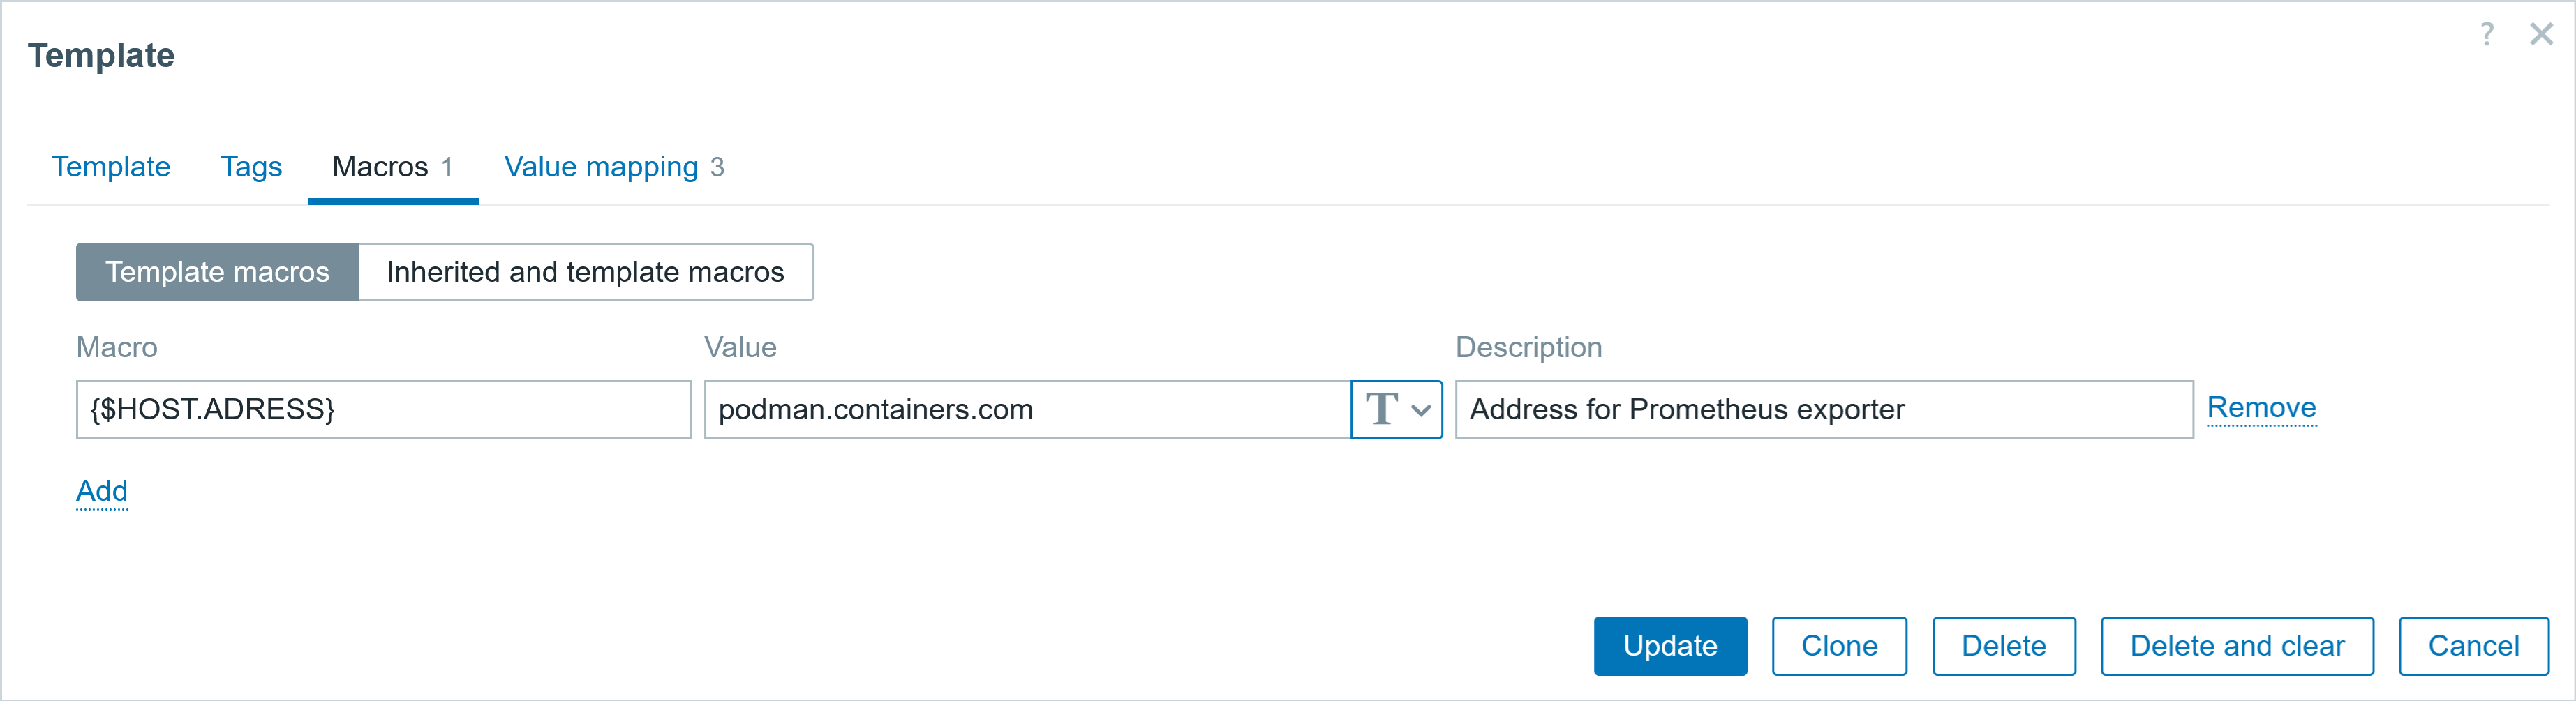
If you do not want to add an interface to the host, you can define a user macro on the template level and use that user macro in the items URL. After adding the template to the host, just modify the user macro value on the host to correct IP/DNS name.
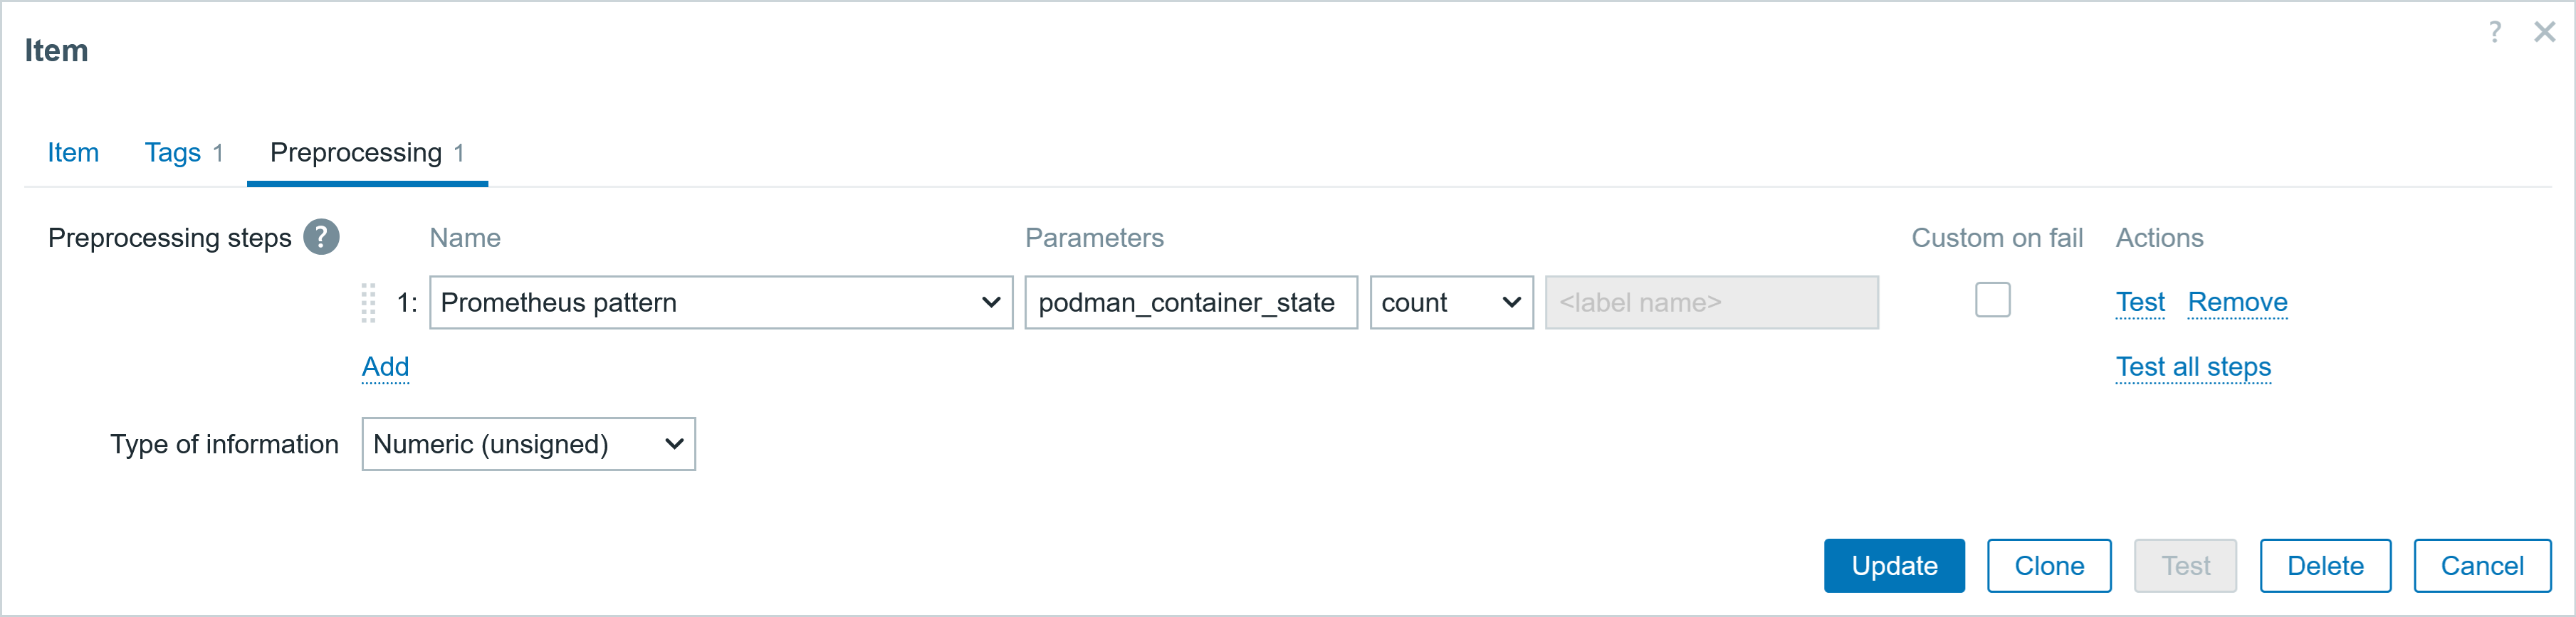
I can also create an item to determine the number of containers created. I can count specific Prometheus pattern occurrences in the master item to determine this. For this, I will use the podman_container_state parameter. Likewise, I could use different parameters, such as podman_container_info, and count the occurrences of such a pattern. The parameters of the item container count:
Template: Podman containers by HTTP and Prometheus

○ Item
  ▪ Name:         Container count
  ▪ Type          Dependent item
  ▪ Key:          container.count
  ▪ Type of inf   Numeric (unsigned)
  ▪ Master item   Podman containers by HTTP and Prometheus: Podman info
◊ Tags
  ▪ Containers:total
♯ Preprocessing
  ▪ Prometheus pattern     podman_container_state     count
Creating a Discovery rule in template
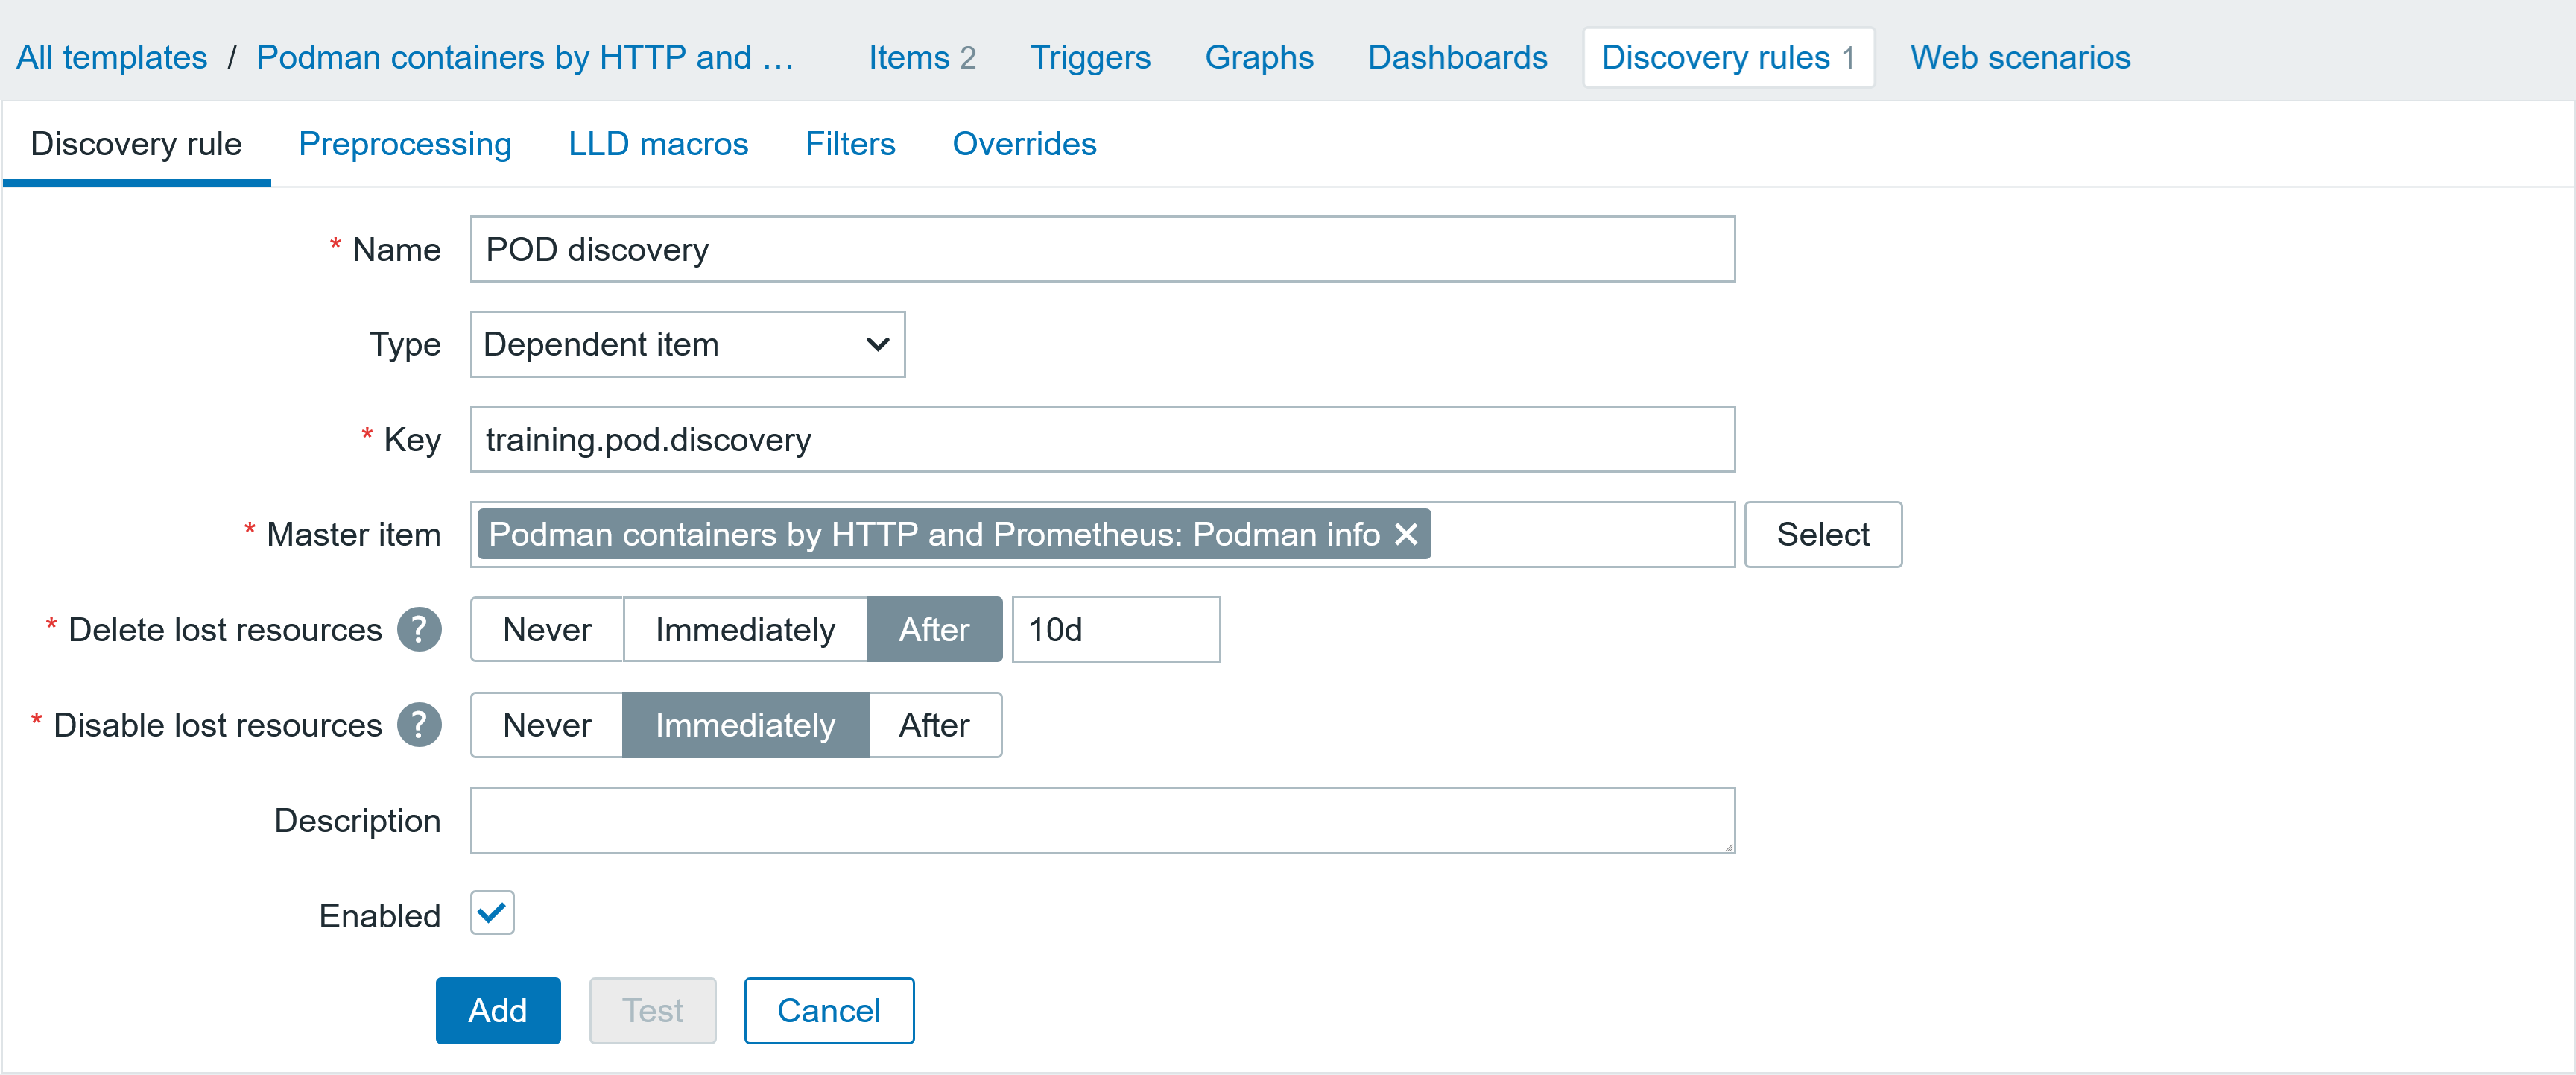
Next, the LLD rule will be created to discover Podman pods. It will be a dependent LLD rule based on a Podman info item with a preprocessing step to convert the Prometheus pattern data to JSON format. The caveat is that the LLD discovery will be executed as frequently as the data is received for the item. If there are a lot of hosts with such a template, there will be a lot of LLD processes executed, which can put a strain on your Zabbix instance.
To rectify this issue, I will add a preprocessing step: discard unchanged with heartbeat (as there are no dynamic parameters in the extracted pattern, otherwise we would need to filter out dynamically changing information). For LLD discovery, the recommended interval is around 1h. Additionally, LLD macros will be created from selected JSNOPath variables. The parameters of the LLD rule are shown below.
Template: Podman containers by HTTP and Prometheus
▲ Discovery rule
▪ Name: POD discovery
▪ Type Dependent item
▪ Key: training.pod.discovery
▪ Master item Podman containers by HTTP and Prometheus: Podman info
▪ Delete lost resources After 10d
▪ Disable lost resources Immediately
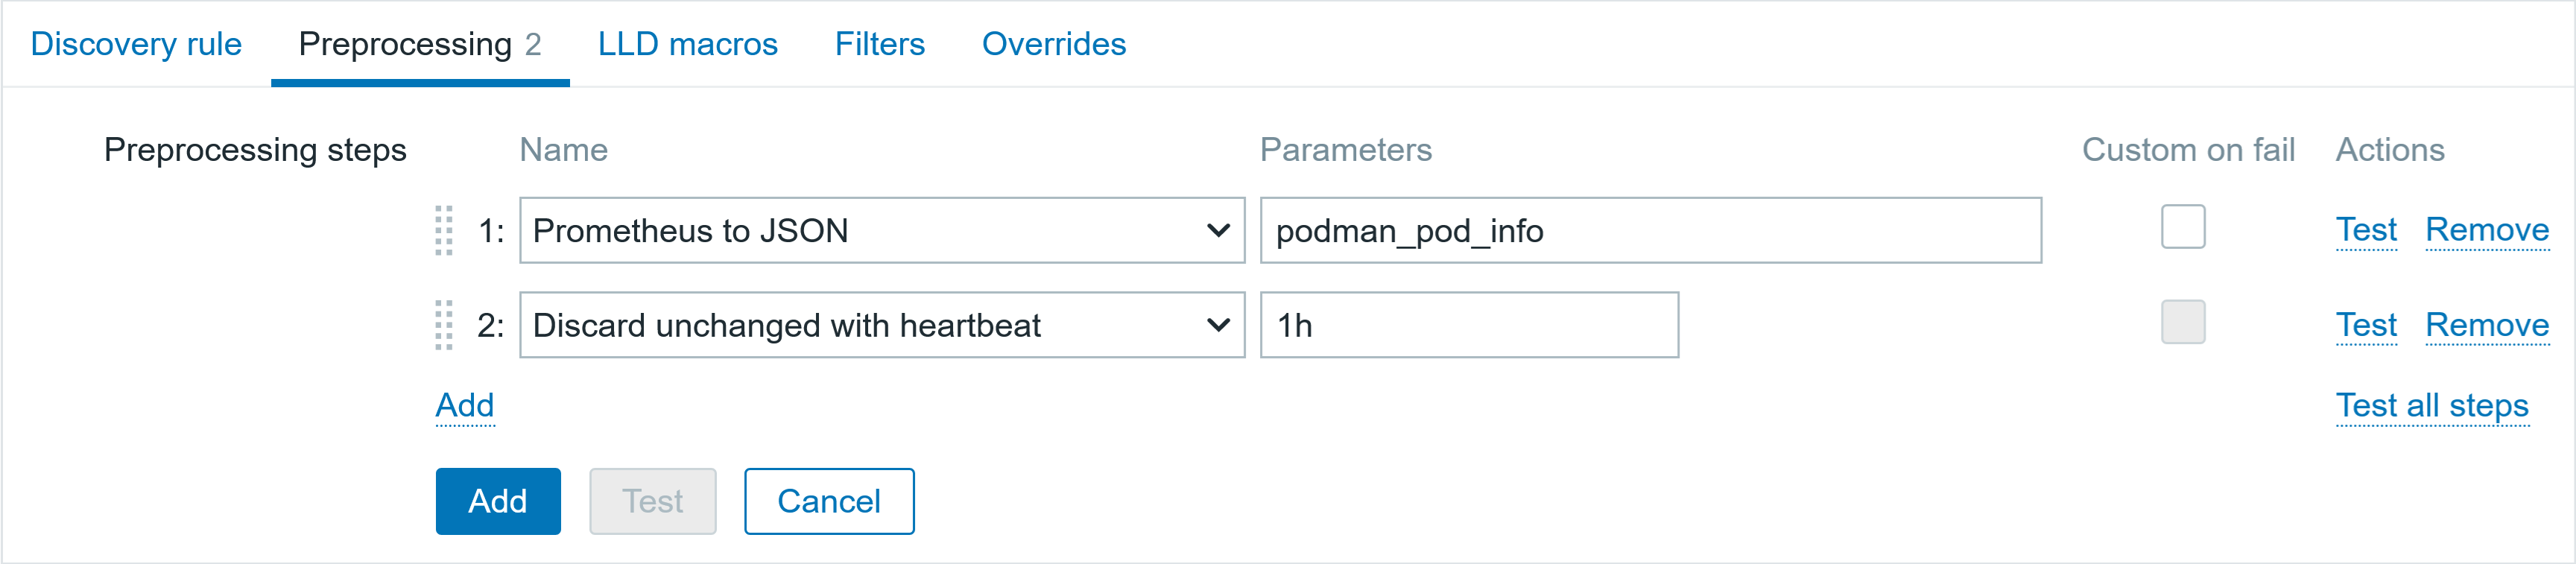
♯ Preprocessing
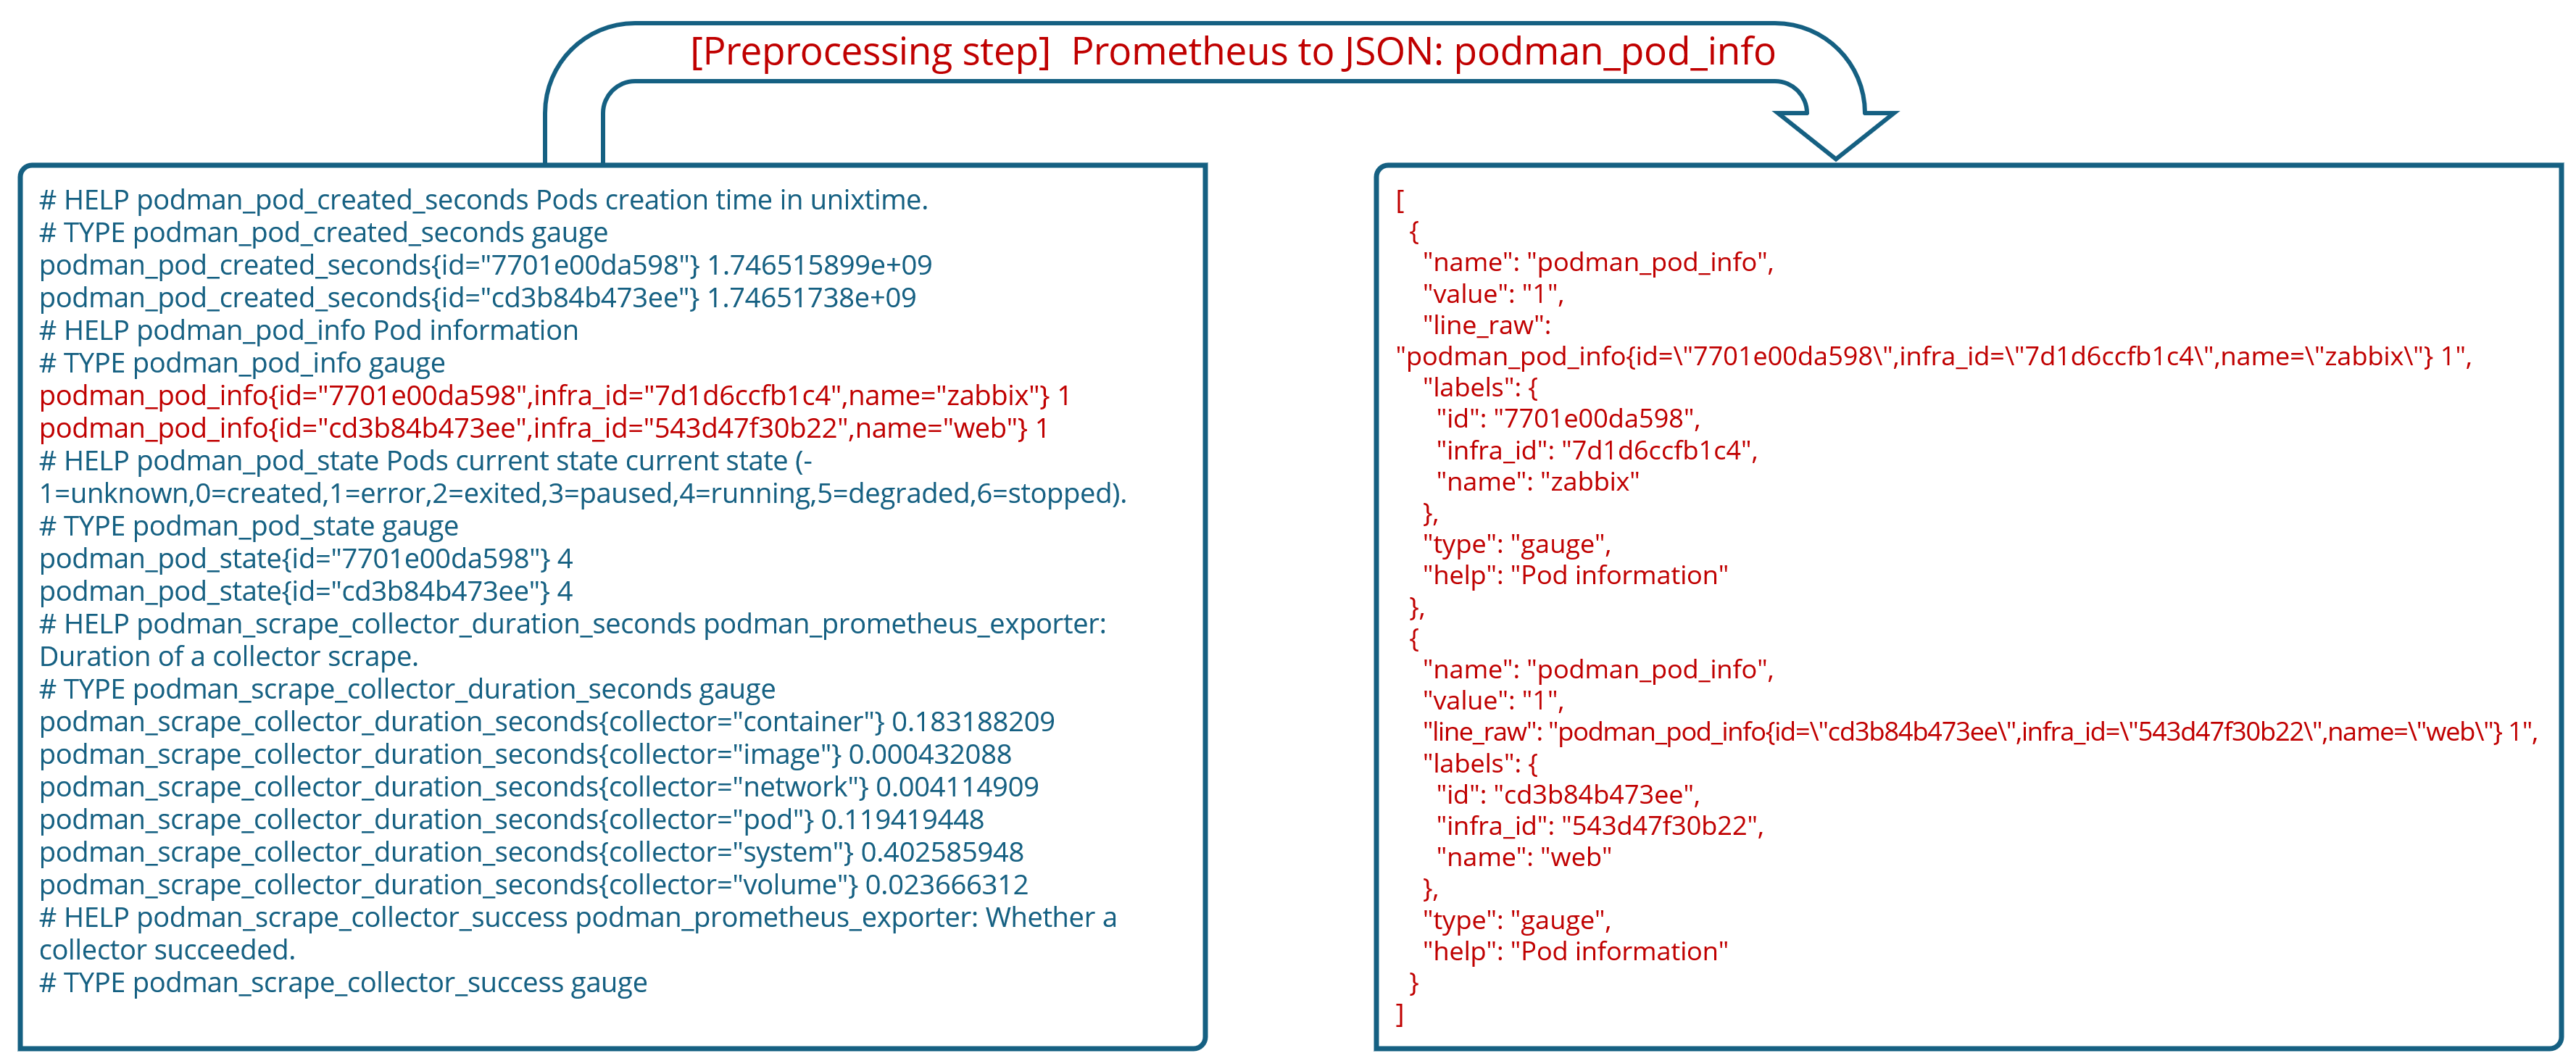
▪ Prometheus to JSON podman_pod_info
▪ Discard unchanged with heartbeat 1h
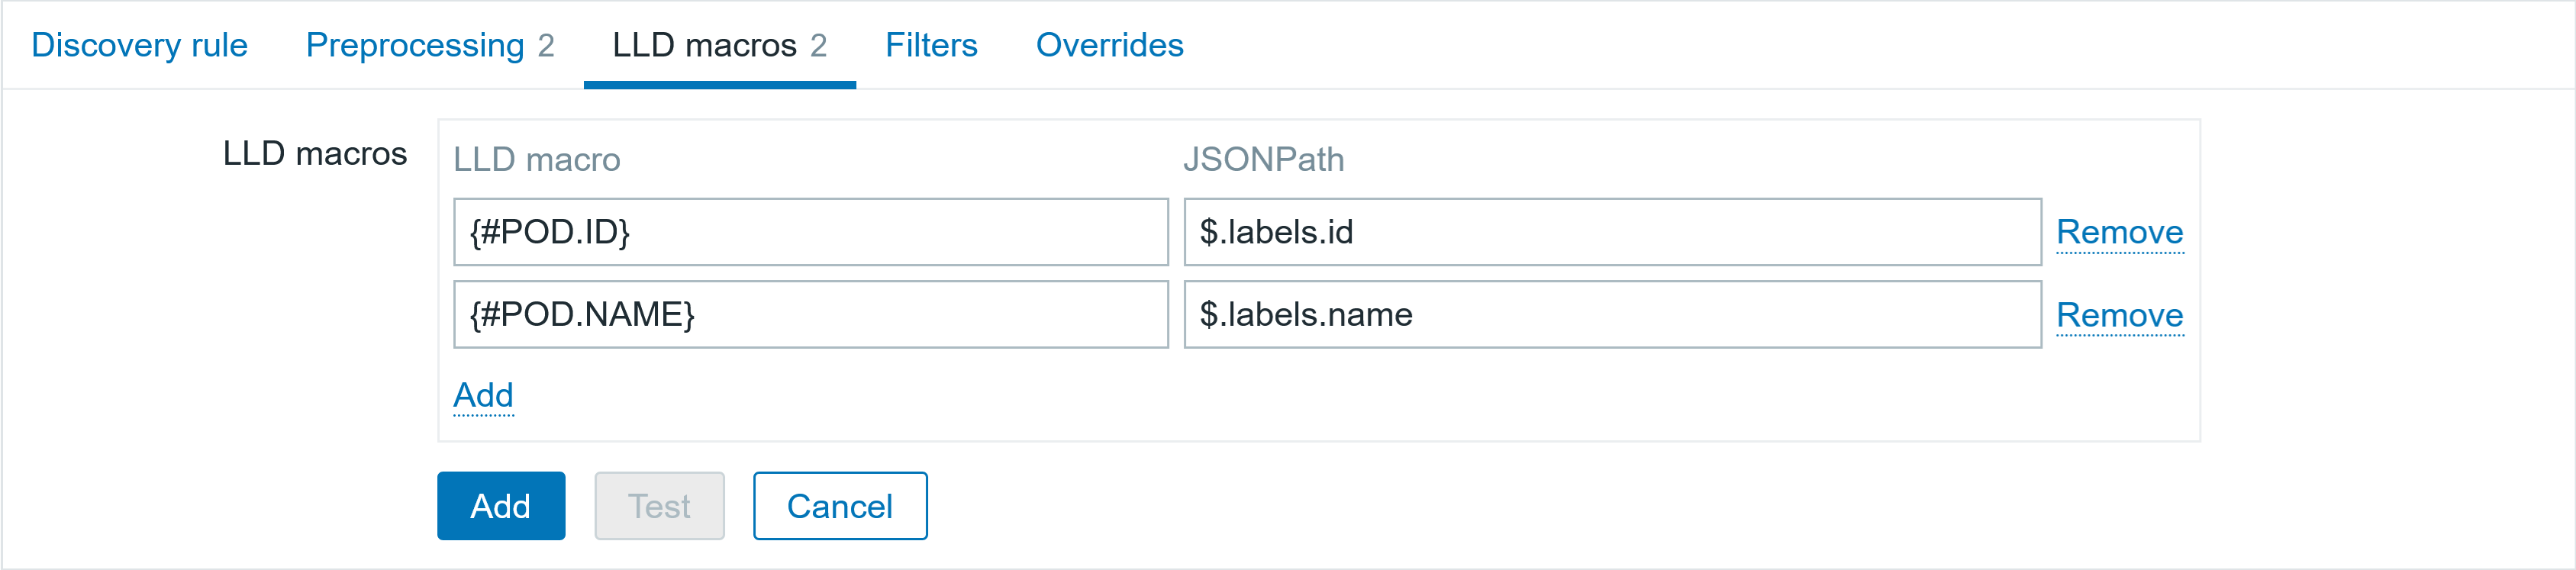
♦ LLD Macros
▪ {#POD.ID} $.labels.id
▪ {#POD.NAME} $.labels.name
The block diagram below will show how the data is transformed. First, a preprocessing step is applied to the data to convert the Prometheus pattern to JSON format, as all data for LLD must be supplied in JSON format.
In the example below, the matching queried pattern is returned in JSON format after this preprocessing step.
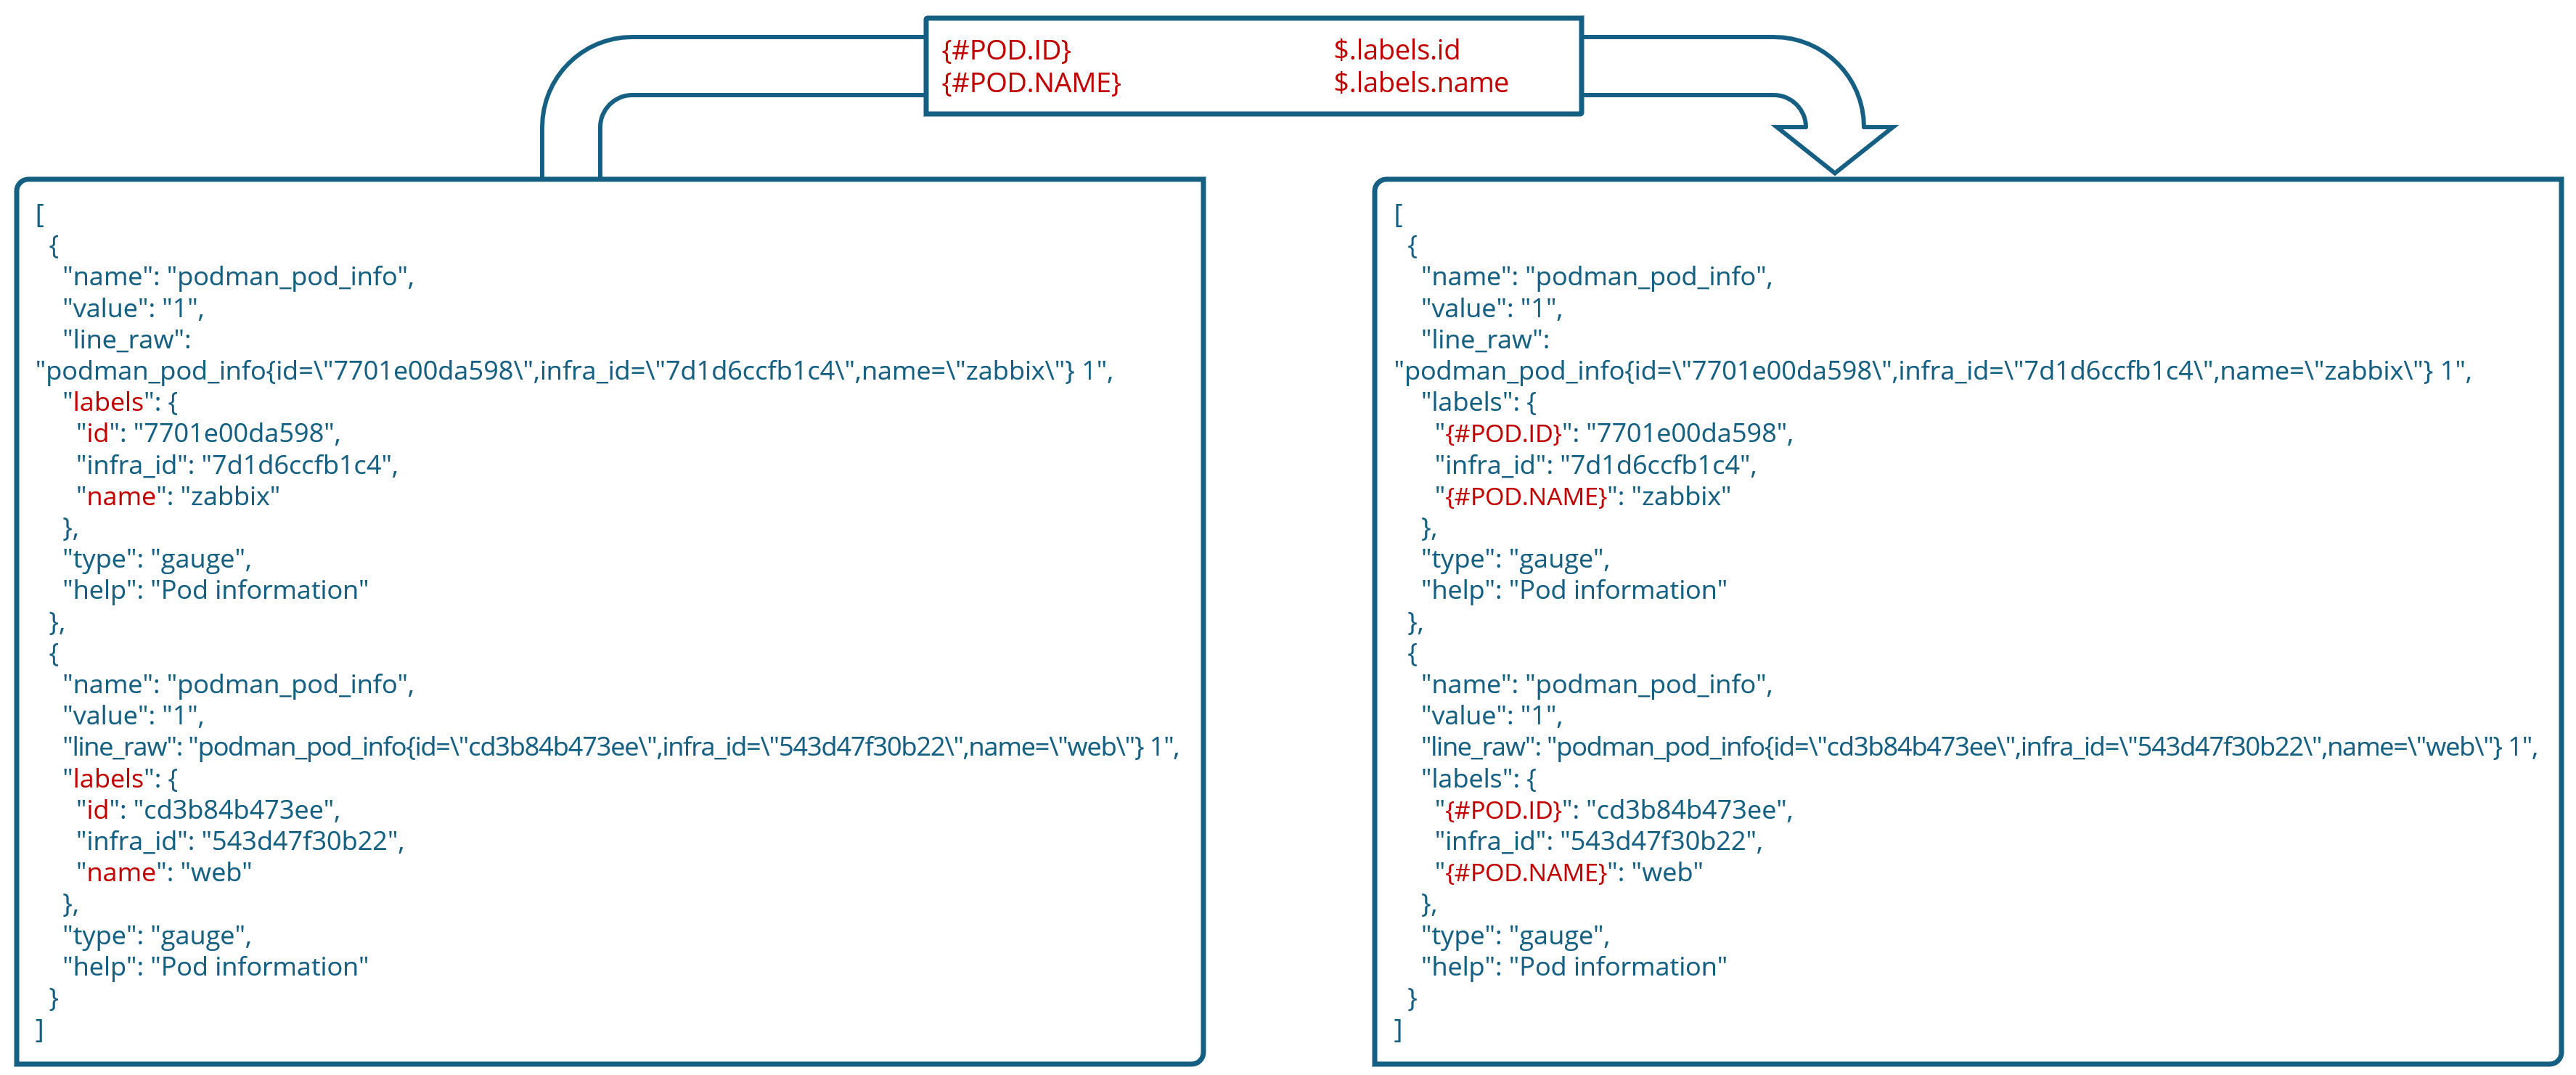
After the preprocessing step, we can assign specific JSONPATH values to LLD macros.
Creating a template Discovery rule: item prototypes
Now that we have discovered the macros we are interested in, the discovered macros can be used for further prototype (ITEM/HOST/TRIGGER) creation. In this example, I am using the same master item for LLD discovery and the dependent item prototypes, because it is convenient for me, and all the information is available in one item. But usually, there are scenarios where you have to use one item’s data for discovery and the data of another item for populating the prototype values.
In this case, I am interested in the pod ID, when the pod was created, the number of containers in the pod, and the state of the pod. Therefore, I will create the item prototypes and use the LLD macro in the name, key, and preprocessing step. Zabbix will cycle through the discovered LLD macro values and create the items based on the prototype by replacing the LLD macro with discovered values. Although you can set matching item prototype names (which will be confusing), you still have to use the LLD macro in the item key so that different item keys are generated – otherwise, you will get an error regarding duplicate keys. The item prototype parameters are given below.

Template: Podman containers by HTTP and Prometheus; Discovery rule: POD discovery
○ Item prototype #1
▪ Name: POD ID: [{#POD.NAME}]
▪ Type Dependent item
▪ Key: pod.id[{#POD.NAME}]
▪ Type of inf Character
▪ Master item Podman containers by HTTP and Prometheus: Podman info
♦ Tags
▪ Metric:ID
▪ Pod:{#CONTAINER.NAME}
♯ Preprocessing
▪ Prometheus pattern podman_pod_containers{id="{#POD.ID}"} label id
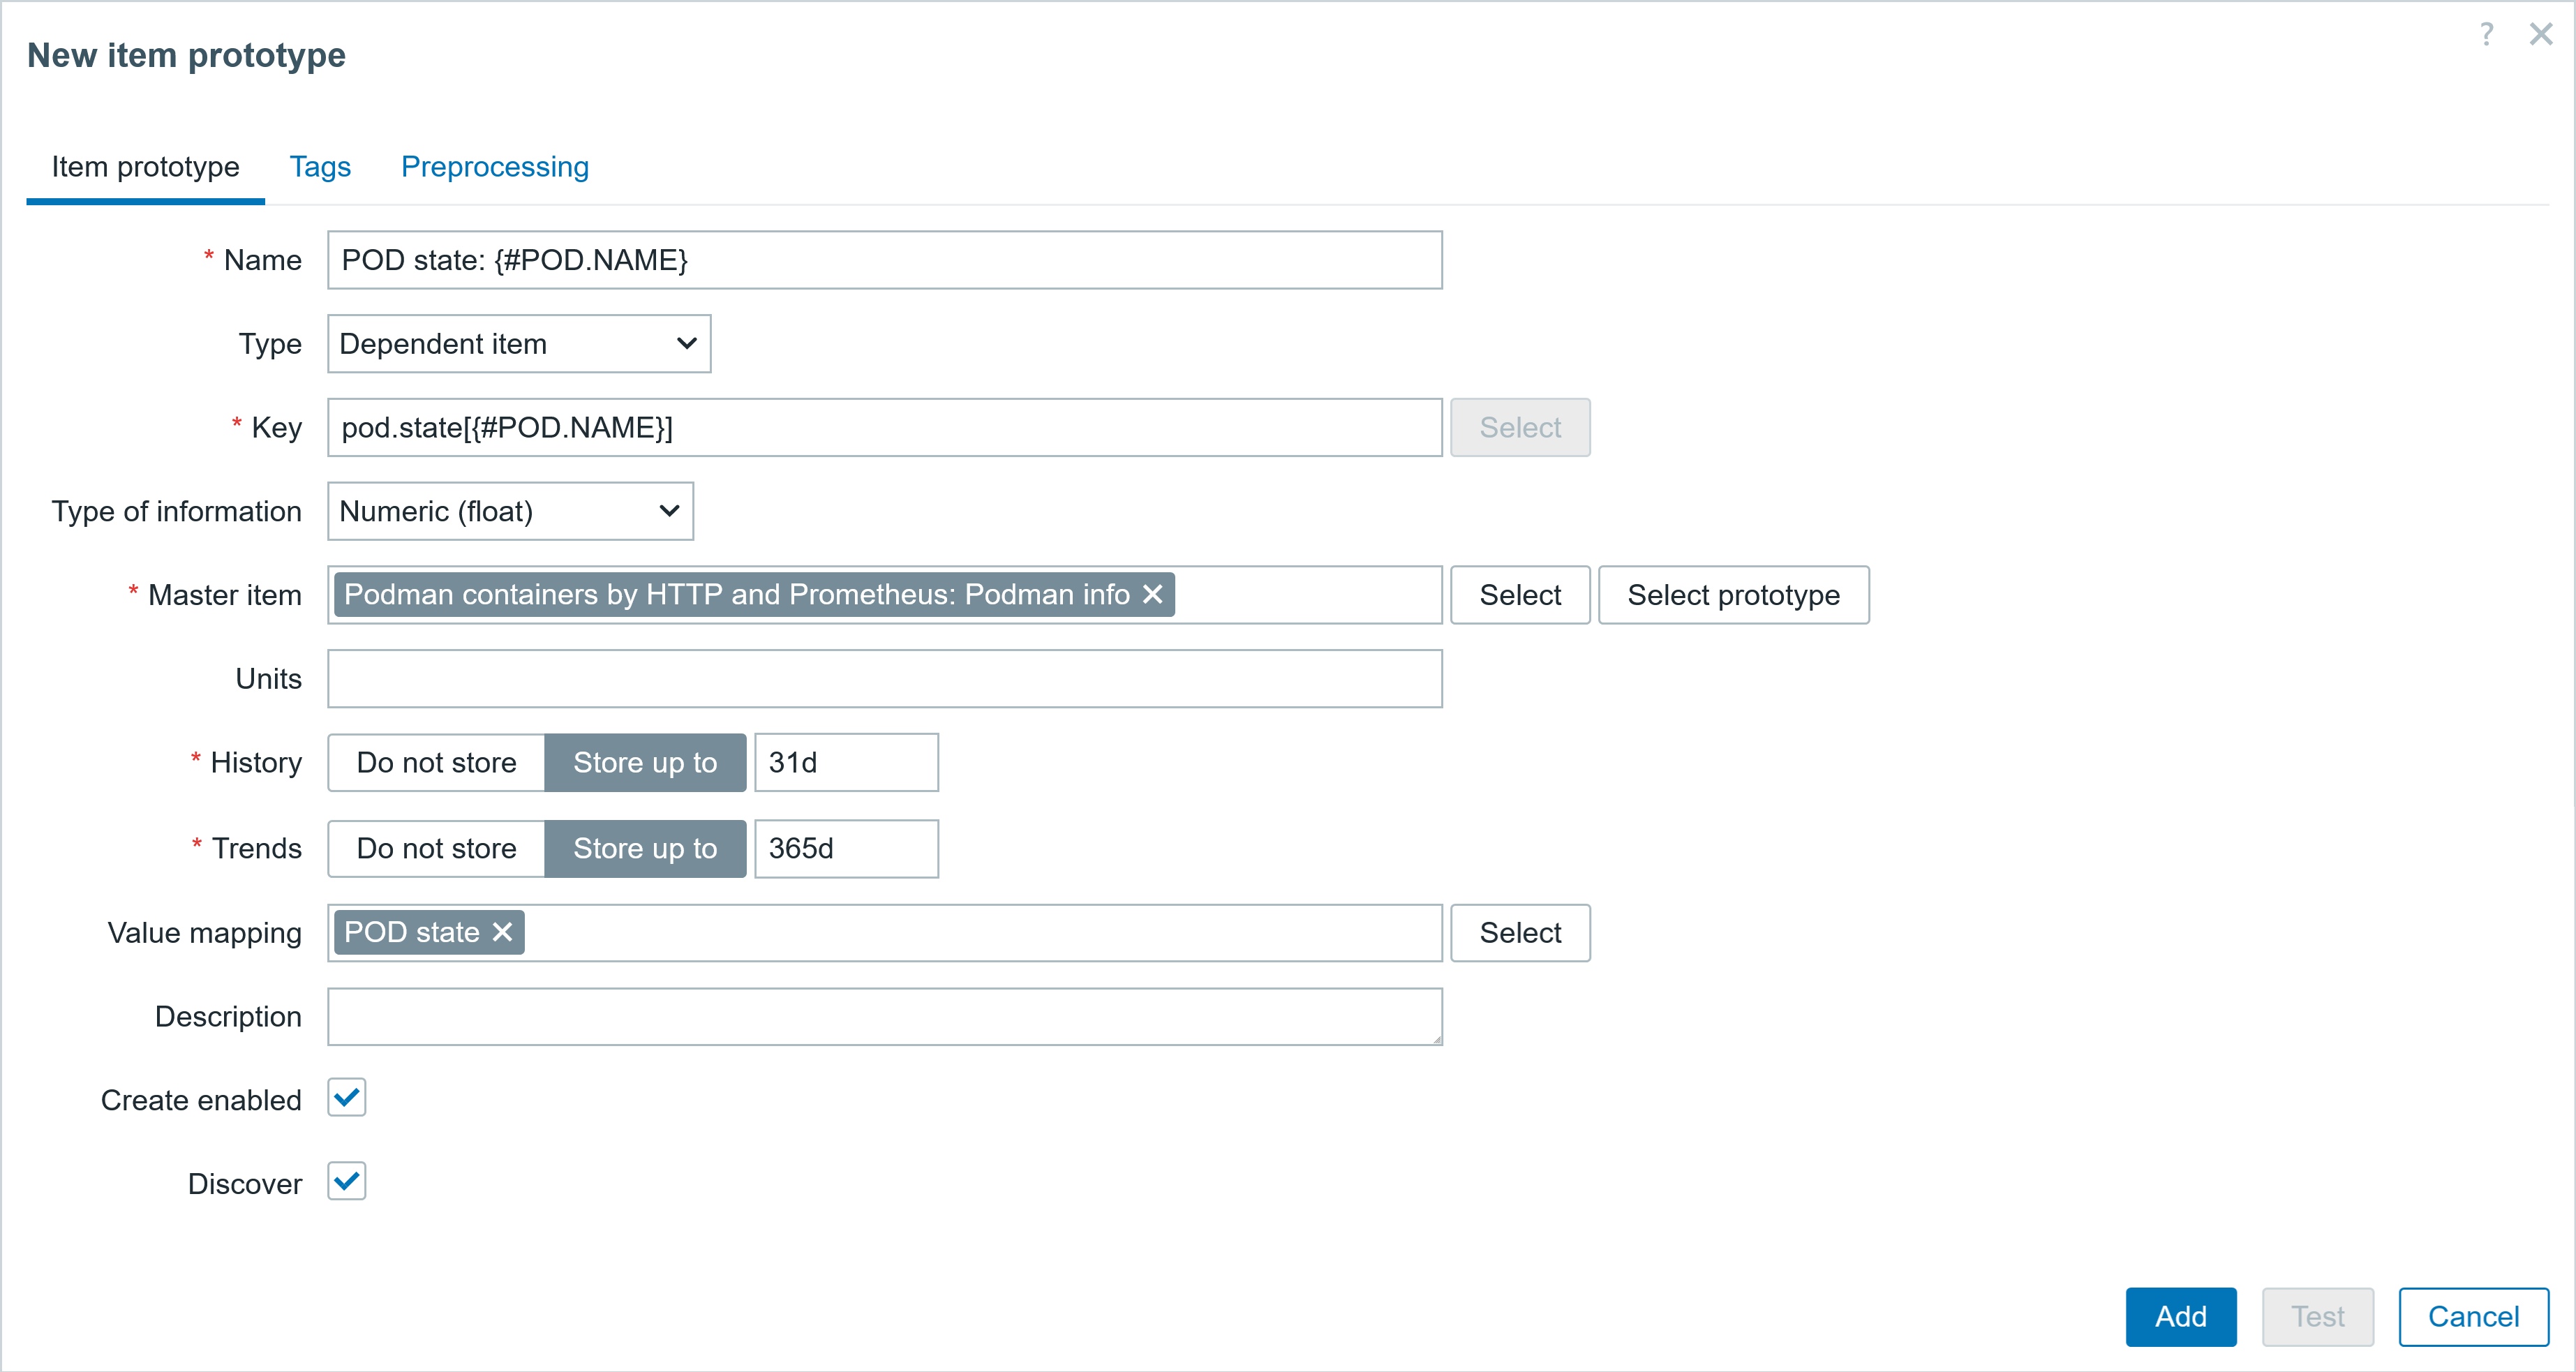
○ Item prototype #2
▪ Name: POD state: {#POD.NAME}
▪ Type Dependent item
▪ Key: pod.state[{#POD.NAME}]
▪ Type of inf Numeric (float)
▪ Master item Podman containers by HTTP and Prometheus: Podman info
▪ Value mapping POD state
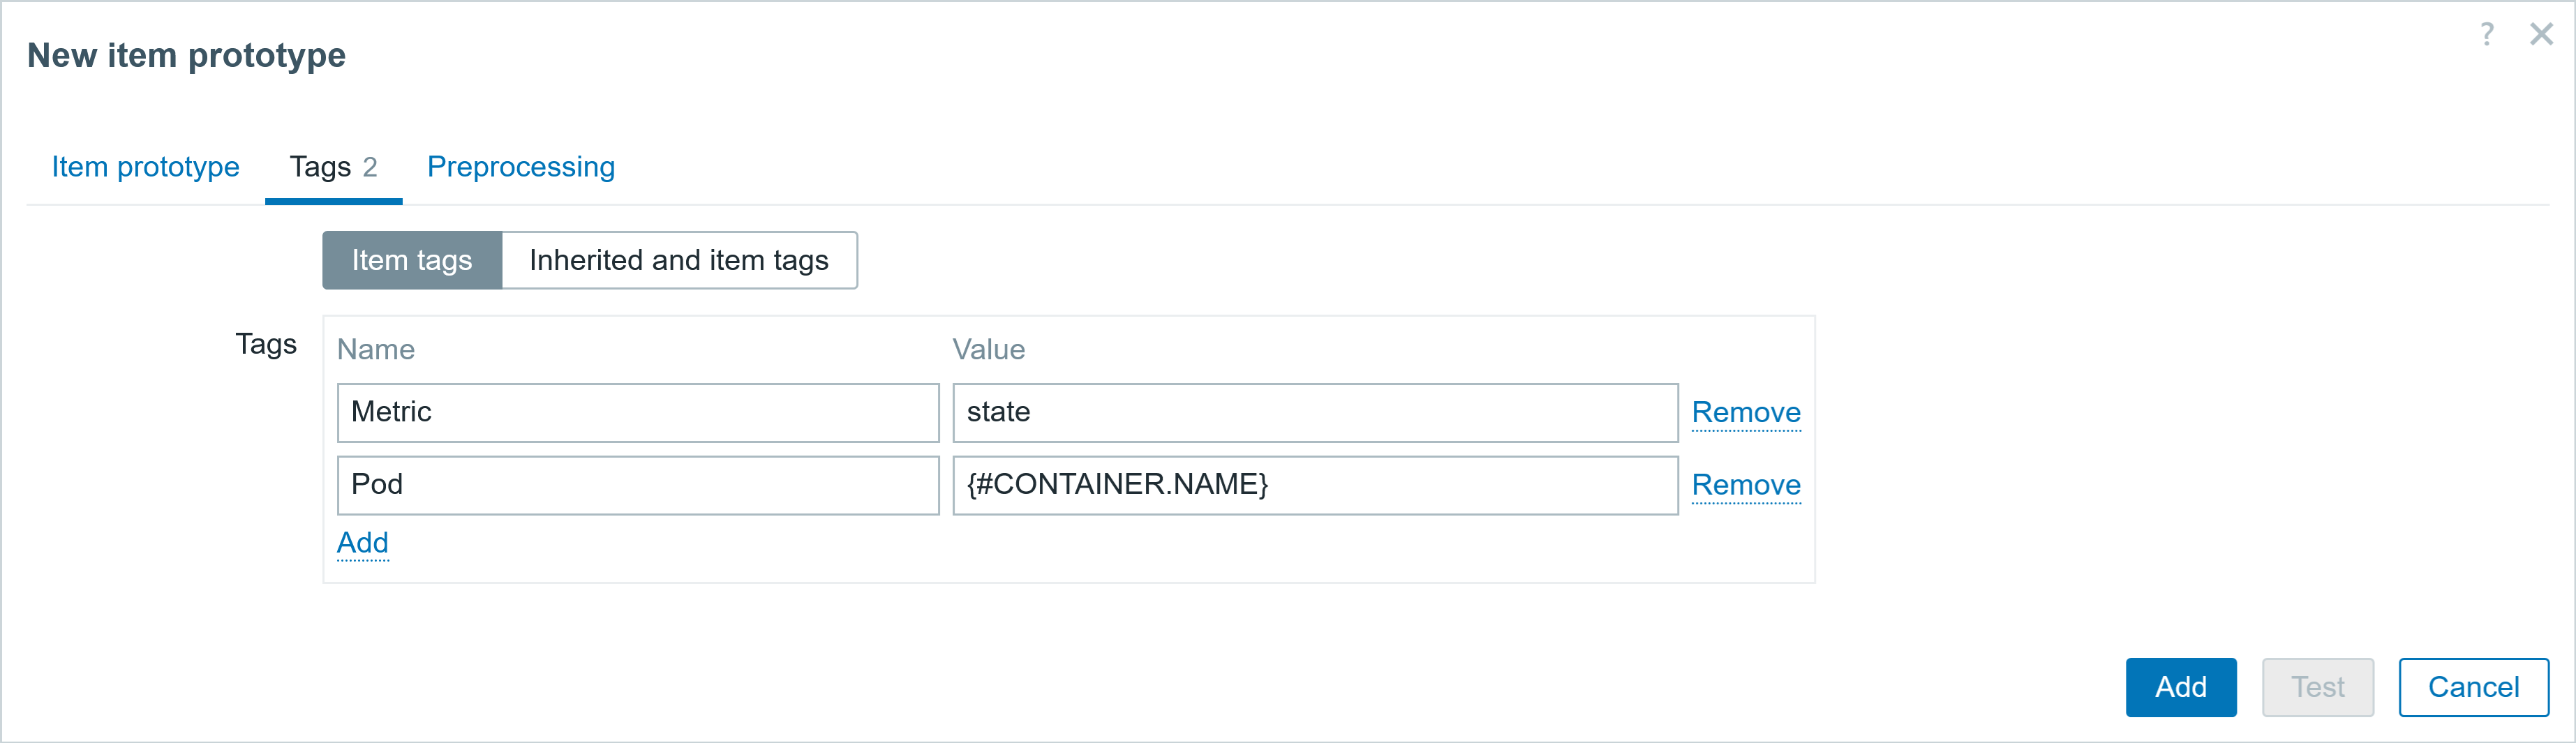
♦ Tags
▪ Metric:state
▪ Pod:{#CONTAINER.NAME}
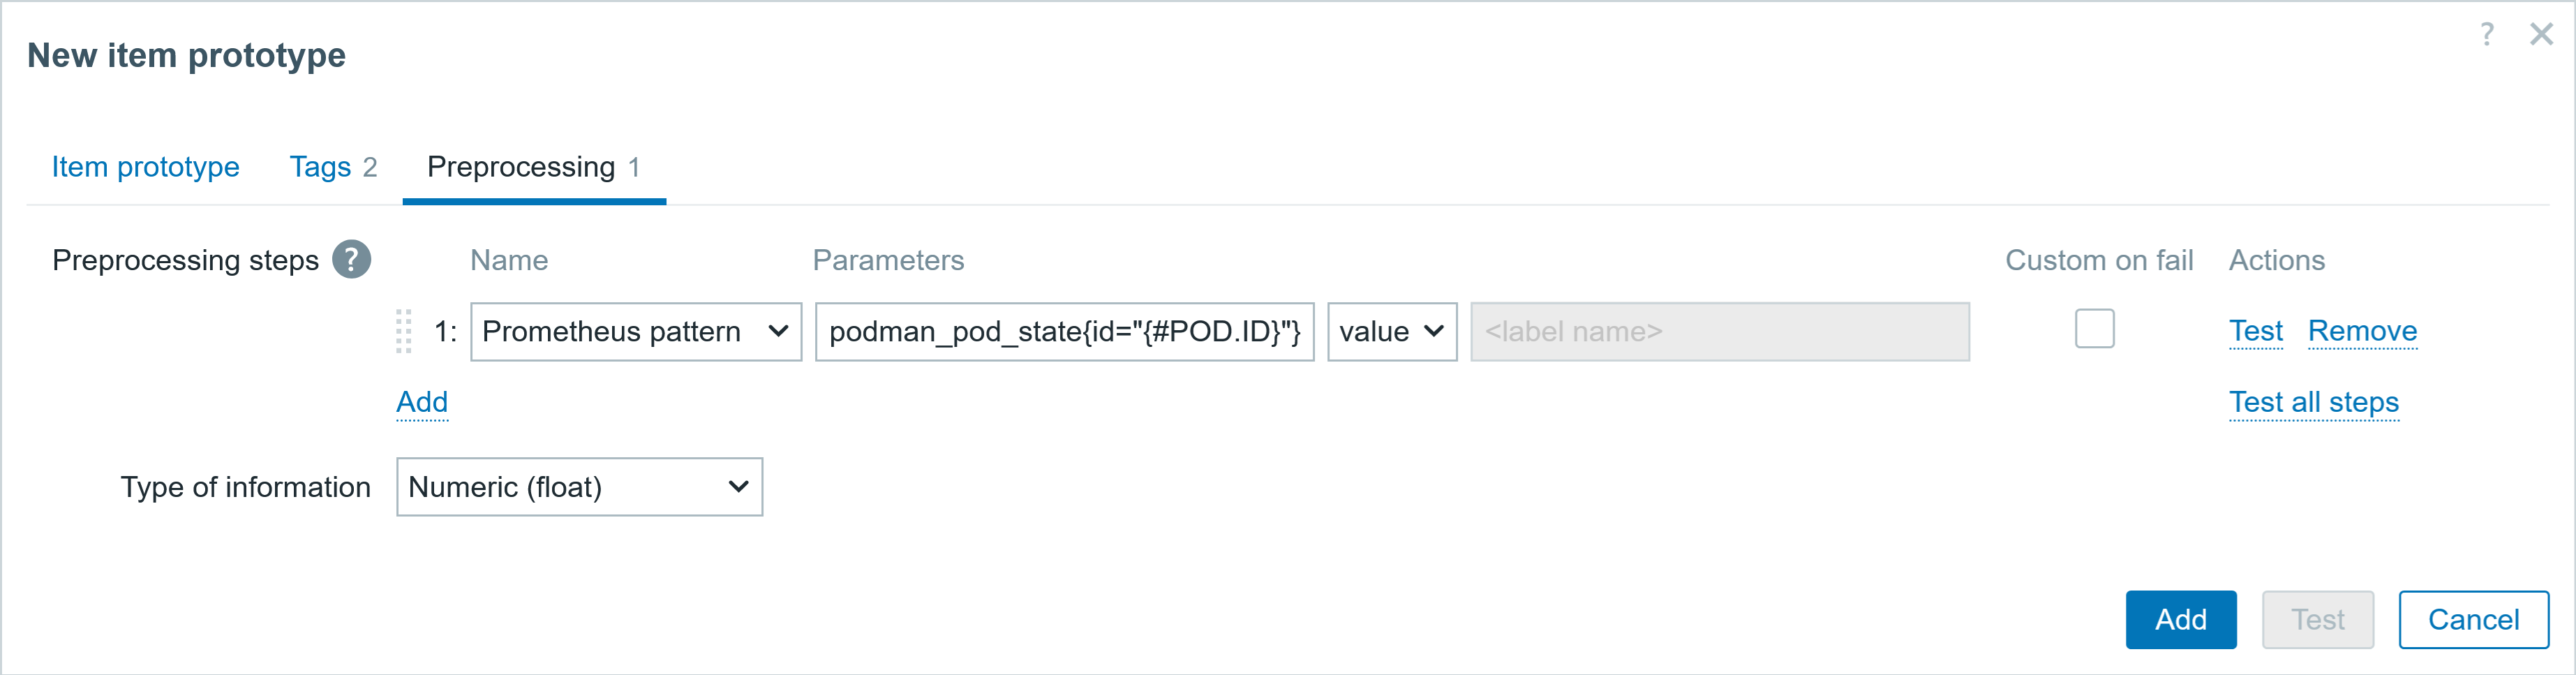
♯ Preprocessing
▪ Prometheus pattern podman_pod_state{id="{#POD.ID}"} value
○ Item prototype #3
▪ Name: POD created at: [{#POD.NAME}]
▪ Type Dependent item
▪ Key: pod.created[{#POD.NAME}]
▪ Type of inf Numeric (unsigned)
▪ Units unixtime
▪ Master item Podman containers by HTTP and Prometheus: Podman info
♦ Tags
▪ Metric:created
▪ Pod:{#CONTAINER.NAME}
♯ Preprocessing
▪ Prometheus pattern podman_pod_created_seconds{id="{#POD.ID}"} value
○ Item prototype #4
▪ Name: POD container count: [{#POD.NAME}]
▪ Type Dependent item
▪ Key: pod.count[{#POD.ID}]
▪ Type of inf Numeric (unsigned)
▪ Master item Podman containers by HTTP and Prometheus: Podman info
♦ Tags
▪ Metric:count
▪ Pod:{#CONTAINER.NAME}
On the template, I have also created a value map for deciphering the numerical pod state codes to text strings for better clarity.
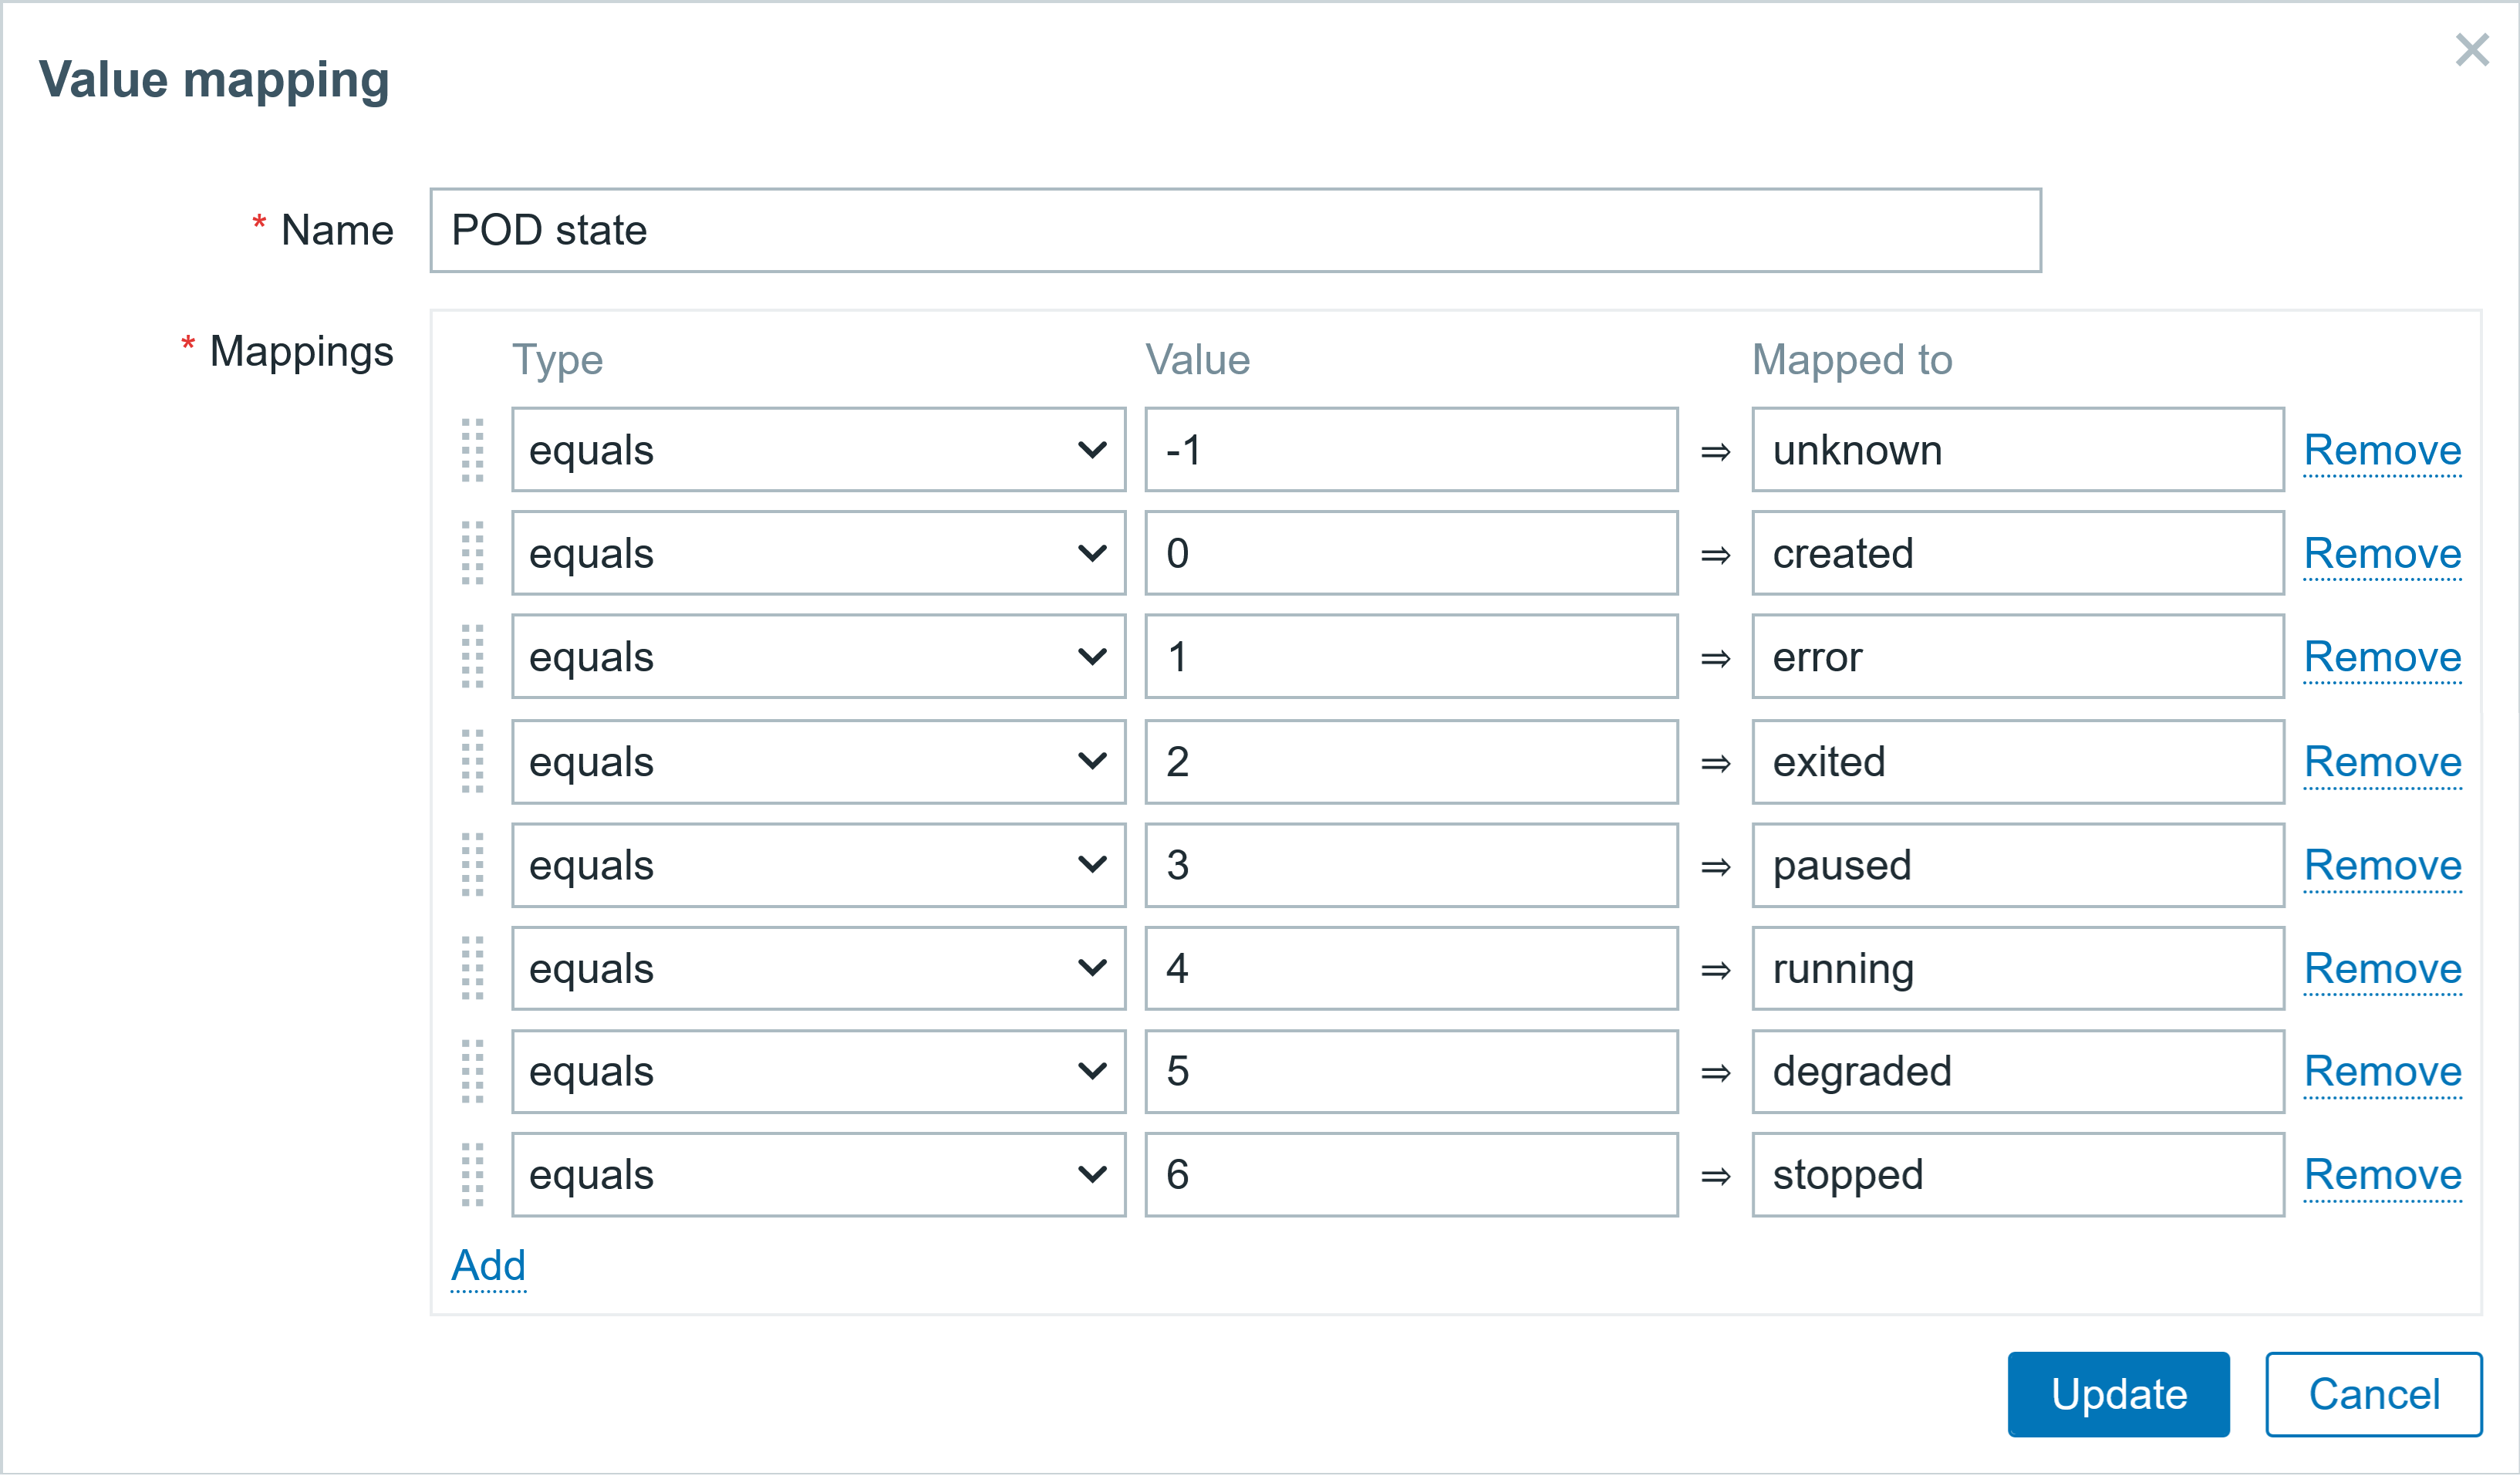
Here are some screenshots of the POD state item prototype, shown below.
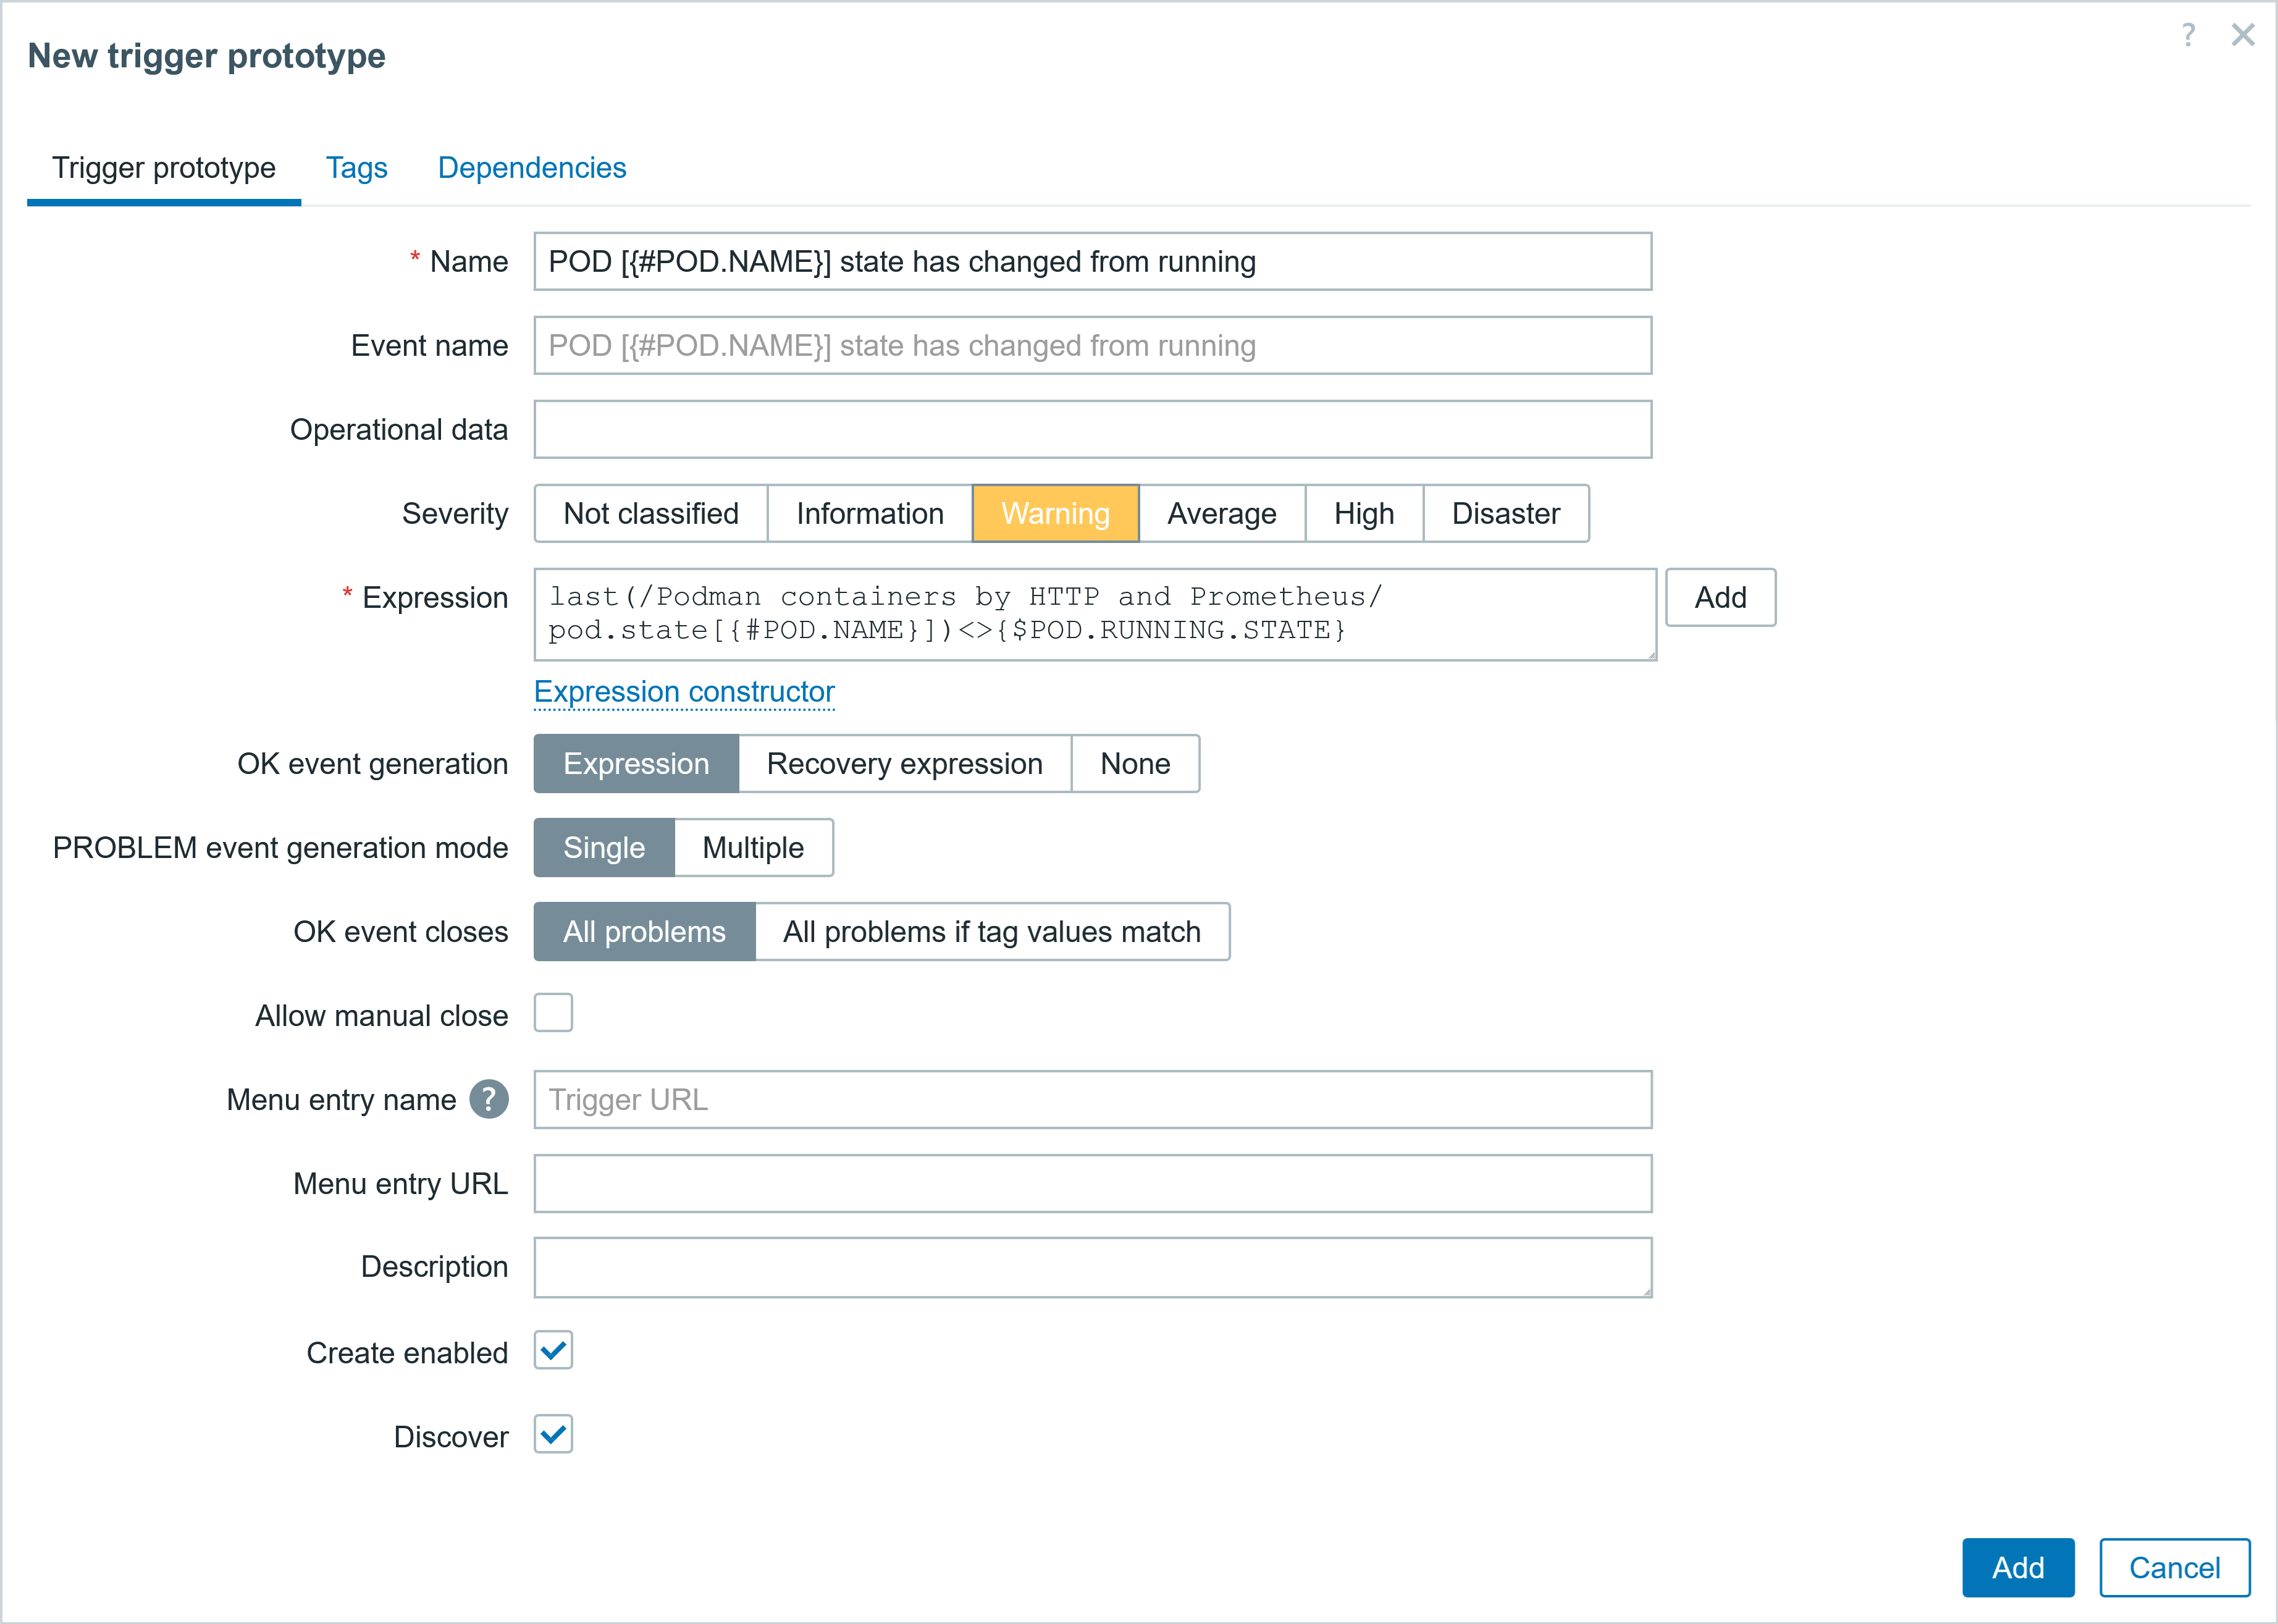
Creating a template Discovery rule: trigger prototype
We can also create a trigger prototype to generate an alert if there is something wrong with the pod. I have created a user macro {$POD.RUNNING.STATE} on the template with a value of 4, which corresponds to the running state.
Template: Podman containers by HTTP and Prometheus; Discovery rule: POD discovery

◘ Trigger prototypes:
  ▪ Name:               POD [{#POD.NAME}] state has changed from running
  ▪ Severity:           Warning
  ▪ Expression: last(/Podman containers by HTTP and Prometheus/pod.state[{#POD.NAME}])<>{$POD.RUNNING.STATE}
  ▪ PROBLEM event generation mode: Single
  ▪ OK event closes: All problems
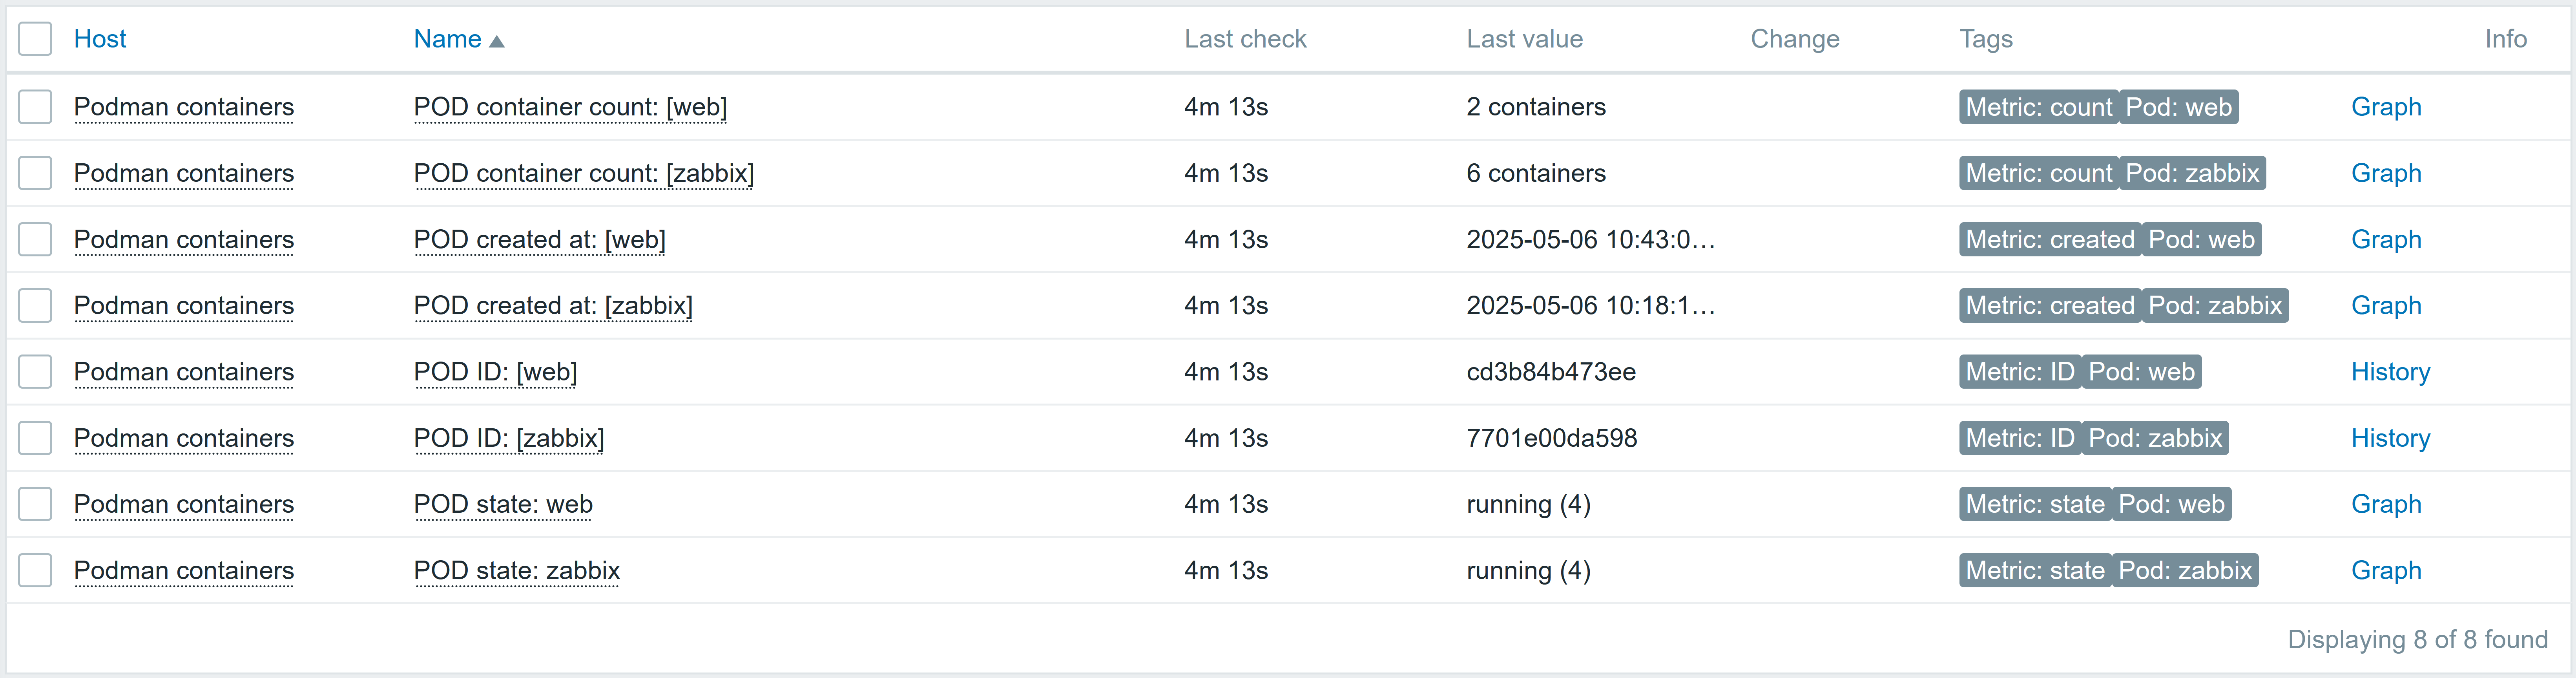
Once you link the template to the host and execute the LLD rule, you should start seeing the Podman pods ( if you have them), similar to the screenshot below.
Summary
This blog post shows how to get data with HTTP agent from Prometheus Podman exporter and use the same item data for the Discovery rule as well as item and trigger prototypes. Check out part 2 of this series to find out how to discover and monitor Podman containers.


Hello,
You need to install the “prometheus-podman-exporter” on the system where your Podman service is running, in your case, the Container server. To monitor Podman pods/containers, you don’t require a Zabbix agent installed on the container server. However, you can use it to monitor the system (Podman server) through various templates.