I. Introduction (0:59)
II. How not to create many items (3:03)
III. Low-level discovery (4:51)
1. Solving the SSL monitoring issue (5:44)
2. Monitoring OpenVPN Clients (9:33)
3. Application component monitoring (11:04)
IV. Questions & Answers (13:58)
How not to create many items
With a setup growing, you sooner or later run into an issue of creating too many items.
For instance, a few years ago one of the development teams had a project with a white-label domain per customer, and three subdomains per each domain. They needed to monitor the SSL certificates for 5 customer environments without wildcard certificates. So, essentially they had to create 15 items to monitor all these environments.
In such case, you can create a template with the 15 items. Here you can use macros, as macros are not specific to the host for which it is created, and can be reused in the future.
This structure worked fine as the certificates were being monitored, the team got notifications when it was about to expire, and they could ensure that it would be renewed on time.
However, at some point the team needed to disable monitoring for one of the customers. It’s easy to do so when you use macros, as you can simply empty out those values to stop monitoring.
But then they also had three new customers to monitor, so the number of required items actually grew to 18. Such configurations doesn’t scale well, so we needed a better solution — Low-Level Discovery.
Low-level discovery
Low-Level Discovery is a built-in functionality since Zabbix 2.0, which automatically creates items, triggers, and graphs based on JSON input received from the Zabbix Agent or the Zabbix Server.
It is getting more advanced with every new version, and hopefully, it will also include discovering web scenarios one day.
In our environment, we use low-level discovery to monitor:
-
- PHP-FPM pools,
- OpenVPN clients,
- Gitlab health checks,
- Docker containers,
- Backup tasks,
- Dnsmasq metrics,
- SSL Certificates,
- PM2 applications,
- FreeSWITCH trunks,
- Cronjobs
- Application components.
The monitoring list is open, and you can use LLD for anything you like as long as you can create JSON for it.
Solving the SSL monitoring issue
So, our configuration of 15 or 18 items doing the same thing doesn’t scale well, and we may try to solve this issue with the help of low-level discovery.
1. Script
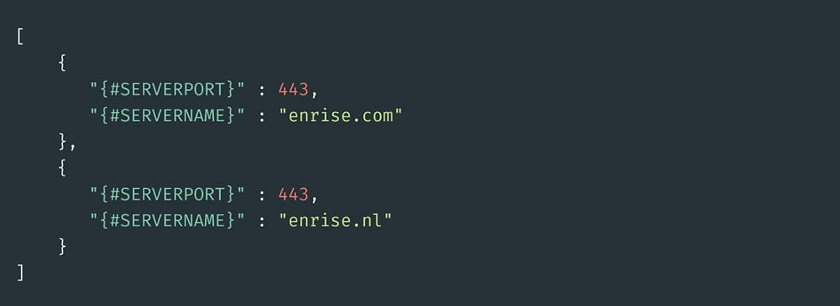
The first step was to create a script that would read webserver configuration both for Apache or Nginx, and it would return a list of all the free hosts on the particular server.
Script reading webserver configuration
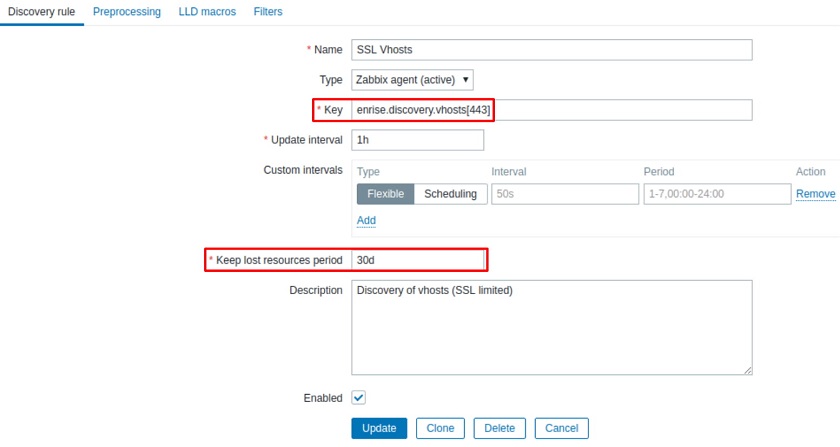
Within the Zabbix webinterface, you can create the discovery rule.
LLD rule for SSL monitoring
NOTE. The Keep lost resources period is the value, which indicates how long an item should retain the resources when they are no longer being discovered. This value can vary from one hour to 25 years, or it can be set to zero. Here you need to be careful, — if your JSON output does not contain the item, or you have it set to zero, it will mean that the items and triggers for it will ultimately be removed by Zabbix if, for instance, you have a bug in your script or if your filters are too strict and are filtering out the desired items.
2. Preprocessing
Preprocessing allows you to mutate the data your script produces. You can apply regular expressions, convert XML to JSON, or CSV to JSON, and since Zabbix 4.2 you can even use JavaScript for advanced preprocessing to format the data into something Zabbix can work with.
Defining preprocessing rules
3. LLD macros
Low-level discovery macros are used for creating items and triggers. In my example, no LLD macros should be specified as JSON output already contains these macros. If your JSON is more complicated, for instance, if your vendor is producing a JSON feed, you can use this to point it towards a particular part in your JSON file.
LLD macros
4. Filters
Finally, there’s an option to filter out the input of low-level discovery. In our example, I only need the fields that are listening to port 443 as I’m doing SSL monitoring.
Filtering
5. Creating items and triggers
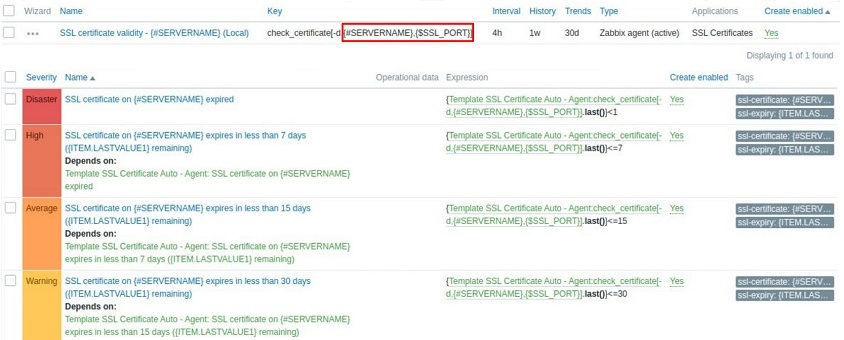
After you’ve created the low-level discovery rule, you need to create items and triggers. Unlike with ordinary templates, you need to create a prototype instead of items and triggers.
The prototype is a blueprint of how your items and triggers should be based on the low-level discovery input. You can also use the LLD macros in your script output.
Item and trigger prototype
The discovery gets executed and Zabbix creates the items as a prototype,
Creating items as a prototype
and creates a set of pre-configured triggers.
Creating triggers as a prototype
In this particular setup, we are using a set of cascading triggers to increase the severity level for each time, as you are getting closer to the actual expiry date of a certificate every day.
Monitoring OpenVPN Clients
We also use low-level discovery to monitor our OpenVPN clients.
-
- Users generate their own configuration via our VPN Portal.
- UserParameter script on the VPN instance returns a list of users to Zabbix Discovery.
- Zabbix creates the desired items (traffic in/out & client IP).
Monitoring OpenVPN Clients
We have implemented this functionality for two reasons:
-
- Tracking VPN bandwidth usage per user.
Tracking bandwidth usage per user
-
- Tracking accidental VPN usage at the office.
Tracking accidental usage at the office
This feature is linked to Zabbix alerting, which automatically send a Slack notification to the persons in question notifying them that they’re either using too much traffic or that they accidentally have the VPN client running on while they’re at the office.
Application Component Monitoring
We are also using low-level discovery to monitor specific application components, such as external APIs and database connectivity.
So, you can monitor whether your database server is running, but you also need to check if your application is able to actually use that database, for instance, if there is a mistake in the configuration, a bug or missing dependency preventing the application from using the database. Application Component Monitoring can specifically check for this, for instance, we can check whether the API works for payment processing.
Two teams engage in application component monitoring:
-
- The development team is the one who has created the application, so they generally know best how it works and how they can check if it works.
But they do not generally have knowledge about Zabbix. They also want to be able to define their monitoring needs without waiting for the Ops to implement new changes. - The Ops team knows a lot about Zabbix, but they don’t know much about the application and its components developed by the development team.
- The development team is the one who has created the application, so they generally know best how it works and how they can check if it works.
So, we give both teams a way to simply define what application components they have and what the status is. To do this, they create two endpoints within the application:
-
- Key endpoint — a list of all specific application components they want to monitor, for instance, database connection, a feed, or an API, or define severity on the web level.
/monitoring/keys.json
-
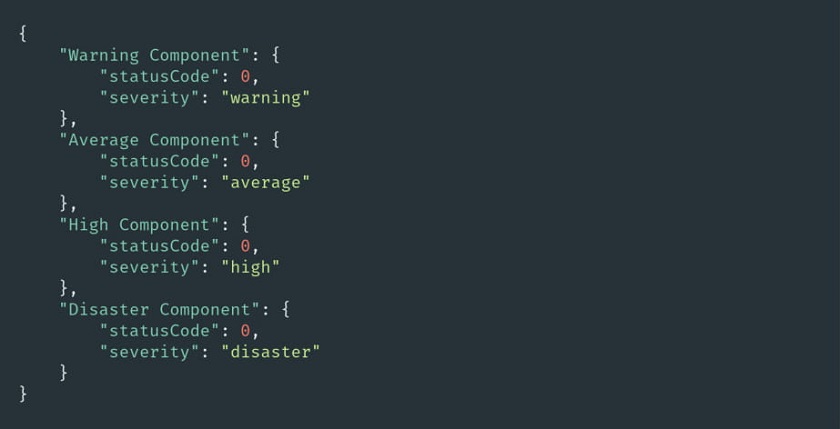
- Status endpoint contains the same components, and the status pulled by Zabbix.
/monitoring/status.json
As our low-level discovery is executed, it automatically creates all the required items with the specified severity level within Zabbix, as well as the linked triggers. So, if a change is needed, for instance, if they need to remove an API or add a new one, they can simply do it inside their code, and Zabbix will automatically pick on the change and start monitoring it.
Application Component Monitoring
NOTE. Application Component Monitoring is an open-source solution downloadable from GitHub at https://enri.se/zabbix-appmonitor
Questions & Answers
Question. Do your developed applications trigger low-level discovery, or is there a process to check the application?
Answer. We have to do the two feeds in LLD. The first is to retrieve the actual components, so it creates the items. And we have a script running on the Zabbix Server that is polling the status endpoint.
Question. How do you set up LLD triggers if, for instance, different services have different return values?
Answer. Our application component monitoring system uses zero, one, or two statuses, and it maps them within Zabbix that changes ‘0‘ to ‘OK‘ and ‘1‘ to ‘Error‘.
If your specific component returns a different value, this is something the application has to do while generating the key or status endpoint and translate your particular visual code into the one supported by our application component monitoring functionality. So, you have to normalize the status codes so that they’re consistent across all of the services.
See also: presentation video and slides.


 Prev Post


