A well-designed monitoring dashboard is the key to helping users process, interact with, and analyze data. Done right, it allows key decision-makers to track metrics and gain insights in an organized, easy-to-read format, while giving technical teams complete visibility into IT performance at a single glance. Done wrong, it creates information overload, with too much of everything – too many graphs, colors, widgets, and other sources of information, making it at best deceptive and at worst completely useless.
Obviously, there’s no dashboard big enough to display every possible metric for every possible stakeholder, which is why the key to making a well-organized, informative dashboard that doesn’t confuse the viewer is knowing which metrics to track. By sticking to the absolute “must haves,” you’ll make sure that users can find mission-critical information first. But how should you choose which metrics to track? We’ve put our hard-won dashboard expertise to work and identified four key metric groups that no dashboard should be considered complete without.
Global metrics
System uptime and availability. Availability is one of the most important metrics you can use to determine your network’s performance, because it’s a metric that everyone can see the effects of immediately. For a business, it’s critical when it comes to making sure that the services provided to users are consistently available.
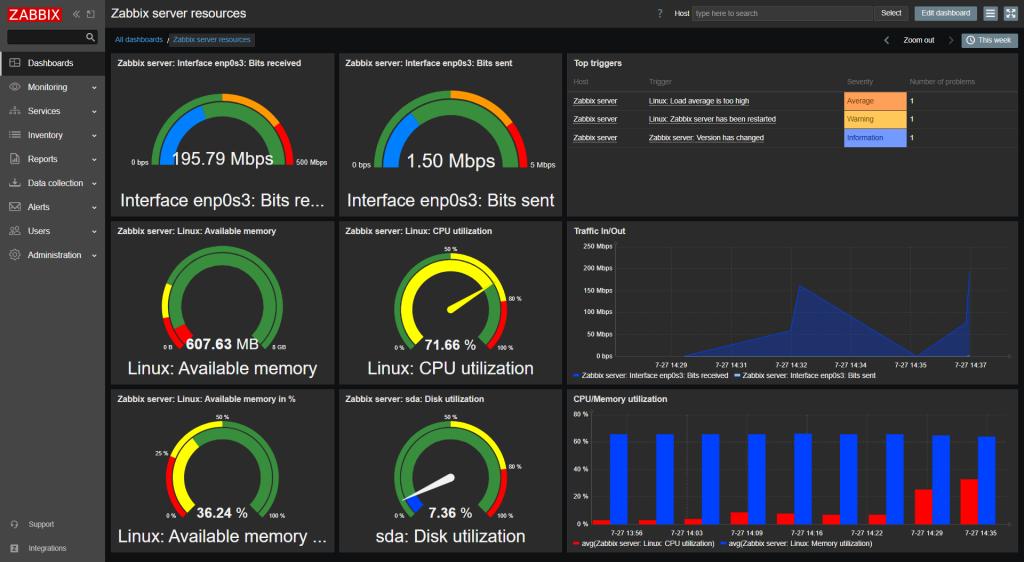
Overall resource utilization (CPU, memory, disk storage, etc.). Think of tracking resource utilization like keeping tabs on your phone’s battery life. You need to track CPU, memory, disk storage, and network usage to keep everything running smoothly. Keeping an eye on those metrics will help you fix small issues before they turn into gigantic problems.
Top critical issues or alerts. Speaking of problems, they can and will happen – and when they do, you’ll naturally want to know about them as soon as possible. An alert can be as simple as a notification of a system update, or it can draw attention to an unusual spike in errors. It could also call attention to a major emergency that demands immediate attention. Either way, no effective dashboard is complete without them.
SLA compliance status. If you’re running a business, monitoring SLA compliance status lets you see service availability and performance, which in turn guarantee customer satisfaction. It allows for quick detection of issues, making proactive management and resolution possible before customers feel any impact.
Infrastructure metrics
Server performance (CPU, RAM, disk I/O). Tracking the response time, central processing unit (CPU) utilization, memory consumption, and network bandwidth of a server helps guarantee a functional user experience. It involves keeping an eye on CPU and RAM utilization, disk I/O (input and output operations involving a physical disk), plus a variety of other sub-metrics.
Application health. Monitoring application health involves collecting, analyzing, and interpreting data about an application’s performance, availability, and behavior. It’s mission-critical because it can help you detect and troubleshoot problems, optimize resource utilization, and provide the application’s users with the quality experience they expect.
Storage usage and trends. Keeping track of storage usage on your dashboard gives you a real-time view of storage metrics as well as predictive analytics (useful for capacity planning) and proactive issue detection, across on-premise and cloud storage environments. Like so many other monitored metrics, its purpose is to maintain optimal storage performance while preventing potential issues before they impact any business operations.
Database performance metrics. Basically, database monitoring is how you measure what you want to improve. It’s what you do before you start performance tuning. Keeping track of your database on your dashboard makes this possible by collecting performance metrics, so that you’re always aware of whether your database can fully support your applications and respond quickly to queries.
Network metrics
Bandwidth utilization and traffic patterns. Bandwidth refers to the maximum data transmission rate on a network at a particular time. Having this metric on your dashboard will let you easily track the amount of bandwidth your network is using and make you immediately aware if you run over the bandwidth threshold.
Latency and packet loss. Latency, or network delay, is a network performance metric that measures the amount of time it takes to transfer data from one destination to another. Consistent delays or unusual spikes in delay time usually mean that you have a major network performance issue. Tracking latency and packet loss on your dashboard will let you know if data transfers are taking too long, while also helping you make sure that any lost data packets get to their destinations.
Interface status and error rates. A network interface can be either networking hardware or a software interface. Monitoring them on your dashboard lets you see each and every network device, and tracking their performance is important when it comes time to identify the root causes of poor performance and network bottlenecks.
Firewall and VPN tunnel status. Monitoring the status of Firewalls and VPN tunnels is important because (among other things) it keeps you aware of whether your VPN tunnel interface is up and available for passing traffic, and whether the destination IP address being monitored is reachable. At the same time, you’ll also have access to real-time information about how your firewall is working, which will keep you aware of any security holes or incorrect settings before they become major problems.
Security metrics
Unauthorized access attempts. Unauthorized access is a big risk to businesses, jeopardizing sensitive data and disrupting operations. You can track attempts by unauthorized users to gain access to any website, server, device, or app by monitoring user activity on your dashboard. This data can also be labeled and sorted so that you can easily interpret it at a glance.
Endpoint security status (AV, patching). Endpoints are basically any devices that connect to networks, including laptops, mobile phones, and IoT devices. The more of them you have, the greater your chances of data loss and cyber threat entry. Monitoring the critical junctures of endpoints on your dashboard will help you identify and prevent threats while making sure that you have quick response measures in place to protect your data and systems.
Compliance and audit logs. Compliance and audit logs are there to make sure errors are noticed and fixed, keep you compliant with regulatory requirements, improve business security, and detect fraud. Monitor them on your dashboard, and you’ll have real-time visibility into your compliance posture as well as immediate alerts when a potential violation is detected.
Active security alerts or anomalies. Continuously keeping an eye on your systems and network lets you detect threats (anything from malware to abnormal activities and unauthorized access) before they escalate and cause real damage. In turn, this helps you maintain user trust, avoid downtime, and comply with data security regulations.
These metrics should give any dashboard a solid foundation that can be easily customized to meet specific business or operational goals.
The Zabbix Advantage
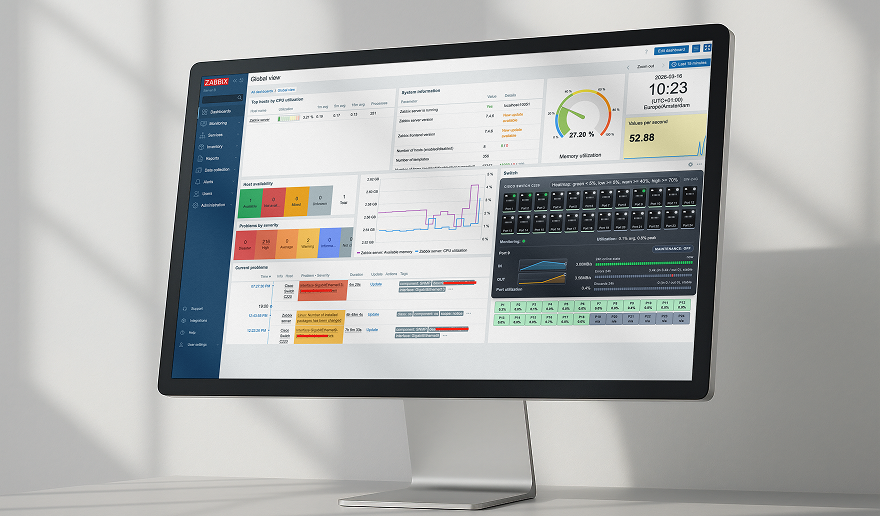
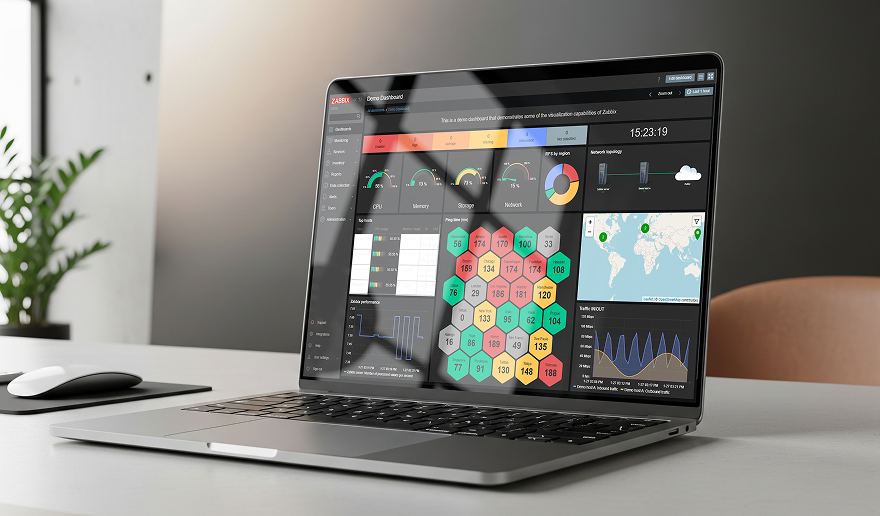
One of Zabbix’s most important features has always been our easily customizable dashboards, which allow users to see and analyze even the most complex monitoring data at a single glance. When it’s time to keep tabs on the essential metrics we identified above, Zabbix dashboards allow anyone (or any infrastructure team) to efficiently monitor network performance, manage resource usage, and guarantee device/application availability.
Zabbix’s graphing and visualization features make it easy to see historical trends and make comparisons. You can choose whatever visualization format is best for a particular set of data, including line graphs, bar charts, pie charts, gauges, and more. Not only that, Zabbix dashboard widgets can communicate with each other, serve as data sources for other widgets, and dynamically update the information they display based on the data source.
To learn more about the flexibility of Zabbix dashboards and see how they can help you track just about any metric imaginable, contact us.


 Prev Post


