Category:
How To

Monitoring Pure Storage FlashArray with Zabbix
March 25, 2025
Handy Tips
Monitoring data storage systems is the key to keeping modern IT systems running smoothly. With the rapid growth of data and the need for instant access, using high-performance solutions like Pure Storage FlashArray is not just an advantage – it’s a necessity. However, even the most advanced systems require careful oversight regarding their performance and […]
The First Steps Toward Monitoring with Zabbix and SNMP
March 11, 2025
Handy Tips
In this article, we’ll explore how to use Zabbix to monitor a MikroTik device via SNMP, using specific templates that allow you to visualize the status of interfaces and their performance. Read on to understand how to use network monitoring to ensure the correct operation and performance of devices in an infrastructure employing the SNMP […]
Building a Monitoring Dashboard: Which Metrics to Track?
March 4, 2025
Community
A well-designed monitoring dashboard is the key to helping users process, interact with, and analyze data. Done right, it allows key decision-makers to track metrics and gain insights in an organized, easy-to-read format, while giving technical teams complete visibility into IT performance at a single glance. Done wrong, it creates information overload, with too much […]

Creating a Personal Assistant in Zabbix with Artificial Intelligence
February 5, 2025
How To
Zabbix is dedicated to monitoring IT infrastructures based on predetermined thresholds, such as servers, networks, and applications. Incorporating artificial intelligence (AI) into Zabbix as a complement allows a user to mitigate alerts based on these predetermined thresholds, offering possible causes and solutions to problems. This can help a user resolve incidents more efficiently.

Monitoring Sensor Data with Zabbix and Modbus Protocol
January 23, 2025
How To
This week’s blog entry comes to us from Nyein Chan Zaw, who is based in Bangkok, Thailand and works as an Infrastructure Specialist for Green Will Solution. Read on to see how he uses his integrating a Modbus protocol with Zabbix to monitor data from temperature, humidity, and smoke sensors — and display their metrics […]
File Integrity Monitoring with Zabbix
December 12, 2024
How To
We have often seen Zabbix used as a simple tool for monitoring network assets as well as Information and Communication Technology (ICT) infrastructure. While this concept is not incorrect, it is equally important to understand that with the advancement of Zabbix versions, more and more functionalities have been made available for other types of monitoring, […]
An Introduction to Browser Monitoring
December 3, 2024
How To
Website and web application monitoring can vary from simple use cases to complex multi-step scenarios. To fully cover the scope of modern website monitoring requirements, Zabbix has introduced Browser item, a new item type that brings with it multiple accompanying improvements for simulating browser behavior and collecting website metrics.
Monitoring VMware vSphere with Zabbix
November 20, 2024
Handy Tips
Zabbix is an open-source monitoring tool designed to oversee multiple IT infrastructure components, including networks, servers, virtual machines, and cloud services. It operates using both agent-based and agentless monitoring methods. Agents can be installed on monitored devices to collect performance data and report back to a centralized Zabbix server.
Using the zabbix_utils Library for Tool Development
November 12, 2024
How To
In this article, we will explore a practical example of using the zabbix_utils library to solve a non-trivial task – obtaining a list of alert recipients for triggers associated with a specific Zabbix host. You will learn how to easily automate the process of collecting this information, and see examples of real code that can […]
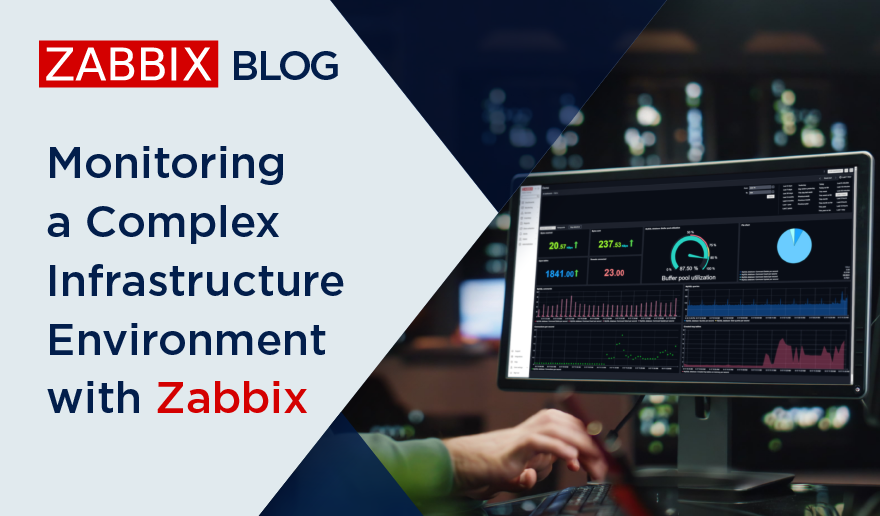
Monitoring a Complex Infrastructure Environment with Zabbix
October 30, 2024
Community
Inviting the members of our global community to share their Zabbix dashboards with us prompted a flood of fascinating responses, and we’re highlighting a few of the most interesting submissions here on our blog. This week’s entry comes to us from Nyein Chan Zaw, who is based in Bangkok, Thailand and works as an Infrastructure […]
Monitoring Failed Jobs in NetBackup with Zabbix
October 23, 2024
Community
Monitoring backup solutions can be an arduous task – especially since many backup tools don’t provide APIs and simply are not easy to work with. One such solution – NetBackup – provides its own set of challenges, but fortunately we have Zabbix, with its low-level discovery (LLD) features and the possibility to leverage user parameters […]
My Zabbix is down, now what? Restoring Zabbix functionality
September 18, 2024
Handy Tips
We’ve all been in a situation in which Zabbix was somehow unavailable. It can happen for a variety of reasons, and our goal is always to help you get everything back up and running as quickly as possible. In this blog post, we’ll show you what to do in the event of a Zabbix failure, […]


