Zabbix is an open-source monitoring tool designed to oversee multiple IT infrastructure components, including networks, servers, virtual machines, and cloud services. It operates using both agent-based and agentless monitoring methods. Agents can be installed on monitored devices to collect performance data and report back to a centralized Zabbix server.
Zabbix provides comprehensive integration capabilities for monitoring VMware environments, including ESXi hypervisors, vCenter servers, and virtual machines (VMs). This integration allows administrators to effectively track performance metrics and resource usage across their VMware infrastructure.
In this post, I will show you how to set up Zabbix monitoring with a VMware vSphere infrastructure.
Table of Contents
Requirements:
- Zabbix server
- Access to the VMware vCenter Server
Step one: Create a Zabbix service user in the vCenter
First things first, let’s create a service user on the vCenter that will be used by the Zabbix server to collect data. To make life easier, in my lab setup the user [email protected] will have full Administrator privileges. Read-only permissions should be enough, however.
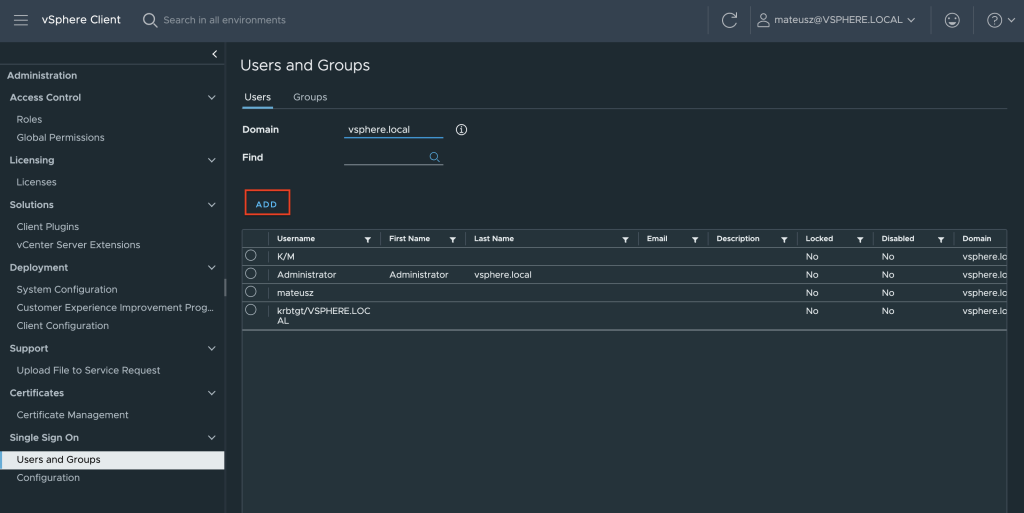
1. In the vSphere Client, choose Menu -> Administration -> Users and Groups. From the Users tab, select Domain vsphere.local, and click the ADD button to add a new user.
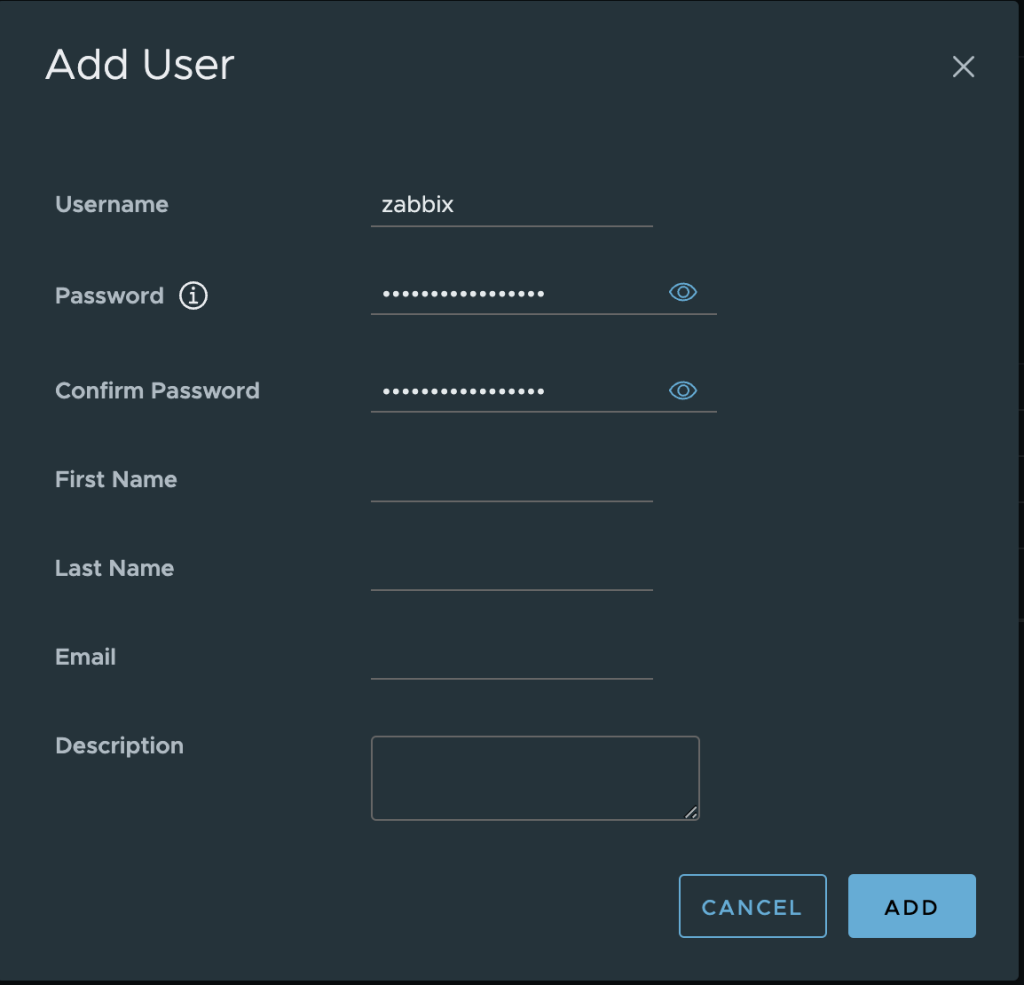
2. Type a username and password. Click ADD to create a new user.
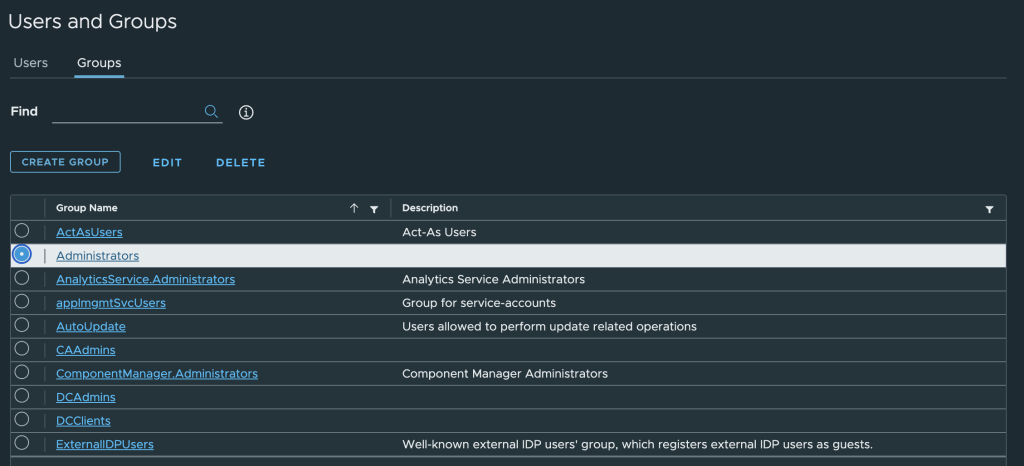
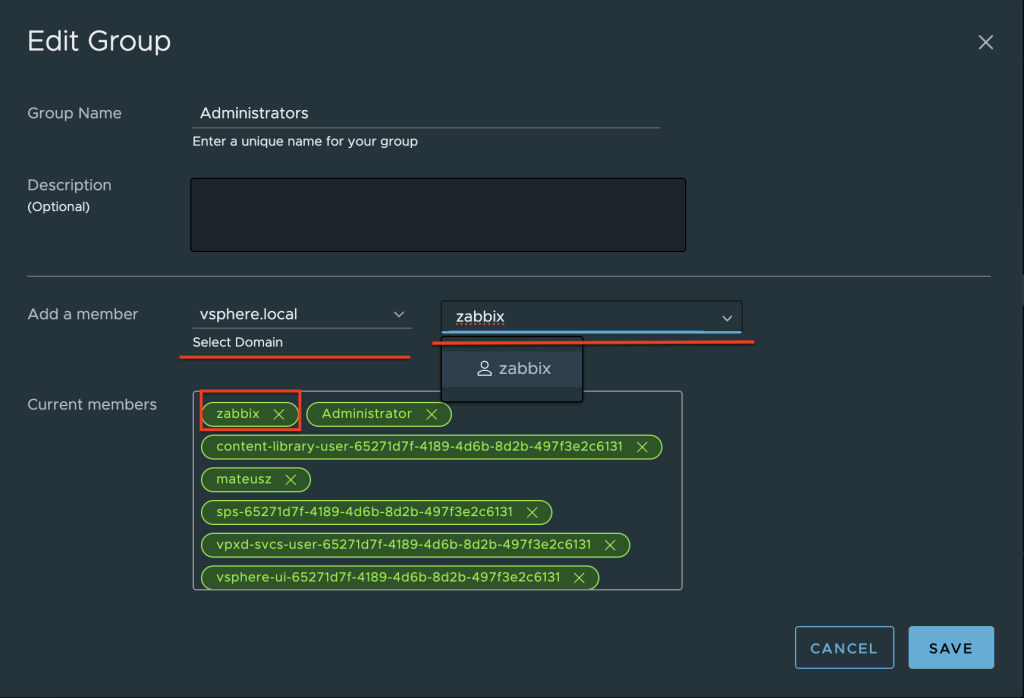
3. Change the tab to Groups and select the Administrators group.
4. Find a new user zabbix, click on it and save. The user is added to the Administrators group.
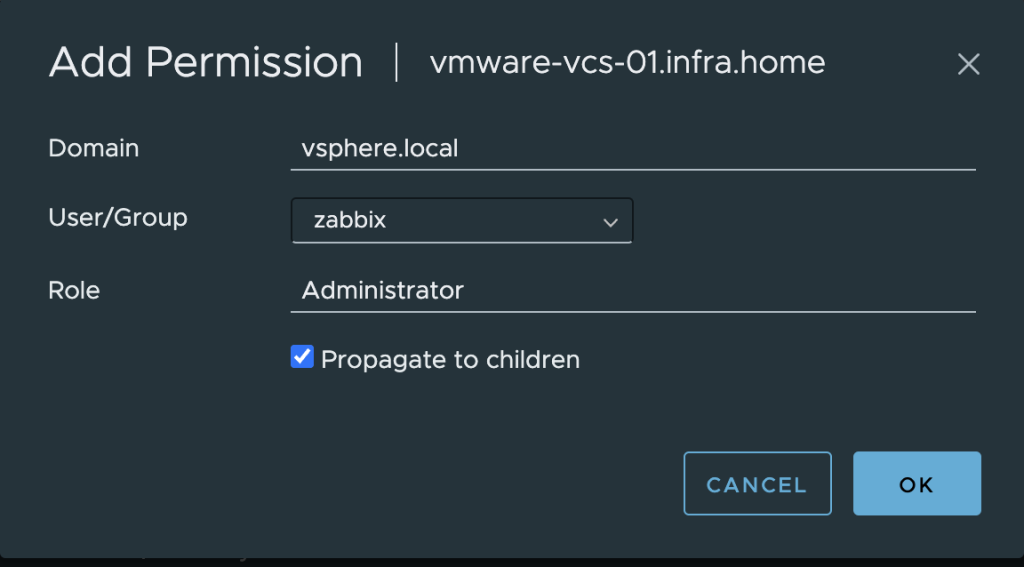
5. From the Host and Clusters view, choose vCenter name and go to the Permissions tab. Click the Add button.
6. Choose a proper domain (vsphere.local), find the user zabbix, set the role to Administrator, and check Propagate to children. Click OK to give those permissions.
Step two: Make changes on the Zabbix server
Next, we need to edit zabbix_server.conf. In this file we need to enable the vmware collector process. It’s necessary to start VMware monitoring. FYI, I have installed Zabbix server in version 7.0.4.
1. Edit a configuration file zabbix_server.conf
vim /etc/zabbix/zabbix_server.conf
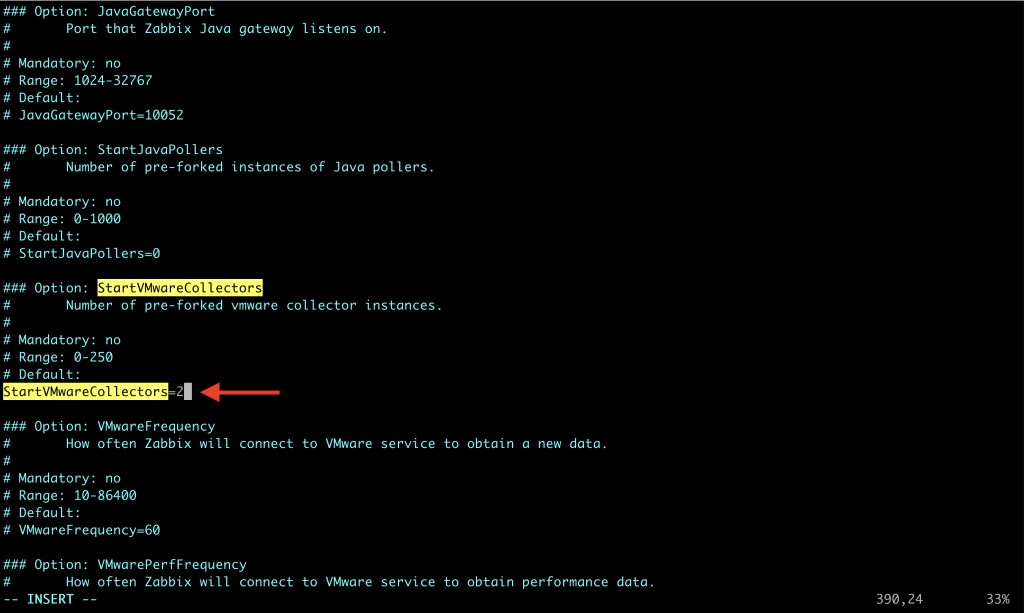
2. Find the StartVMwareCollectors parameter, delete “#” before it and change the value from 0 to at least 2. Save the file and exit.
Except for StartVMwareCollectors which is mandatory, it’s possible to enable and modify additional VMware parameters. You can find more details about them HERE.
VMwareCacheSize
VMwareFrequency
VMwarePerfFrequency
VMwareTimeout
3. Restart the zabbix-server service.
systemctl restart zabbix-server
Step three: Configure the VMware template on Zabbix
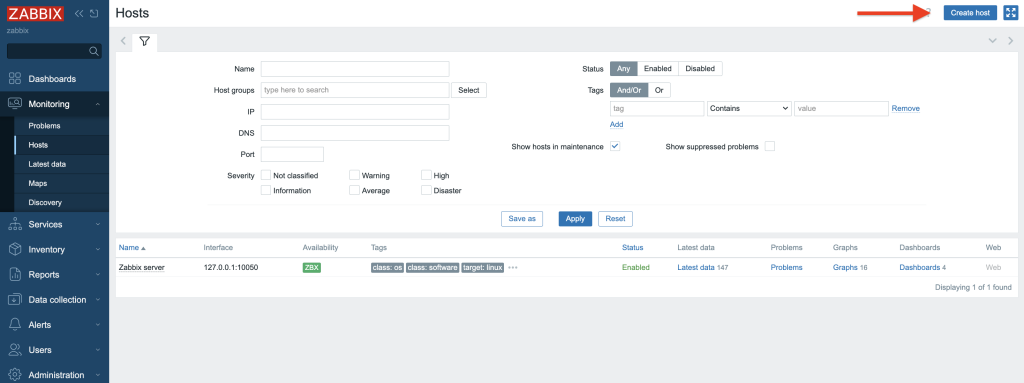
1.Log in to the Zabbix server via GUI – http://zabbix_server/zabbix. Go to the Hosts section under the Monitoring tab.
2. Create a new “Host.” Click Create Host in the right upper corner.
3. In the Host tab provide the following details:
Host name – type the name of the system that we want to monitor – here it is VMware Infrastructure.
Templates – type/find template name “VMware”, more info about VMware template you can find HERE.
Host groups – find/type “VMware(new)” host group.
At this point, go to the Macros tab.
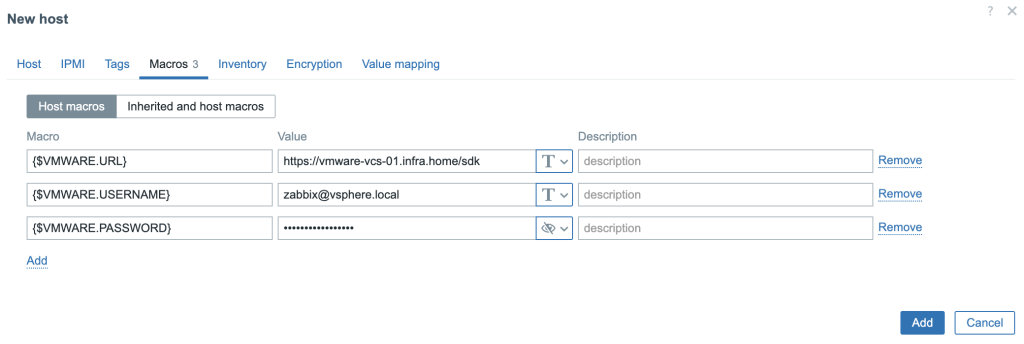
4. In the Macros tab you need to provide 3 values/macros. These macros describes data that is needed to connect Zabbix to the VMware vCenter:
{$VMWARE.URL} – VMware service (vCenter or ESXi hypervisor) SDK URL (https://servername/sdk) that we want to connect.
{$VMWARE.USERNAME} – VMware service username created in the 1 section.
{$VMWARE.PASSWORD} – VMware service user password created in the 1 section.
Click the Add button.
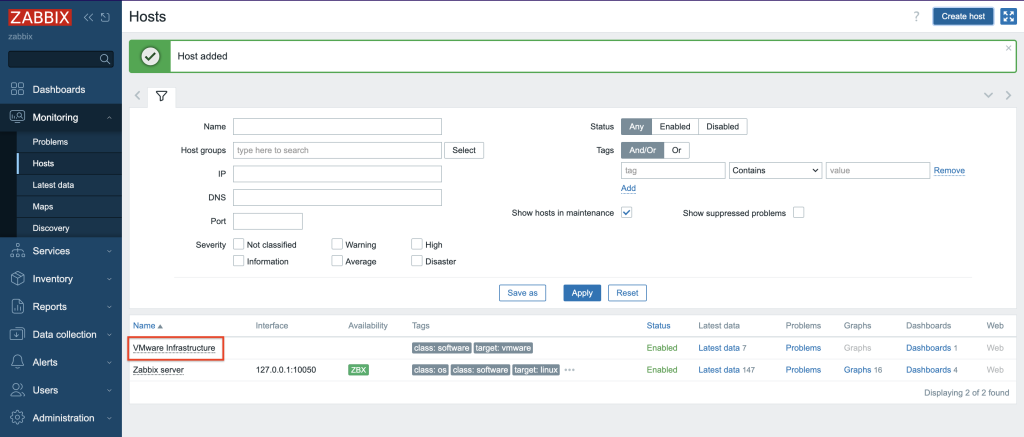
5. A new Host was created and data collection is in progress.
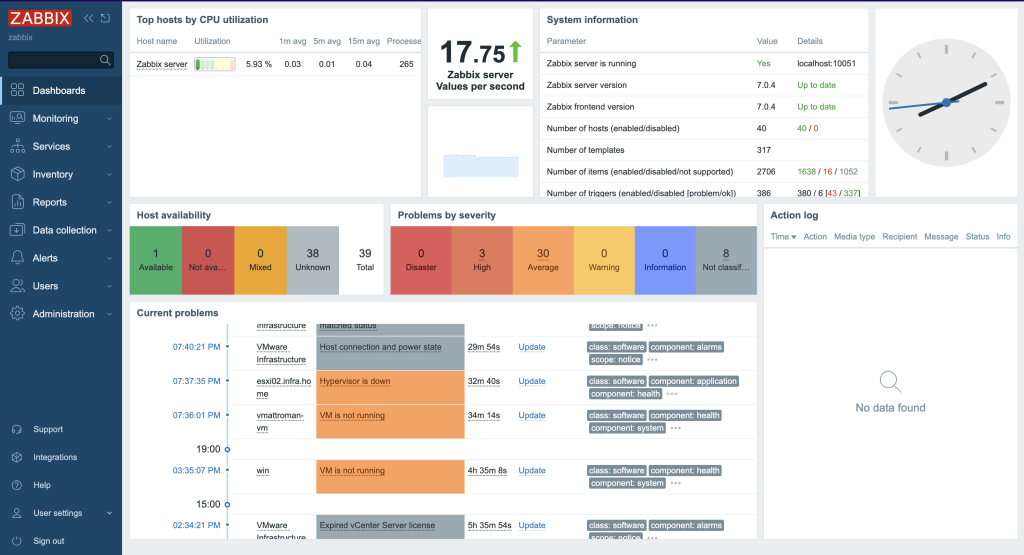
6. Depending on the size of the infrastructure, data collection takes different amounts of time. Once configured, Zabbix will automatically discover VMs and begin collecting performance data. You can find an overview of the latest data in the Dashboard screen.
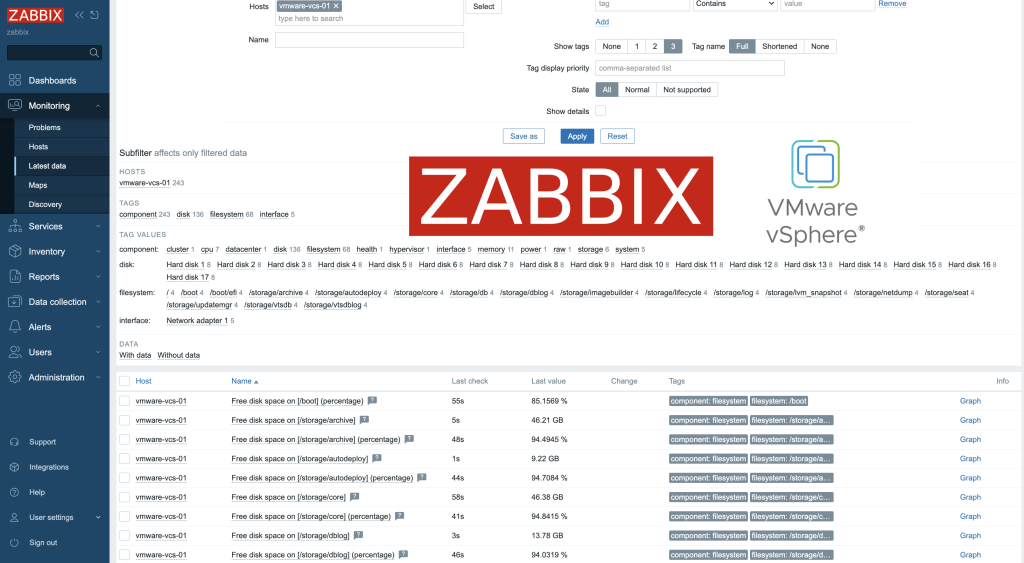
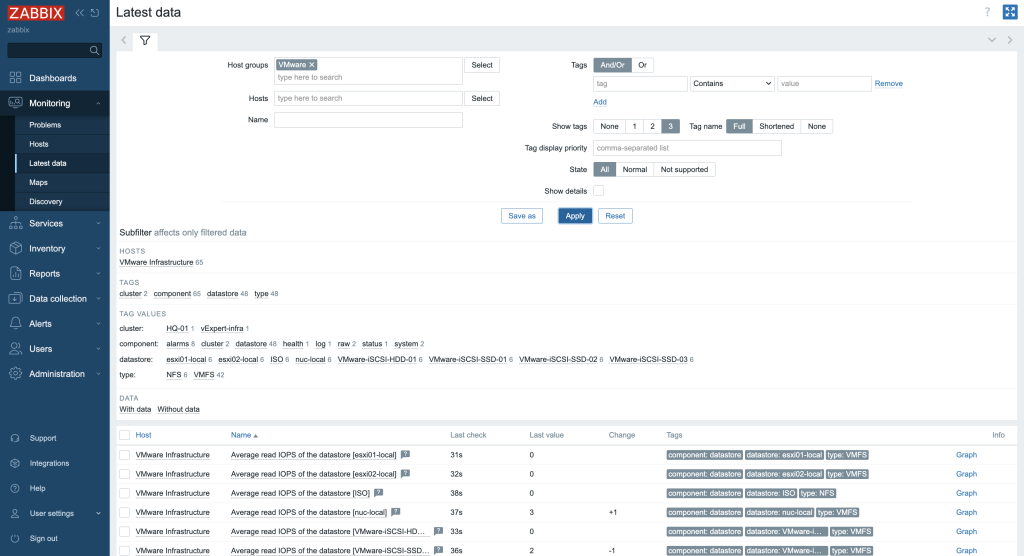
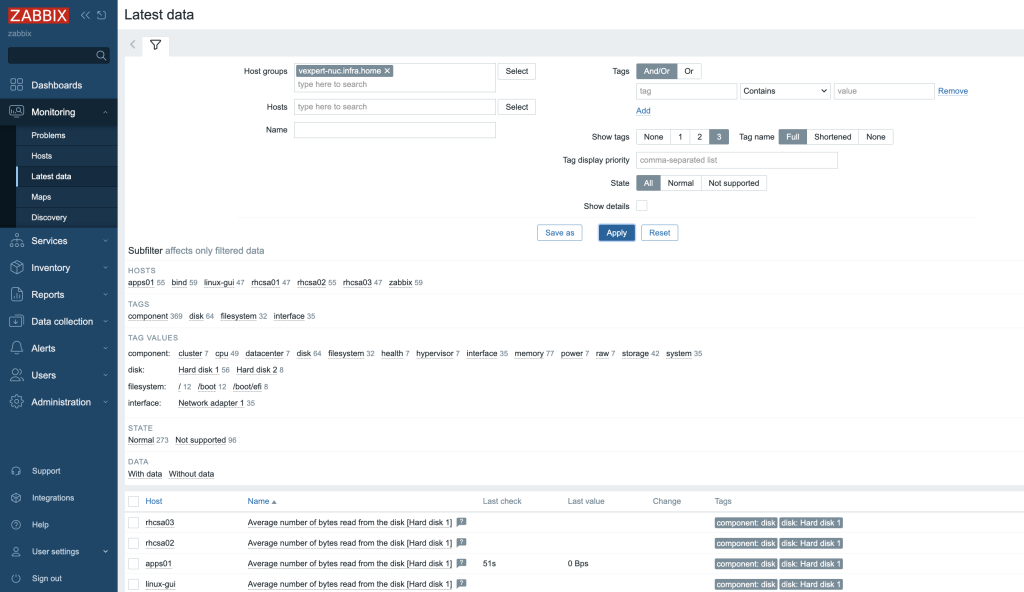
7. More specific and detailed data can be found in Latest data under the Monitoring tab.
In Host groups or Hosts choose the name of the item you are looking for (you can also click the “Select” button). Select the name of the ESXi host, the virtual machine, the vCenter name, the datastore, or all VMware information.
Zabbix can collect multiple metrics from VMware using its built-in templates. These metrics include:
– CPU usage
– Memory consumption
– Disk I/O statistics
– Network traffic
– Datastore capacity
In conclusion
Integrating Zabbix with VMware provides a robust solution for monitoring virtualized environments and enhancing visibility into system performance and resource utilization, while enabling timely alerts and responses to operational issues.









 Prev Post



It is possible to get a specific problem on a cluster or host (e.g. “CPU overloaded” or “RAM overloaded”) instead of the simple but small-minded “The Cluster\Host health is Yellow” and “The Cluster\Host health is Red”?