One of the features of Zabbix proxy is that it can buffer the collected monitoring data if connectivity to Zabbix server is lost. In this post I will show it happening, using packet capture, or packet analysis.
Table of Contents
Zabbix setup and capturing Zabbix proxy traffic
This is the setup in this demo:
- One Zabbix server in the central site (IPv6 address
2001:db8:1234::bebeand DNS namezabbixtest.lein.io) - One Zabbix proxy “Proxy-1” in a remote site (IPv6 address
2001:db8:9876::fafaand IPv4 address 10.0.41.65) - One Zabbix agent “Testhost” on a server in the remote site, sending data via the proxy
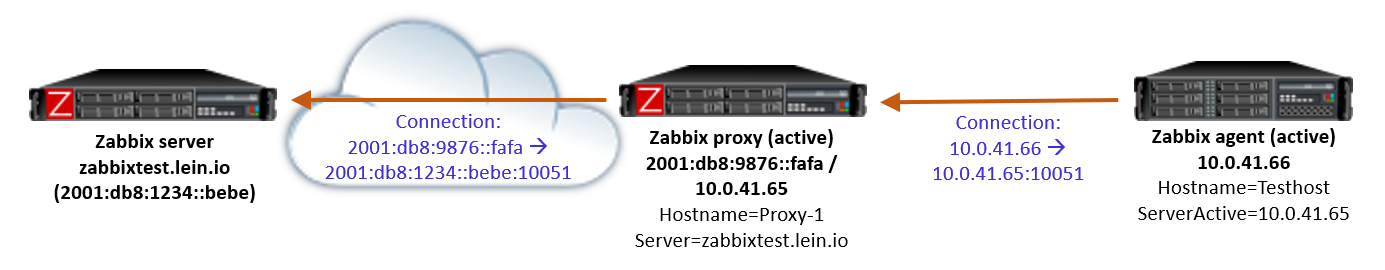
For simplicity, the agent only monitors one item: the system uptime (item key system.uptime using Zabbix active agent), with 20 seconds interval. So that’s the data that we are expecting to arrive to the server, every 20 seconds.
The proxy is an active proxy using SQLite database, with these non-default configurations in the configuration file:
Server=zabbixtest.lein.io
Hostname=Proxy-1
DBName=/var/lib/zabbix/zabbix_proxy
The proxy “Proxy-1” has also been added in Zabbix server using the frontend.
I’m using Zabbix server and proxy version 6.4.0beta5 here. Agents are normally compatible with newer servers and proxies, so I happened to use an existing agent that was version 4.0.44.
With this setup successfully running, I started packet capture on the Zabbix server, capturing only packets for the proxy communication:
sudo tcpdump host 2001:db8:9876::fafa -v -w proxybuffer.pcap
After having it running for a couple of minutes, I introduced a “network outage” by dropping the packets from the proxy in the server:
sudo ip6tables -A INPUT -s 2001:db8:9876::fafa -j DROP
I kept that drop rule in use for a few minutes and then deleted it with a suitable ip6tables command (sudo ip6tables -D INPUT 1 in this case), and stopped the capture some time after that.
Analyzing the captured Zabbix traffic with Wireshark
I downloaded the capture file (proxybuffer.pcap) to my workstation where I already had Wireshark installed. I also had the Zabbix dissector for Wireshark installed. Without this specific dissector the Zabbix packet contents are just unreadable binary data because the proxy communication is compressed since Zabbix version 4.0.
You can download the same capture file here if you want to follow along:
- proxybuffer.pcap (github.com)
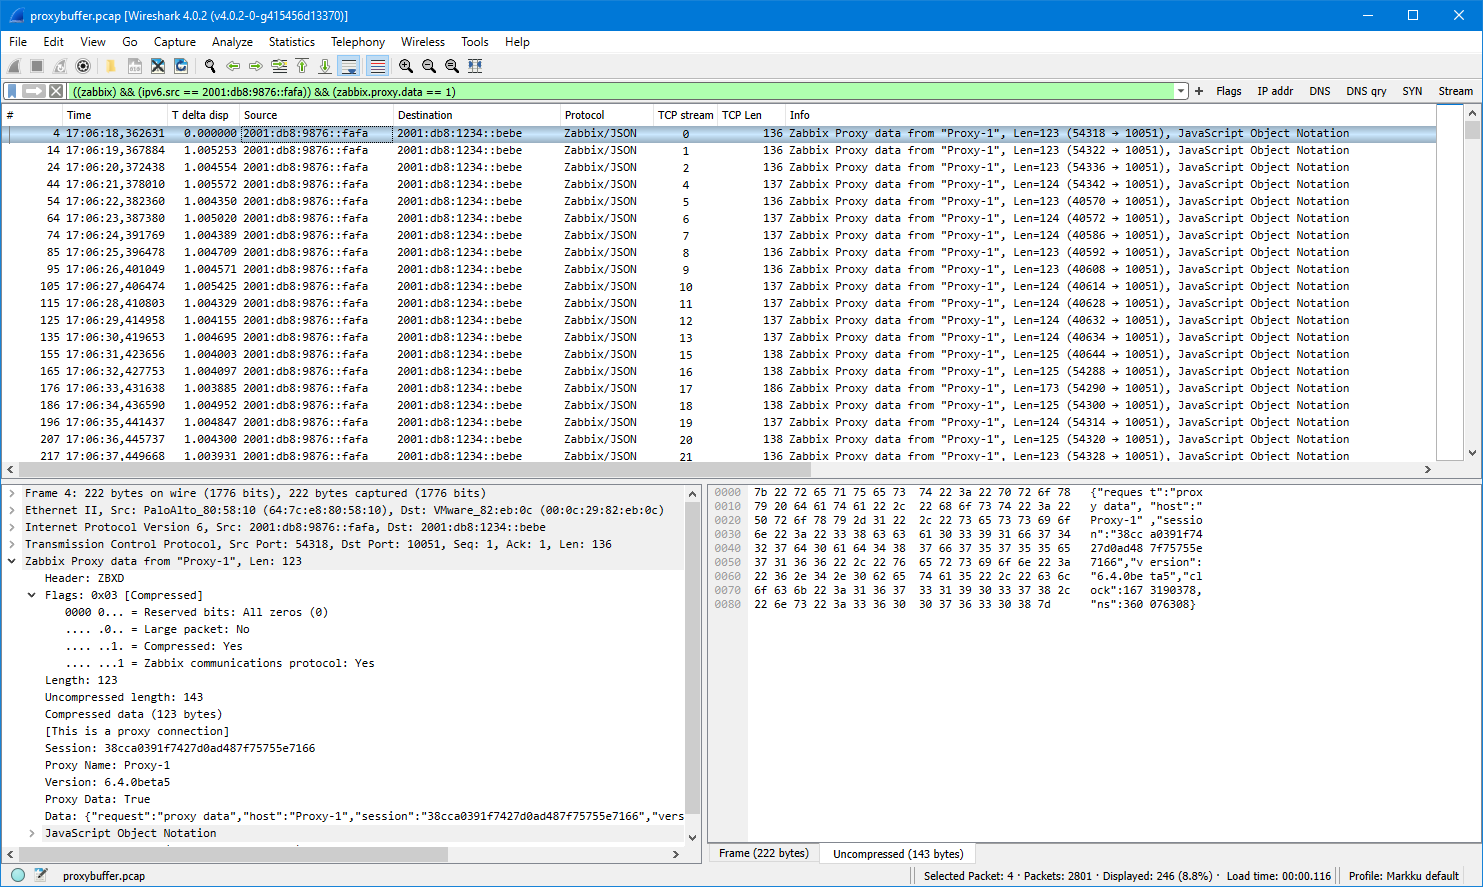
After opening the capture file in Wireshark I first entered zabbix in the display filter, expanded the Zabbix fields in the protocol tree a bit, and this is what I got:
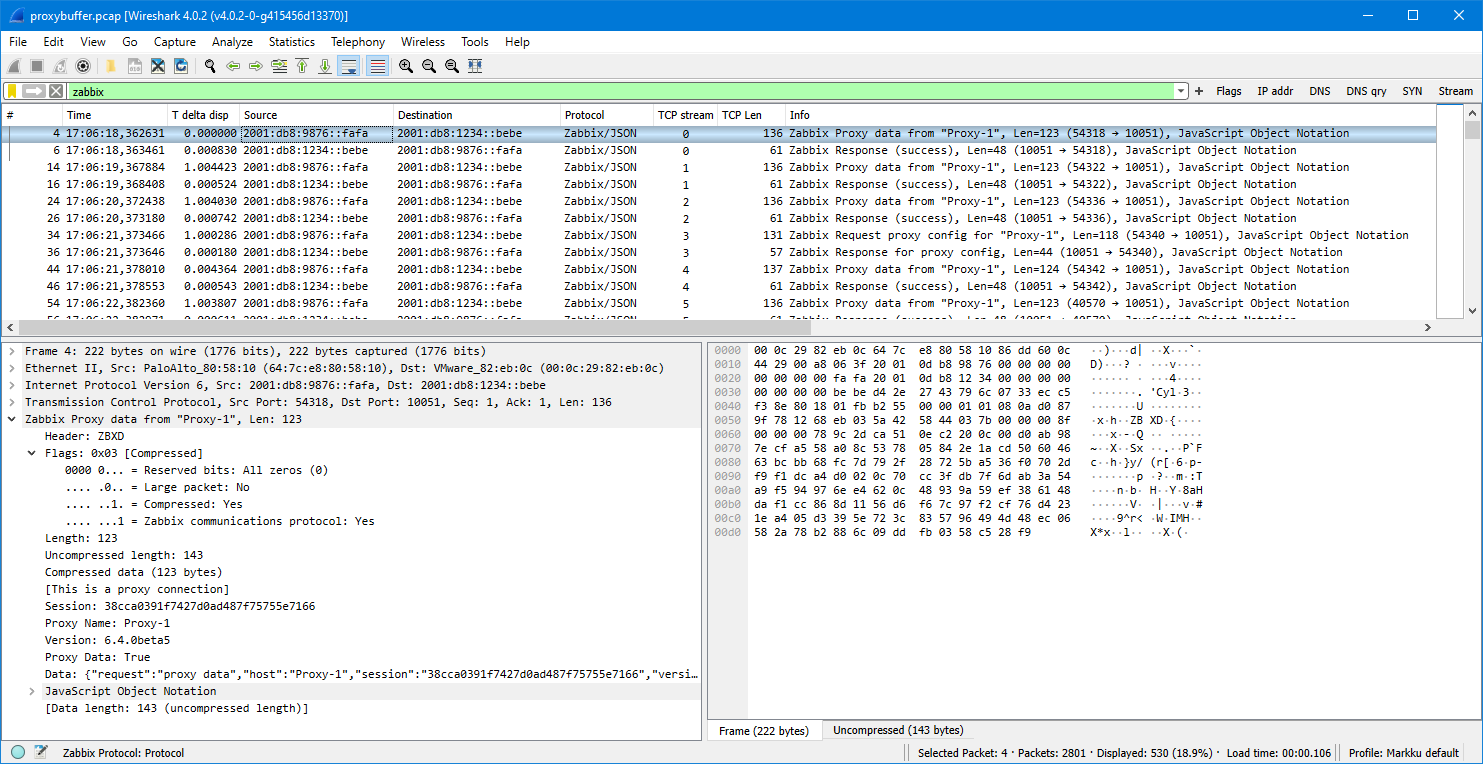
(Your Wireshark view will probably look different. If you are interested in changing it, see my post about customizing Wireshark settings.)
Since this is an active proxy communicating with the server, there is always first a packet from the proxy (config request or data to be sent) and then the response from the server.
Let’s look at the packets from the proxy only. We get that by adding the proxy source IP address in the filter (by typing it to the field as an ipv6.src filter, or by dragging the IP address from the Source column to the display filter like I did):
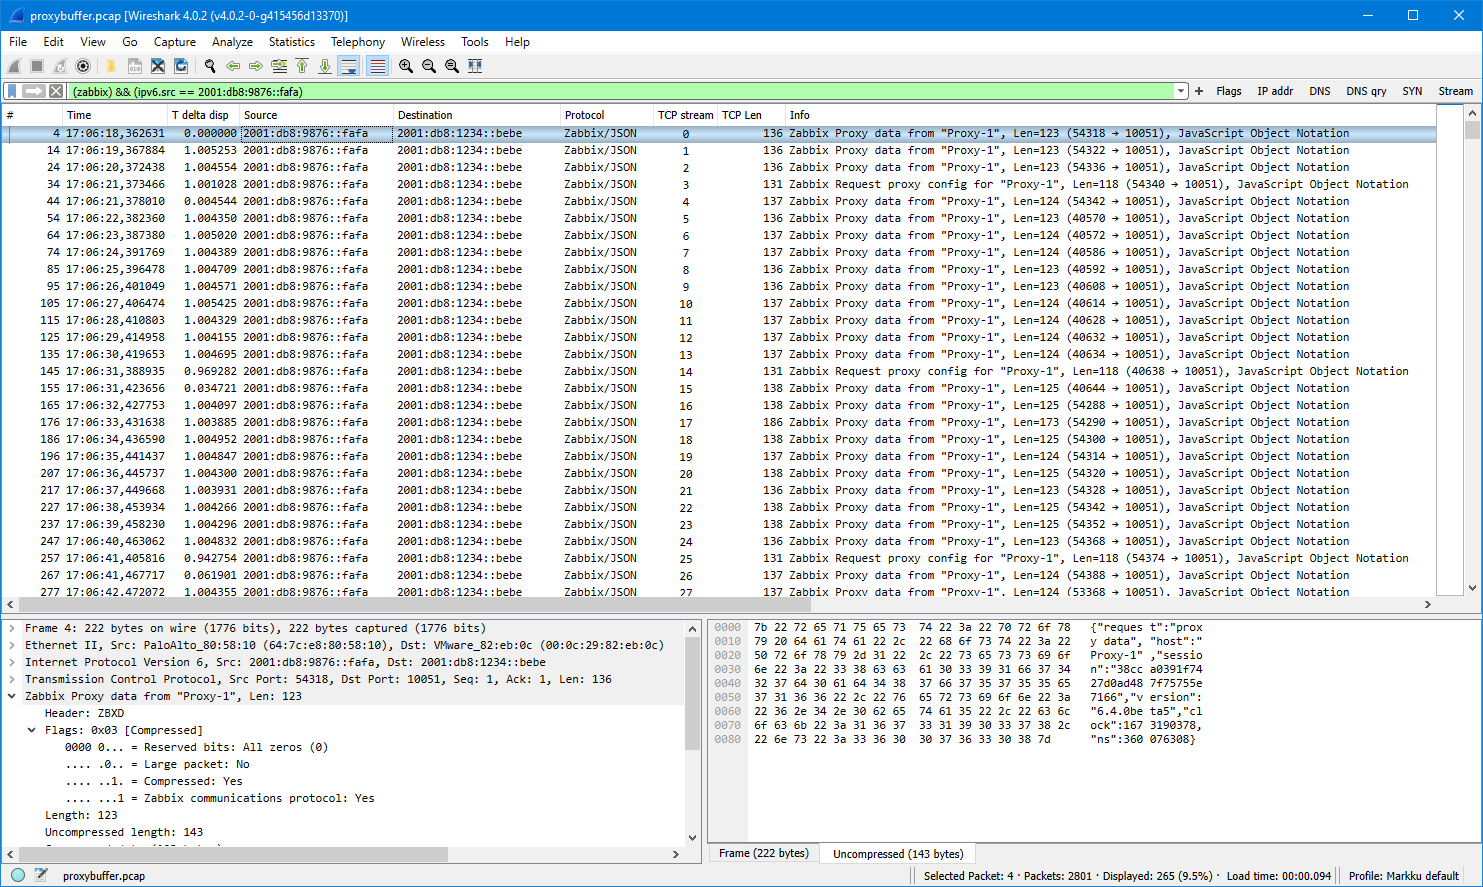
Basically there are two types of packets shown:
- Proxy data
- Request proxy config
The configuration requests are easier to explain: in Zabbix proxy 6.4 there is a configuration parameter ProxyConfigFrequency (in earlier Zabbix versions the same was called ConfigFrequency):
How often proxy retrieves configuration data from Zabbix server in seconds. Active proxy parameter. Ignored for passive proxies (see ProxyMode parameter). https://www.zabbix.com/documentation/current/en/manual/appendix/config/zabbix_proxy
It defaults to 10 seconds. What basically happens in each config request is that the proxy says “my current configuration revision is 1234”, and then the server responds to that.
Note: The configuration request concept has been changed in Zabbix 6.4 to use incremental configurations when possible, so the proxy is allowed to get the updated configuration much faster compared to earlier default of 3600 seconds or one hour in Zabbix 6.2 and earlier. See What’s new in Zabbix 6.4.0 for more information.
The other packet type shown above is the proxy data packet. It is actually also used for other than data. In proxy configuration there is a parameter DataSenderFrequency:
Proxy will send collected data to the server every N seconds. Note that active proxy will still poll Zabbix server every second for remote command tasks. Active proxy parameter. Ignored for passive proxies (see ProxyMode parameter). https://www.zabbix.com/documentation/current/en/manual/appendix/config/zabbix_proxy
The default value for it is one second. But as mentioned in the quote above, even if you increase the configuration value (= actually decrease the frequency… but it is what it is), the proxy will connect to the server every second anyway.
Note: There is a feature request ZBXNEXT-4998 about making the task update interval configurable. Vote and watch that issue if you are interested in that for example for battery-powered Zabbix use cases.
The first packet shown above is (JSON reformatted for better readability):
{
    "request": "proxy data",
    "host": "Proxy-1",
    "session": "38cca0391f7427d0ad487f75755e7166",
    "version": "6.4.0beta5",
    "clock": 1673190378,
    "ns": 360076308
}
There is no “data” in the packet, that’s just the proxy basically saying “hey I’m still here!” to the server so that the server has an opportunity to talk back to the proxy if it has something to say, like a remote command to run on the proxy or on any hosts monitored by the proxy.
As mentioned earlier, the test setup consisted of only one collected item, and that is being collected every 20 seconds, so it is natural that not all data packets contain monitoring data.
I’m further filtering the packets to show only the proxy data packets by adding zabbix.proxy.data in the display filter (by dragging the “Proxy Data: True” field to the filter):
(Yes yes, the topic of this post is data buffering in Zabbix proxy, and we are getting there soon)
Now, there is about 20 seconds worth of packets shown, so we should have one actual data packet there, and there it is, the packet number 176: it is about 50 bytes larger than other packets so there must be something. Here is the Data field contents of that packet:
{
    "request": "proxy data",
    "host": "Proxy-1",
    "session": "38cca0391f7427d0ad487f75755e7166",
    "history data": [
        {
            "id": 31,
            "itemid": 44592,
            "clock": 1673190392,
            "ns": 299338333,
            "value": "1686"
        }
    ],
    "version": "6.4.0beta5",
    "clock": 1673190393,
    "ns": 429562969
}
In addition to the earlier fields there is now a list called history data containing one object. That object has fields like itemid and value. The itemid field has the actual item ID for the monitored item, it can be seen in the URL address in the browser when editing the item in Zabbix frontend. The value 1686 is the actual value of the monitored item (the system uptime in seconds, the host was rebooted about 28 minutes ago).
Let’s develop the display filter even more. Now that we are quite confident that packets that have TCP length of about 136-138 bytes are just the empty data packets without item data, we can get the interesting data packets by adding tcp.len > 140 in the display filter:
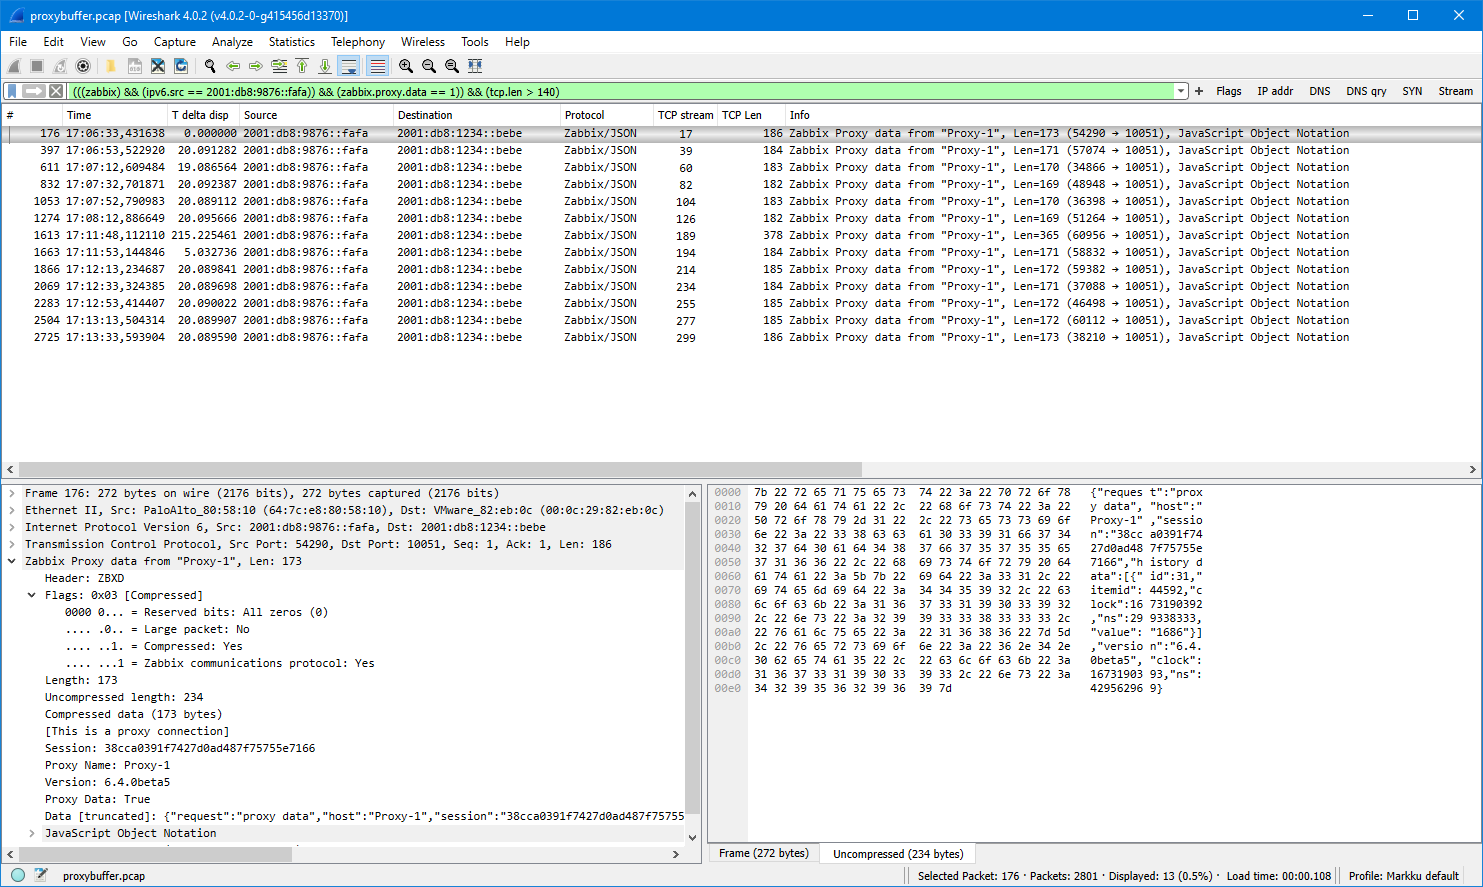
When looking at the packet timestamps there is the 20-second interval observed until about 17:08:30. Then there is about 3.5 minutes gap, next send at 17:11:53, and then the data was flowing again with the 20-second interval. The 3.5 minutes gap corresponds to the network outage that was manually caused in the test. The data packet immediately after the outage is larger than others, so let’s see that:
{
    "request": "proxy data",
    "host": "Proxy-1",
    "session": "38cca0391f7427d0ad487f75755e7166",
    "history data": [
        {
            "id": 37,
            "itemid": 44592,
            "clock": 1673190512,
            "ns": 316923947,
            "value": "1806"
        },
        {
            "id": 38,
            "itemid": 44592,
            "clock": 1673190532,
            "ns": 319597379,
            "value": "1826"
        },
--- JSON truncated ---
        {
            "id": 45,
            "itemid": 44592,
            "clock": 1673190672,
            "ns": 345132325,
            "value": "1966"
        },
        {
            "id": 46,
            "itemid": 44592,
            "clock": 1673190692,
            "ns": 348345312,
            "value": "1986"
        }
    ],
    "auto registration": [
        {
            "clock": 1673190592,
            "host": "Testhost",
            "ip": "10.0.41.66",
            "port": "10050",
            "tls_accepted": 1
        }
    ],
    "version": "6.4.0beta5",
    "clock": 1673190708,
    "ns": 108126335
}
What we see here is that there are several history data objects in the same data packet from the proxy. The itemid field is still the same as earlier (44592), and the value field is increasing in 20-second steps. Also the timestamps (clock and nanoseconds) are increasing correspondingly, so we see when the values were actually collected, even though they were sent to the server only a few minutes later, having been buffered by the proxy.
That is also confirmed by looking at the Latest data graph in Zabbix frontend for that item during the time of the test:
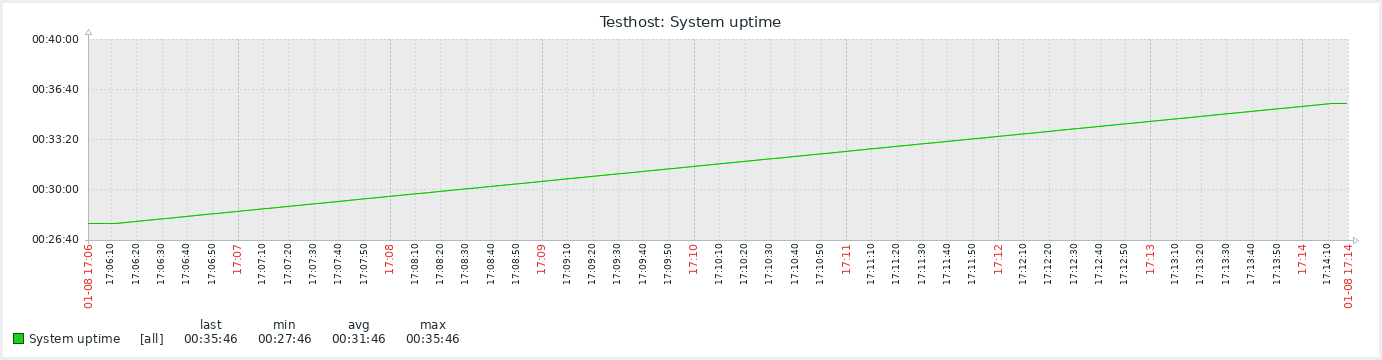
There is a nice increasing graph with no gaps or jagged edges.
By the way, this is how the outage looked like in the Zabbix proxy log (/var/log/zabbix/zabbix_proxy.log on the proxy):
   738:20230108:170835.557 Unable to connect to [zabbixtest.lein.io]:10051 [cannot connect to [[zabbixtest.lein.io]:10051]: [4] Interrupted system call]
   738:20230108:170835.558 Will try to reconnect every 120 second(s)
   748:20230108:170835.970 Unable to connect to [zabbixtest.lein.io]:10051 [cannot connect to [[zabbixtest.lein.io]:10051]: [4] Interrupted system call]
   748:20230108:170835.970 Will try to reconnect every 1 second(s)
   748:20230108:170939.993 Still unable to connect...
   748:20230108:171040.015 Still unable to connect...
   738:20230108:171043.561 Still unable to connect...
   748:20230108:171140.068 Still unable to connect...
   748:20230108:171147.105 Connection restored.
   738:20230108:171243.563 Connection restored.
The log looks confusing at first because it shows the messages twice. Also, the second “Connection restored” message arrived almost one minute after the data sending was already restored, as proved in the packet list earlier. The explanation is (as far as I understand it) that the configuration syncer and data sender are separate processes in the proxy, as described in https://www.zabbix.com/documentation/current/en/manual/concepts/proxy#proxy-process-types. When looking at the packets we see that at 17:12:43 (when the second “Connection restored” message arrived) the proxy sent a proxy config request to the server, so apparently the data sender tries to reconnect every second (to facilitate fast recovery for monitoring data), while the config syncer only tries every two minutes (based on the “Will try to reconnect every 120 second(s)” message, and that corresponds to the outage start time 17:08:35 plus 2 x 2 minutes, plus some extra seconds, presumably because of TCP timeouts).
There were no messages on the Zabbix server log (/var/log/zabbix/zabbix_server.log) for this outage as the outage did not happen in the middle of the TCP session and the proxy was in active mode (= connections are always initiated by the proxy, not by the server), so there was nothing special to log in the Zabbix server process log.
Configurations for the proxy data buffering
In the configuration file for Zabbix proxy 6.4 there are two configuration parameters that control the buffering: ProxyLocalBuffer
Proxy will keep data locally for N hours, even if the data have already been synced with the server. This parameter may be used if local data will be used by third-party applications. (Default = 0) https://www.zabbix.com/documentation/current/en/manual/appendix/config/zabbix_proxy
ProxyOfflineBuffer
Proxy will keep data for N hours in case of no connectivity with Zabbix server. Older data will be lost. (Default = 1) https://www.zabbix.com/documentation/current/en/manual/appendix/config/zabbix_proxy
The ProxyOfflineBuffer parameter is the important one. If you need to tolerate longer outages than one hour between the proxy and the Zabbix server (and you have enough disk storage on the proxy), you can increase the value. There is no separate filename or path to configure because proxy uses the dedicated database (configured when installed the proxy) for storing the buffered data.
The ProxyLocalBuffer parameter is uninteresting for most (and disabled by default) because that’s only useful if you plan to fetch the collected data directly from the proxy database into some other external application, and you need to have some flexibility for scheduling the data retrievals from the database.
This post was originally published on the author’s blog.