


Have you ever wanted a button to export specific data to CSV directly from Zabbix frontend? My friend Gregory and I have solved this problem.
In this blog post, I will show you how with the help of a custom Zabbix frontend module, you can add an “Export to CSV” button and use it to export custom information. This can be installed as a frontend module. Requirement is to have PHP 7.2 or newer. It’s applicable for versions Zabbix 5.0 LTS, 6.0 LTS or 7.0 LTS. As an additional benefit, we can use this module to polish our Zabbix instance, find misconfiguration, summarize existing configuration and locate potential bottlenecks.
Table of Contents
Characteristics of the module
- Define and store custom SQL queries in the user profile. It uses the “profiles” database table, specifically the columns “idx” and “value_str” to store the settings/data. We are not changing the database structure but using what’s available already.
- Export an unlimited amount of rows via the CSV button.
- Compatible with MySQL and PostgreSQL and general SQL syntax. Use the same language as you use directly in the SQL client.
- SQL highlighter. It’s based on a well-known CodeMirror product. The Zabbix module is still completely standalone.
- Hyperlink support in the SQL output. Useful to generate a link used to navigate closer to the problem. Only hyperlinks which are related to zabbix sections (items.php, triggers.php) are supported.
What is it NOT?
- The module does not provide an environment for “Zabbix User” or “Zabbix Admin” types of users to perform any reporting. Only users of “Zabbix Super Admin” type can use this module.
Install
Below you can find a sequence of commands used to download and install the “Export to CSV” module
Navigate to default directory of frontend modules:
cd /usr/share/zabbix/modules
Pick and create a name of directory:
mkdir -p zabbix-module-sqlexplorer
Navigate inside:
cd zabbix-module-sqlexplorer
For Zabbix 7.0:
wget https://github.com/gr8b/zabbix-module-sqlexplorer/releases/download/v1.12/v1.12-zabbix-6.4-7.0.zip
For Zabbix 5.0/6.0:
wget https://github.com/gr8b/zabbix-module-sqlexplorer/releases/download/v1.10/v1.10-zabbix-5.0-6.2.zip
Extract the archive:
unzip *.zip
Remove the original source file, it is unnecessary:
rm *.zip
Compatibility with minor versions is not guaranteed. The last tested and working versions are:
* v1.12 (Zabbix 7.0.9)
* v1.10 (Zabbix 6.0.25)
* v1.10 (Zabbix 5.0.40)
Enable
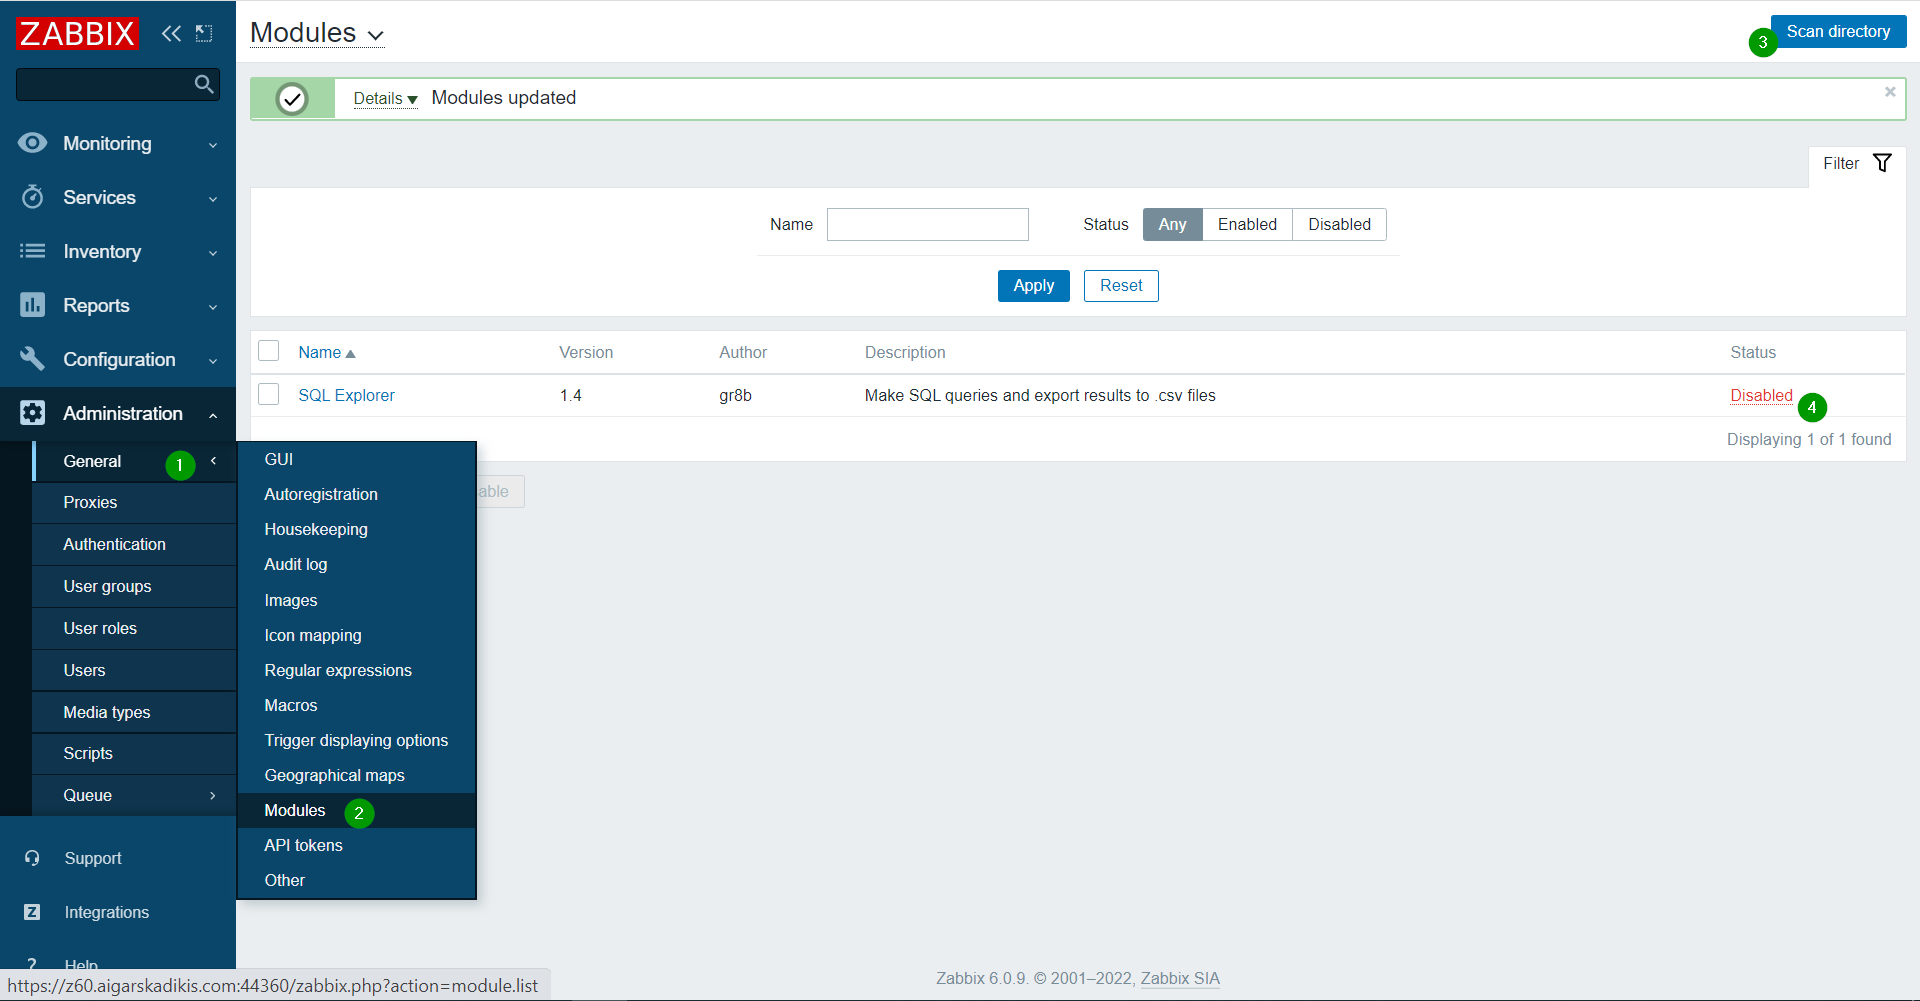
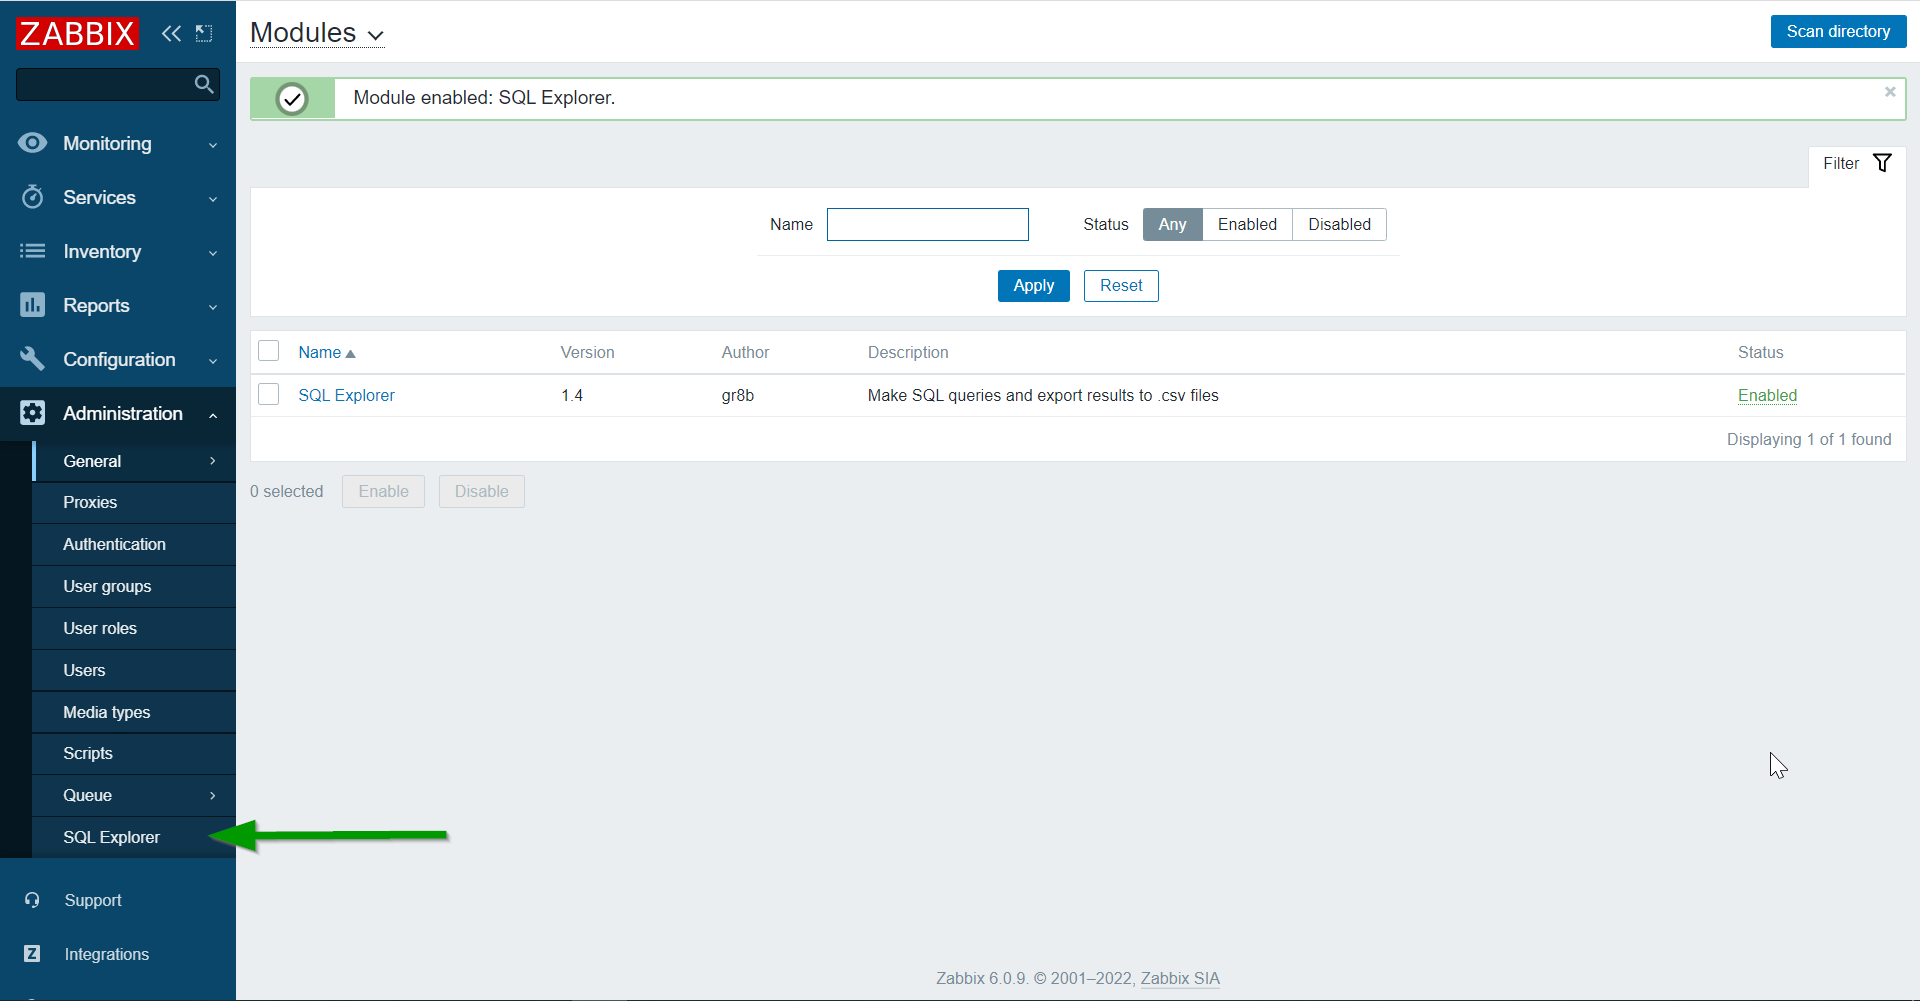
Open “Administration” => “General” => “Modules” => click on “Scan directory“. After that, click “Enable“:
A new menu is available:
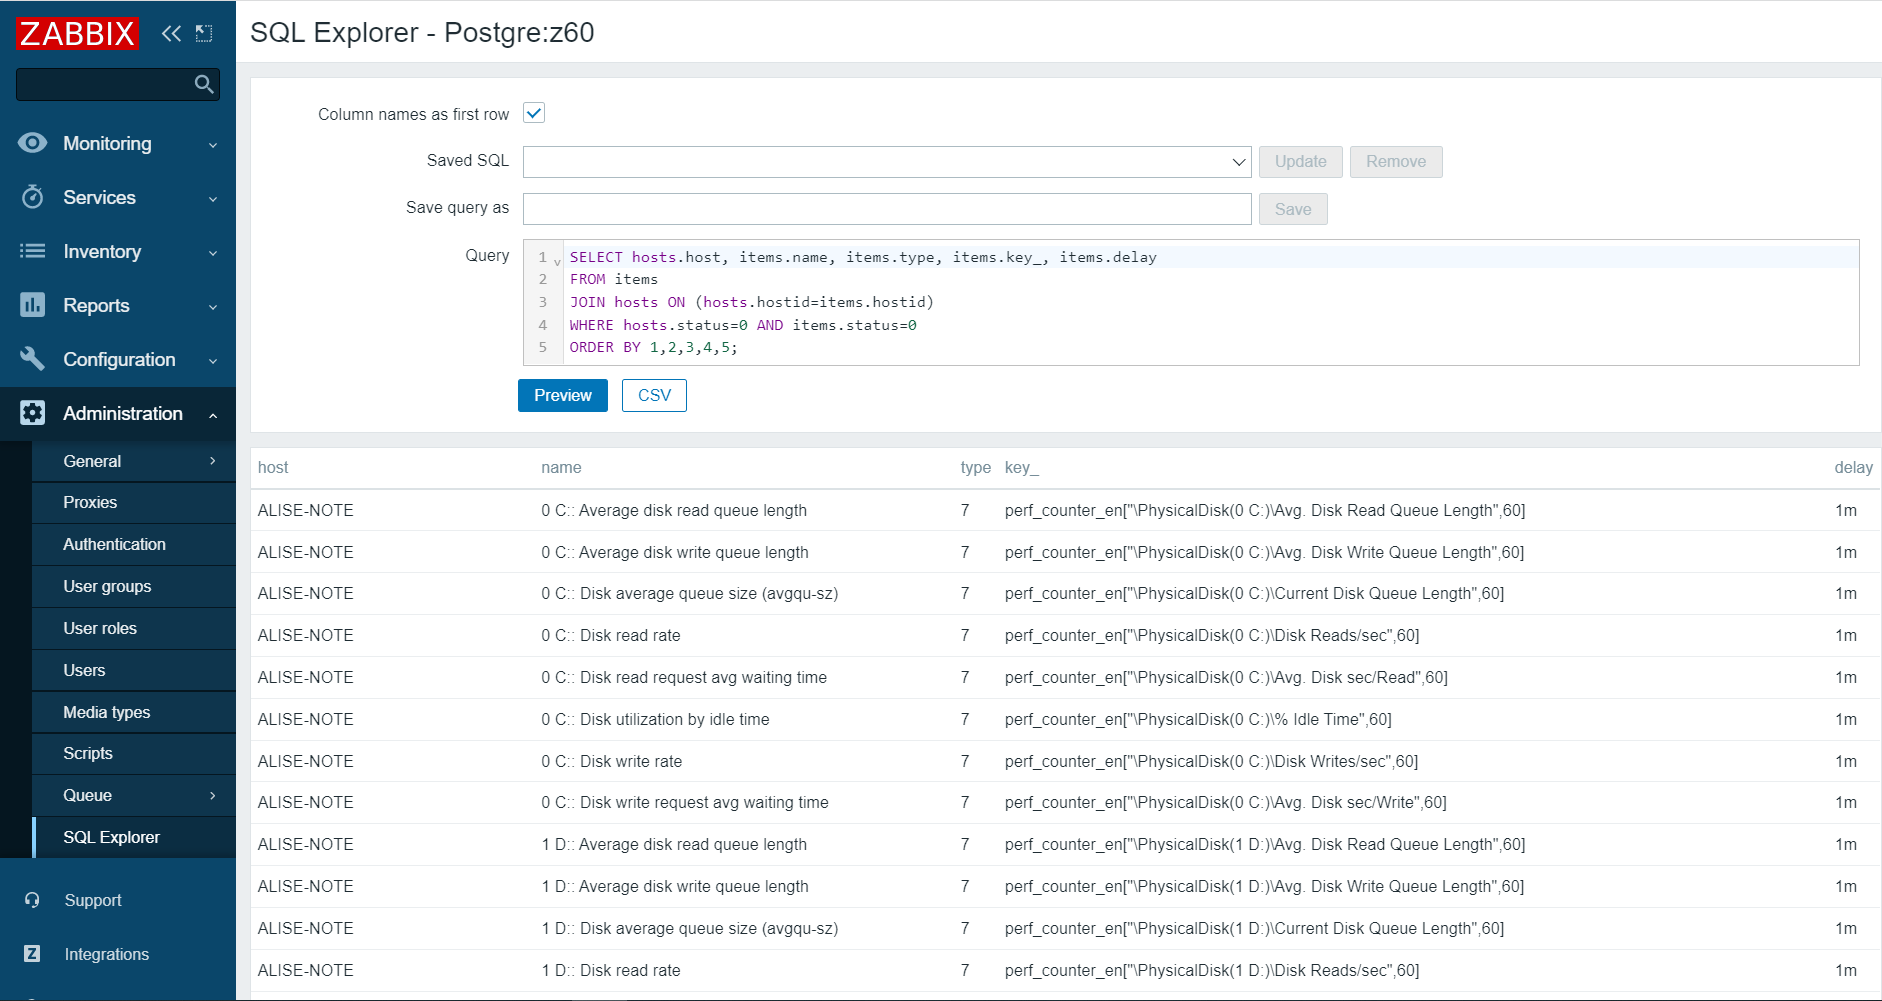
Now we can run an SQL query, see the result on the screen, and export the data to CSV:
Let’s talk about 5 beneficial use cases that this module can enable. Here Zabbix technical support engineers are sharing a few frequently used SQL commands.
1) Ensure the basic data collection works
This section would be the basic minimum to maintain. In a perfect world, every host object (a device, a server) must be online 24/7. For each category (ZBX, SNMP, IPMI, JMX) we need to use a dedicated query. Let’s work with the 2 most popular categories – ZBX and SNMP.
Unreachable Zabbix agent (ZBX) hosts
Zabbix 5.0:
SELECT proxy.host AS proxy, hosts.host, hosts.error AS hostError, CONCAT('hosts.php?form=update&hostid=',hosts.hostid) AS goTo FROM hosts LEFT JOIN hosts proxy ON (hosts.proxy_hostid=proxy.hostid) WHERE hosts.status=0 AND LENGTH(hosts.error) > 0;
Zabbix 6.0:
SELECT proxy.host AS proxy, hosts.host, interface.error FROM hosts LEFT JOIN hosts proxy ON (hosts.proxy_hostid=proxy.hostid) JOIN interface ON (interface.hostid=hosts.hostid) WHERE LENGTH(interface.error) > 0 AND interface.type=1;
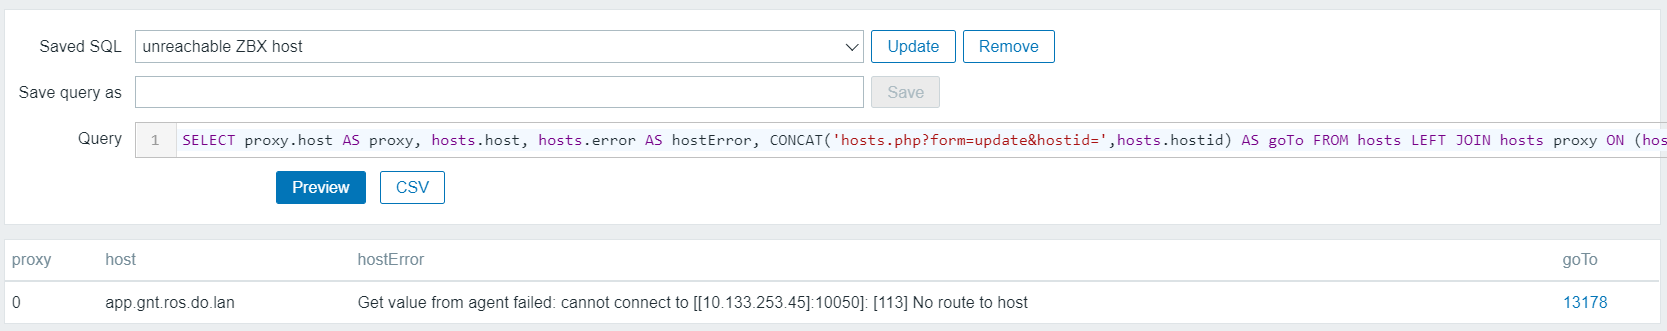
In the output, we receive a proxy object, host title, an error message, a clickable link to navigate immediately to the object.
Per every row in output, either we need to: 1) Fix the issue. Most likely it is a firewall/DNS/credential/timeout or network quality issue; 2) Delete host object; or 3) Disable host object.
Unreachable network (SNMP) devices
On Zabbix 5.0 use:
SELECT proxy.host AS proxy, hosts.host, hosts.snmp_error AS hostError, CONCAT('hosts.php?form=update&hostid=',hosts.hostid) AS goTo FROM hosts LEFT JOIN hosts proxy ON (hosts.proxy_hostid=proxy.hostid) WHERE hosts.status=0 AND LENGTH(hosts.snmp_error) > 0;
On Zabbix 6.0 use:
SELECT proxy.host AS proxy, hosts.host, interface.error, CONCAT('zabbix.php?action=host.edit&hostid=',hosts.hostid) AS goTo FROM hosts LEFT JOIN hosts proxy ON (hosts.proxy_hostid=proxy.hostid) JOIN interface ON (interface.hostid=hosts.hostid) WHERE LENGTH(interface.error) > 0 AND interface.type=2;
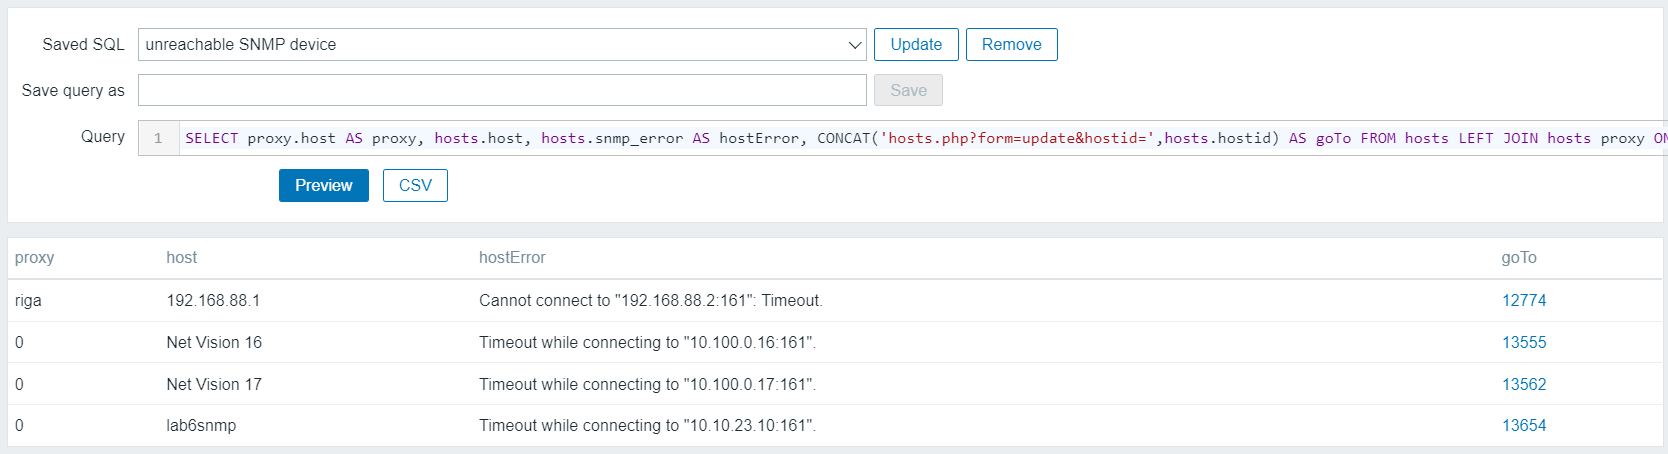
We receive the proxy title, host object, reason the host is not working and a clickable link to the object.
2) Improve speed of frontend
Ensure we have the best response time for all sections in GUI. If tables contain “unnecessary” data, the user experience will suffer for it. Nowadays, no one wants to spend longer than a few seconds waiting for data to be displayed on the screen.
Amount of user sessions
Zabbix 5.0:
SELECT COUNT(*) AS count, users.alias FROM sessions JOIN users ON (users.userid=sessions.userid) GROUP BY 2 ORDER BY 1 DESC;
Zabbix 6.0:
SELECT COUNT(*) AS count, users.username FROM sessions JOIN users ON (users.userid=sessions.userid) GROUP BY 2 ORDER BY 1 DESC;
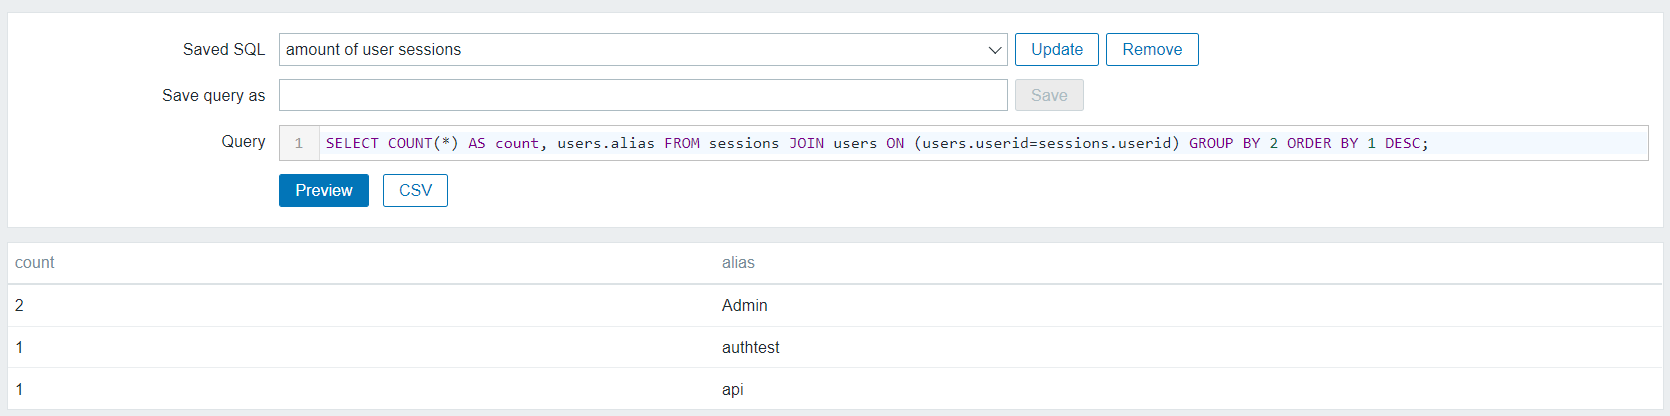
The total number of sessions should not exceed 1000; it’s hard to imagine why it should be over 100. It is OK to delete all data in the “sessions” table and optimize/vacuum the table. This will improve the overall Zabbix GUI responsiveness and performance.
Don’t keep too many open problems onboard
Every monitoring tool is about identifying problems. If you keep too many open problems, then frontend will be slow. The following query will print trigger problems (the ones we receive in email) and so as internal problems, which reflect the health of the monitoring tool.
SELECT COUNT(*) AS count, CASE WHEN source=0 THEN 'surface' WHEN source>0 THEN 'internal' END AS level, CASE WHEN source=0 AND object=0 THEN 'trigger in a problem state' WHEN source=3 AND object=0 THEN 'cannot evaluate trigger expression' WHEN source=3 AND object=4 THEN 'data collection not working' WHEN source=3 AND object=5 THEN 'low level discovery not perfect' END AS problemCategory FROM problem GROUP BY 2,3 ORDER BY 2 DESC;
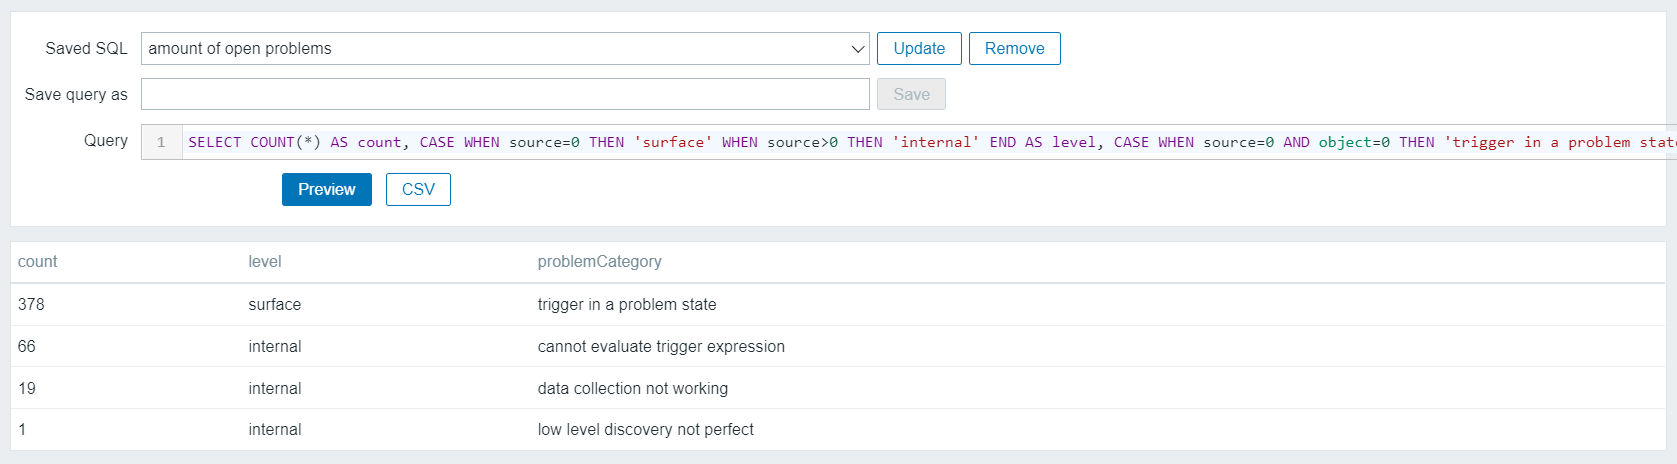
To decrease the number of “internal” problems, have a study on the point nr. 5 in this blog post.
3) Identify exceptions
Monitoring administrators can change item update frequency at a host level, can install a different trigger threshold at the host level, or install a different threshold inside a nested template tree. This section will highlight all overrides.
Item update interval differs between host/template levels
This query will print items and LLD rules with different update frequencies on the host level while comparing them with the template level. Most of the time, having different update interval at the host level is done by accident.
SELECT h2.host AS Source, i2.name AS itemName, i2.key_ AS itemKey, i2.delay AS OriginalUpdateFrequency,h1.host AS exceptionInstalledOn, i1.delay AS FrequencyChild, CASE WHEN i1.flags=1 THEN 'LLD rule' WHEN i1.flags IN (0,4) THEN 'data collection' END AS itemCategory , CASE WHEN i1.flags=1 THEN CONCAT('host_discovery.php?form=update&context=host&itemid=',i1.itemid) WHEN i1.flags IN (0,4) THEN CONCAT('items.php?form=update&context=host&hostid=',h1.hostid,'&itemid=',i1.itemid) END AS goTo FROM items i1 JOIN items i2 ON (i2.itemid=i1.templateid) JOIN hosts h1 ON (h1.hostid=i1.hostid) JOIN hosts h2 ON (h2.hostid=i2.hostid) WHERE i1.delay <> i2.delay;
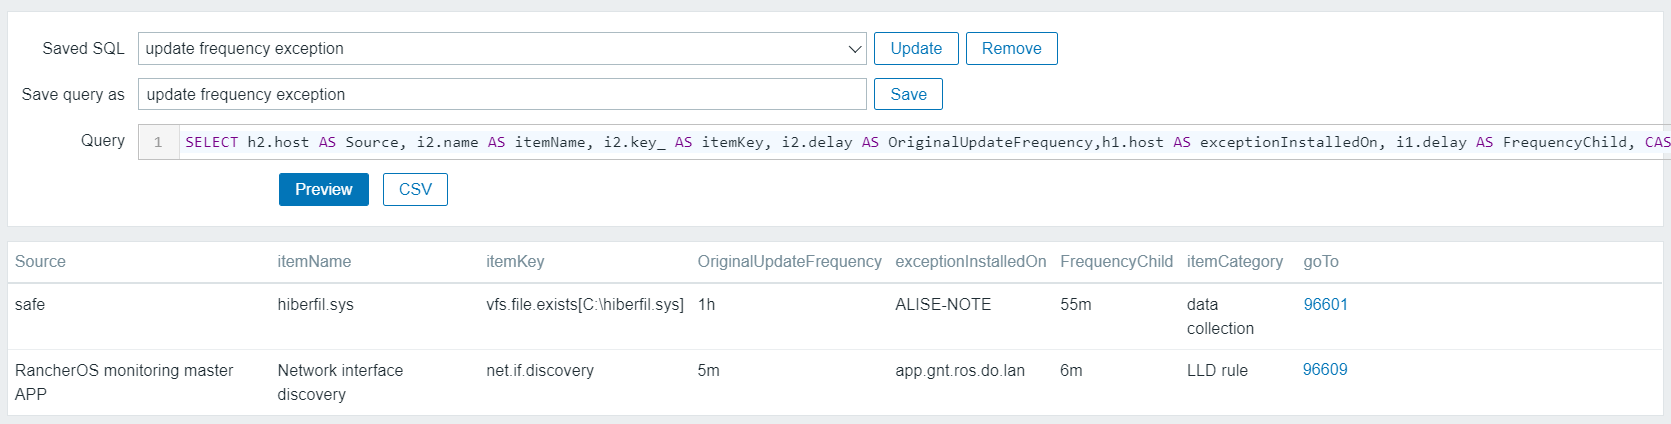
In the output, the “Source” column is a host object (a device) or a template object. The “Source” column is heavily related to “exceptionInstalledOn” column. “Source” VS “exceptionInstalledOn” practically tells there is a relation between a host and a template or between a template and another template.
“FrequencyChild” column is the most important field, which describes an exception installed which differs from the original object.
The output allows navigating directly to the item where the update frequency stands out.
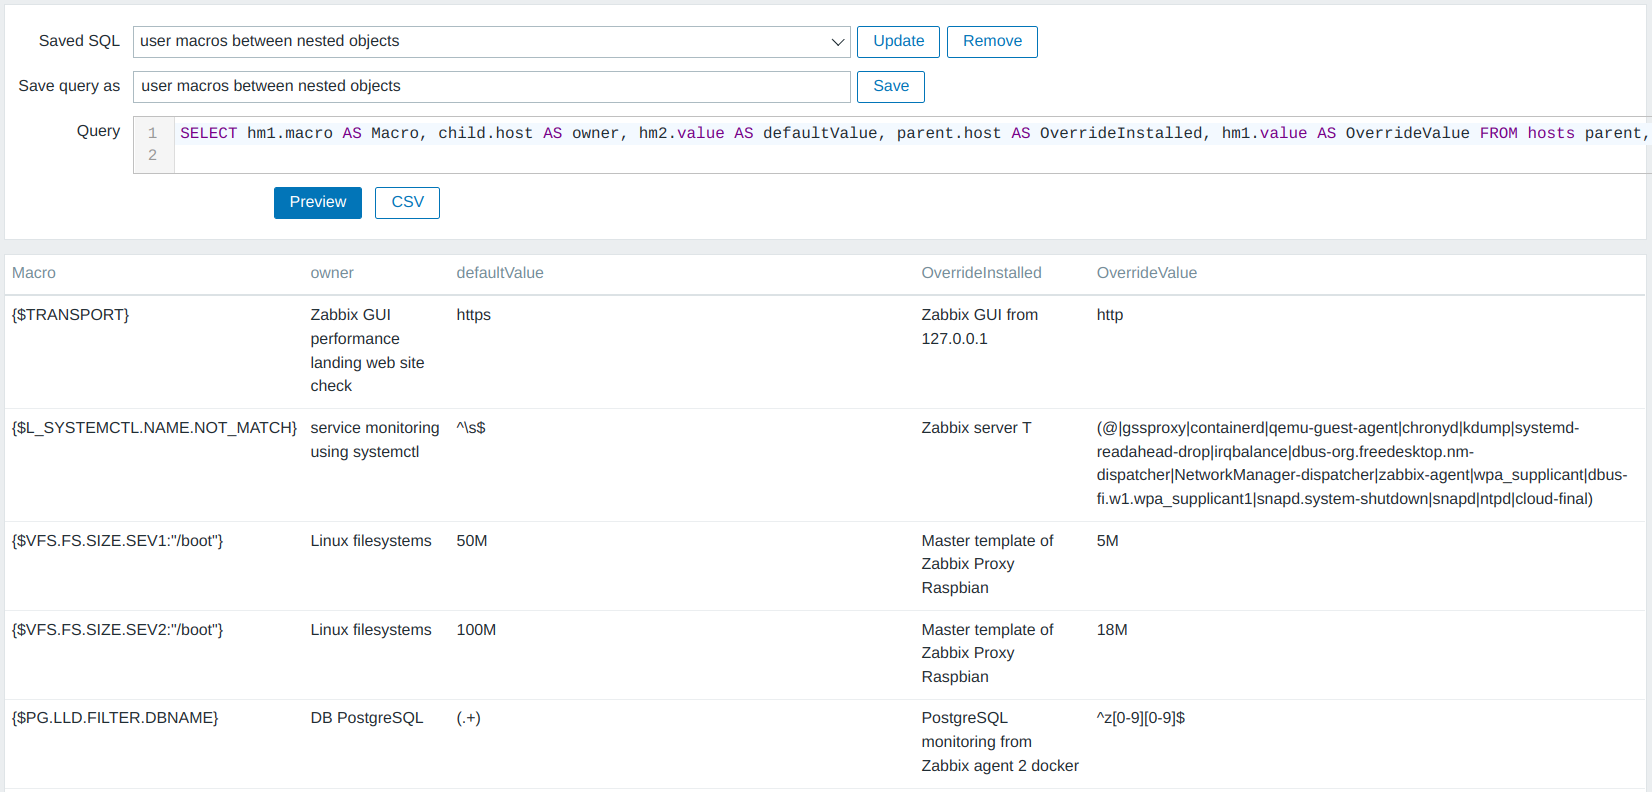
Connection characteristics and custom trigger thresholds
The query will show every installed override between host and template object or between template and parent template object. If template nesting is used at multiple levels, it will highlight if an overriding value if that is installed somewhere in the middle.
SELECT hm1.macro AS Macro, child.host AS owner, hm2.value AS defaultValue, parent.host AS OverrideInstalled, hm1.value AS OverrideValue FROM hosts parent, hosts child, hosts_templates rel, hostmacro hm1, hostmacro hm2 WHERE parent.hostid=rel.hostid AND child.hostid=rel.templateid AND hm1.hostid = parent.hostid AND hm2.hostid = child.hostid AND hm1.macro = hm2.macro AND parent.flags=0 AND child.flags=0 AND hm1.value <> hm2.value;
Abandoned items
A very lonely item that does not belong to any template.
SELECT hosts.host, items.key_,CONCAT('items.php?form=update&context=host&itemid=',items.itemid) AS goTo FROM items JOIN hosts ON (hosts.hostid=items.hostid) WHERE hosts.status=0 AND hosts.flags=0 AND items.status=0 AND items.templateid IS NULL AND items.flags=0;
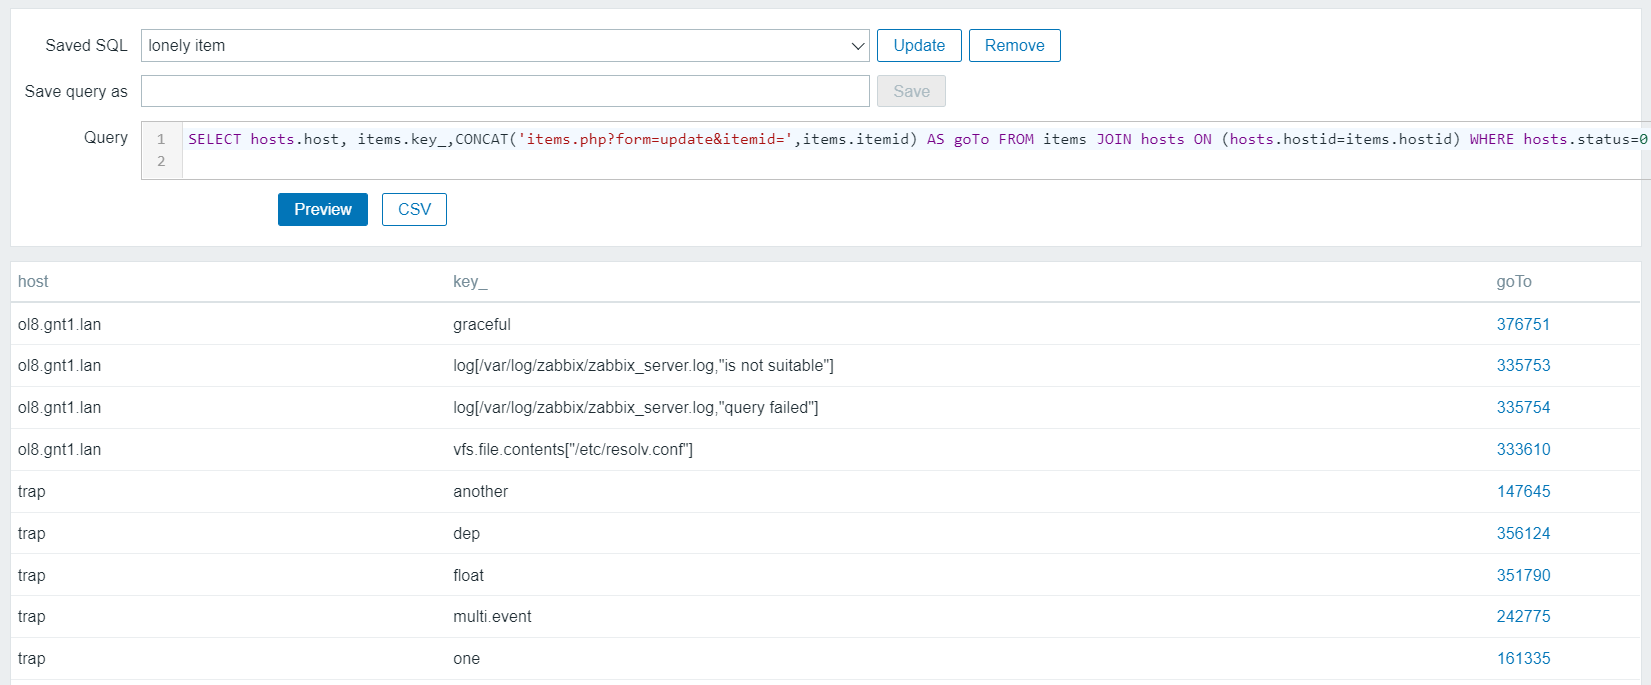
To keep up centralized management, it would be better to move and maintain the definition of the item to the template level.
4) Reporting
We can summarize an item and host configurations, enabled and disabled data collector items, and linked templates.
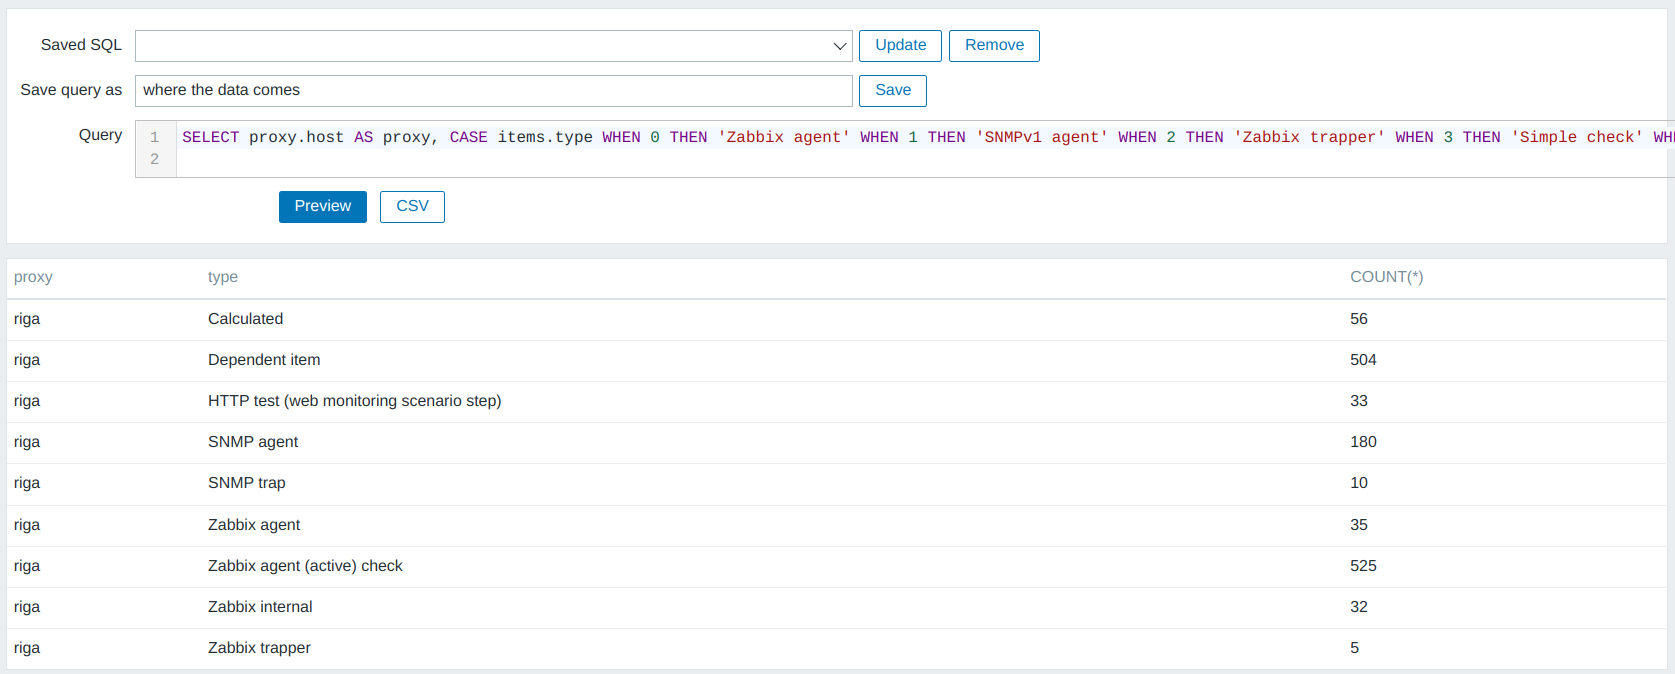
What data collection method is used?
To summarize all data collection techniques and see the membership by Zabbix proxy use the following command:
SELECT proxy.host AS proxy, CASE items.type WHEN 0 THEN 'Zabbix agent' WHEN 1 THEN 'SNMPv1 agent' WHEN 2 THEN 'Zabbix trapper' WHEN 3 THEN 'Simple check' WHEN 4 THEN 'SNMPv2 agent' WHEN 5 THEN 'Zabbix internal' WHEN 6 THEN 'SNMPv3 agent' WHEN 7 THEN 'Zabbix agent (active) check' WHEN 8 THEN 'Aggregate' WHEN 9 THEN 'HTTP test (web monitoring scenario step)' WHEN 10 THEN 'External check' WHEN 11 THEN 'Database monitor' WHEN 12 THEN 'IPMI agent' WHEN 13 THEN 'SSH agent' WHEN 14 THEN 'TELNET agent' WHEN 15 THEN 'Calculated' WHEN 16 THEN 'JMX agent' WHEN 17 THEN 'SNMP trap' WHEN 18 THEN 'Dependent item' WHEN 19 THEN 'HTTP agent' WHEN 20 THEN 'SNMP agent' WHEN 21 THEN 'Script item' END AS type,COUNT(*) FROM items JOIN hosts ON (hosts.hostid=items.hostid) LEFT JOIN hosts proxy ON (hosts.proxy_hostid=proxy.hostid) WHERE hosts.status=0 AND items.status=0 GROUP BY proxy.host, items.type ORDER BY 1,2,3 DESC;
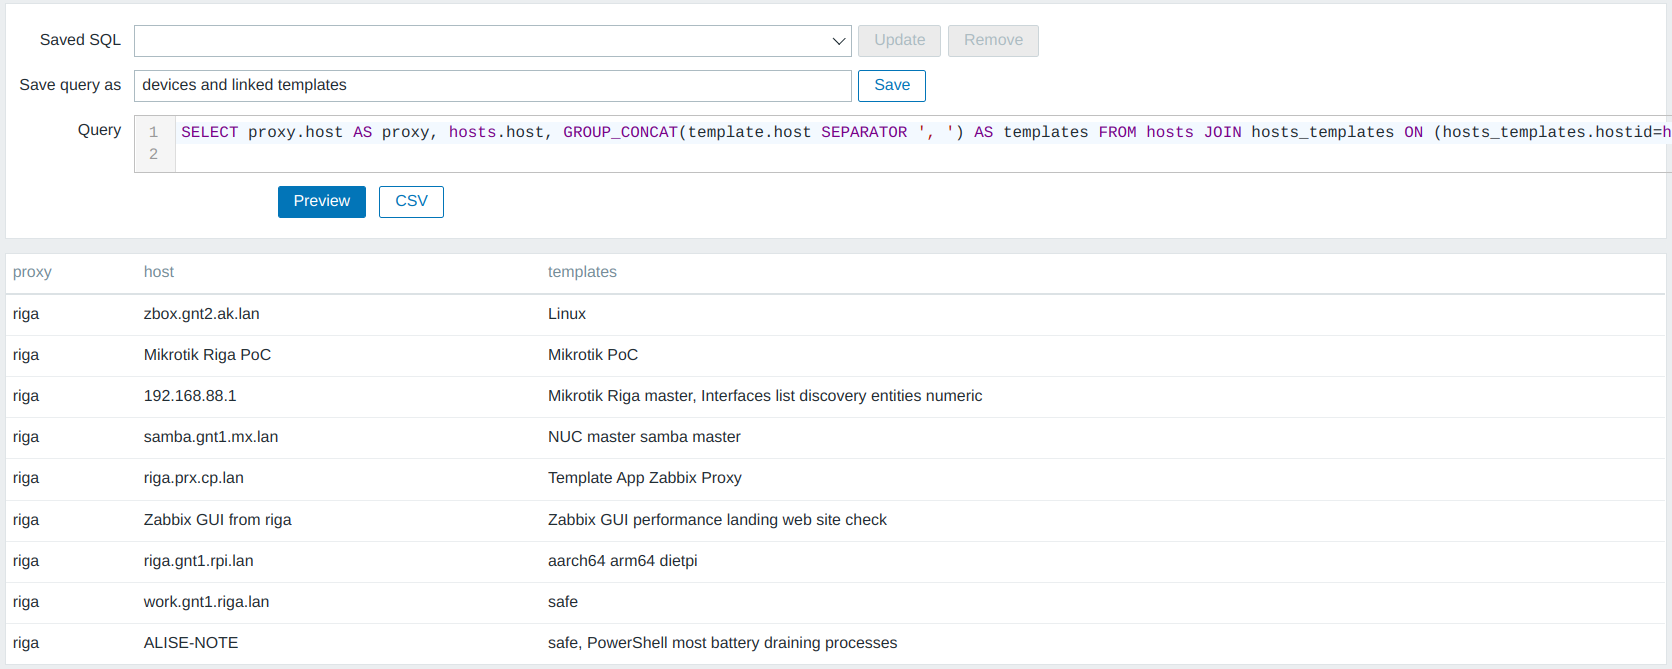
Devices and linked templates
If one server runs as a database server, a web server, and an application server, there must be multiple templates linked. The following query can help to detect the linked templates.
MySQL:
SELECT proxy.host AS proxy, hosts.host, GROUP_CONCAT(template.host SEPARATOR ', ') AS templates FROM hosts JOIN hosts_templates ON (hosts_templates.hostid=hosts.hostid) LEFT JOIN hosts proxy ON (hosts.proxy_hostid=proxy.hostid) LEFT JOIN hosts template ON (hosts_templates.templateid=template.hostid) WHERE hosts.status IN (0,1) AND hosts.flags=0 GROUP BY 1,2 ORDER BY 1,3,2;
PostgreSQL:
SELECT proxy.host AS proxy, hosts.host, ARRAY_TO_STRING(ARRAY_AGG(template.host),', ') AS templates FROM hosts JOIN hosts_templates ON (hosts_templates.hostid=hosts.hostid) LEFT JOIN hosts proxy ON (hosts.proxy_hostid=proxy.hostid) LEFT JOIN hosts template ON (hosts_templates.templateid=template.hostid) WHERE hosts.status IN (0,1) AND hosts.flags=0 GROUP BY 1,2 ORDER BY 1,3,2;
Devices and all inventory fields
SELECT h.host,i.type,i.type_full,i.name,i.alias,i.os,i.os_full,i.os_short,i.serialno_a,i.serialno_b,i.tag,i.asset_tag,i.macaddress_a,i.macaddress_b,i.hardware,i.hardware_full,i.software,i.software_full,i.software_app_a,i.software_app_b,i.software_app_c,i.software_app_d,i.software_app_e,i.contact,i.location,i.location_lat,i.location_lon,i.notes,i.chassis,i.model,i.hw_arch,i.vendor,i.contract_number,i.installer_name,i.deployment_status,i.url_a,i.url_b,i.url_c,i.host_networks,i.host_netmask,i.host_router,i.oob_ip,i.oob_netmask,i.oob_router,i.date_hw_purchase,i.date_hw_install,i.date_hw_expiry,i.date_hw_decomm,i.site_address_a,i.site_address_b,i.site_address_c,i.site_city,i.site_state,i.site_country,i.site_zip,i.site_rack,i.site_notes,i.poc_1_name,i.poc_1_email,i.poc_1_phone_a,i.poc_1_phone_b,i.poc_1_cell,i.poc_1_screen,i.poc_1_notes,i.poc_2_name,i.poc_2_email,i.poc_2_phone_a,i.poc_2_phone_b,i.poc_2_cell,i.poc_2_screen,i.poc_2_notes FROM host_inventory i, hosts h WHERE i.hostid=h.hostid AND h.flags=0;
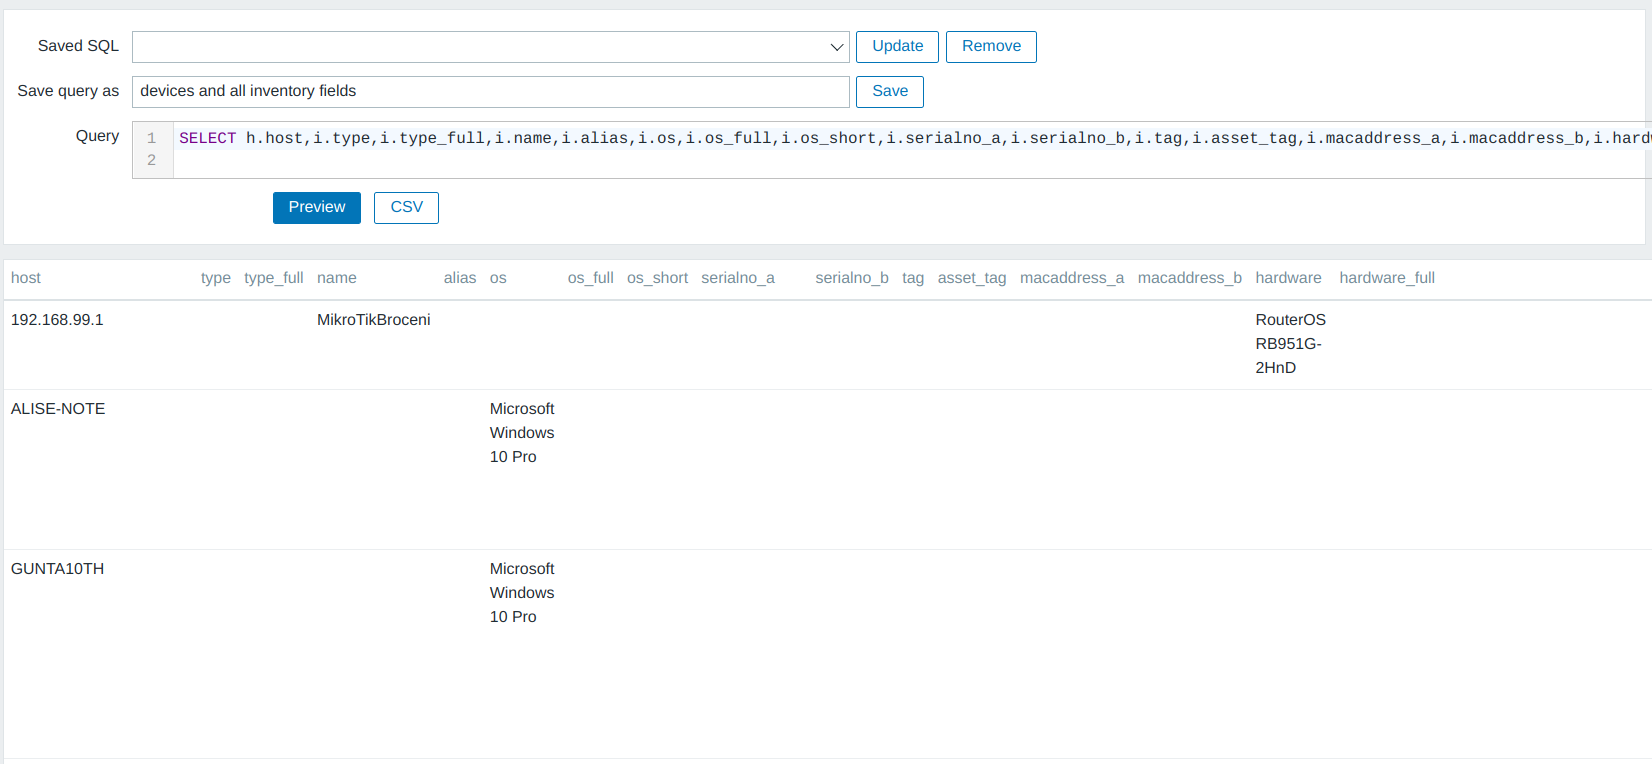
By default, it prints all columns. You can cut away the unnecessary ones. You can use the extracted data for analytics in other software, e.g., MS Excel.
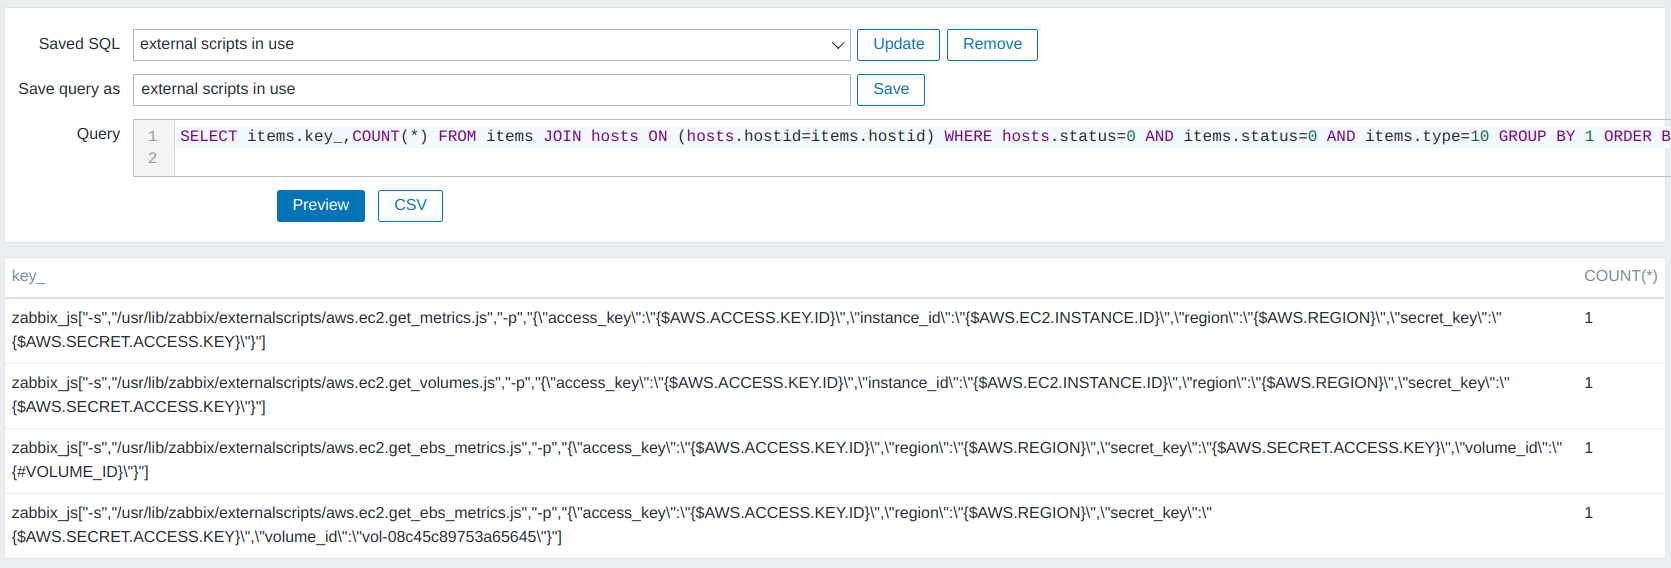
External scripts in use
When migrating to the next release of Zabbix, it’s better to be aware of all external scripts and ensure the new server will support that. An external script is a custom solution for how you collect data. For example, a Python 2 language is not available on a newer operating system out of box.
SELECT items.key_,COUNT(*) FROM items JOIN hosts ON (hosts.hostid=items.hostid) WHERE hosts.status=0 AND items.status=0 AND items.type=10 GROUP BY 1 ORDER BY 2;
Extract most recent metrics
It’s possible to mimic the “Monitoring” => “Latest data” page. Let’s say we want to extract all metrics which are using ‘B’ (bytes) unit at the deffinition of item. This will automatically capture disk usage, memory usage because it’s measured in bytes. In this example we are analyzing a table which holds integer numbers only (table does not hold decimal numbers)
MySQL:
SELECT hosts.host AS host, items.key_ AS itemKey, items.name AS name, (history_uint.value/1024/1024/1024) AS GB FROM history_uint JOIN items ON (items.itemid=history_uint.itemid) JOIN hosts ON (hosts.hostid=items.hostid) JOIN (SELECT DISTINCT itemid AS id, MAX(history_uint.clock) AS clock FROM history_uint WHERE clock > UNIX_TIMESTAMP(NOW()-INTERVAL 65 MINUTE) GROUP BY 1) t2 ON t2.id=history_uint.itemid WHERE history_uint.clock=t2.clock AND items.units='B' ORDER BY 1,2;
PostgreSQL:
SELECT hosts.host AS host, items.key_ AS itemKey, items.name AS name, (history_uint.value/1024/1024/1024)::NUMERIC(10,2) AS GB FROM history_uint JOIN items ON (items.itemid=history_uint.itemid) JOIN hosts ON (hosts.hostid=items.hostid) JOIN (SELECT DISTINCT itemid AS id, MAX(history_uint.clock) AS clock FROM history_uint WHERE clock > EXTRACT(epoch FROM NOW()-INTERVAL '65 MINUTE') GROUP BY 1) t2 ON t2.id=history_uint.itemid WHERE history_uint.clock=t2.clock AND items.units='B' ORDER BY 1,2;
Another example would be with decimal numbers. To query everything which is measured in ‘%’ we can use:
MySQL:
SELECT hosts.host AS host, items.key_ AS itemKey, items.name AS name, history.value AS percentage FROM history JOIN items ON (items.itemid=history.itemid) JOIN hosts ON (hosts.hostid=items.hostid) JOIN (SELECT DISTINCT itemid AS id, MAX(history.clock) AS clock FROM history WHERE clock > UNIX_TIMESTAMP(NOW()-INTERVAL 65 MINUTE) GROUP BY 1) t2 ON t2.id=history.itemid WHERE history.clock=t2.clock AND items.units='%' ORDER BY 1,2;
PostgreSQL:
SELECT hosts.host AS host, items.key_ AS itemKey, items.name AS name, history.value::NUMERIC(10,2) AS percentage FROM history JOIN items ON (items.itemid=history.itemid) JOIN hosts ON (hosts.hostid=items.hostid) JOIN (SELECT DISTINCT itemid AS id, MAX(history.clock) AS clock FROM history WHERE clock > EXTRACT(epoch FROM NOW()-INTERVAL '65 MINUTE') GROUP BY 1) t2 ON t2.id=history.itemid WHERE history.clock=t2.clock AND items.units='%' ORDER BY 1,2;
5) Polish your Zabbix instance
This section will require more work. Being a non-perfectionist is an advantage.
To work with internal events (data collection not working, trigger not working), we have to have a least one internal action enabled. It can be an action with a condition that will never be true:
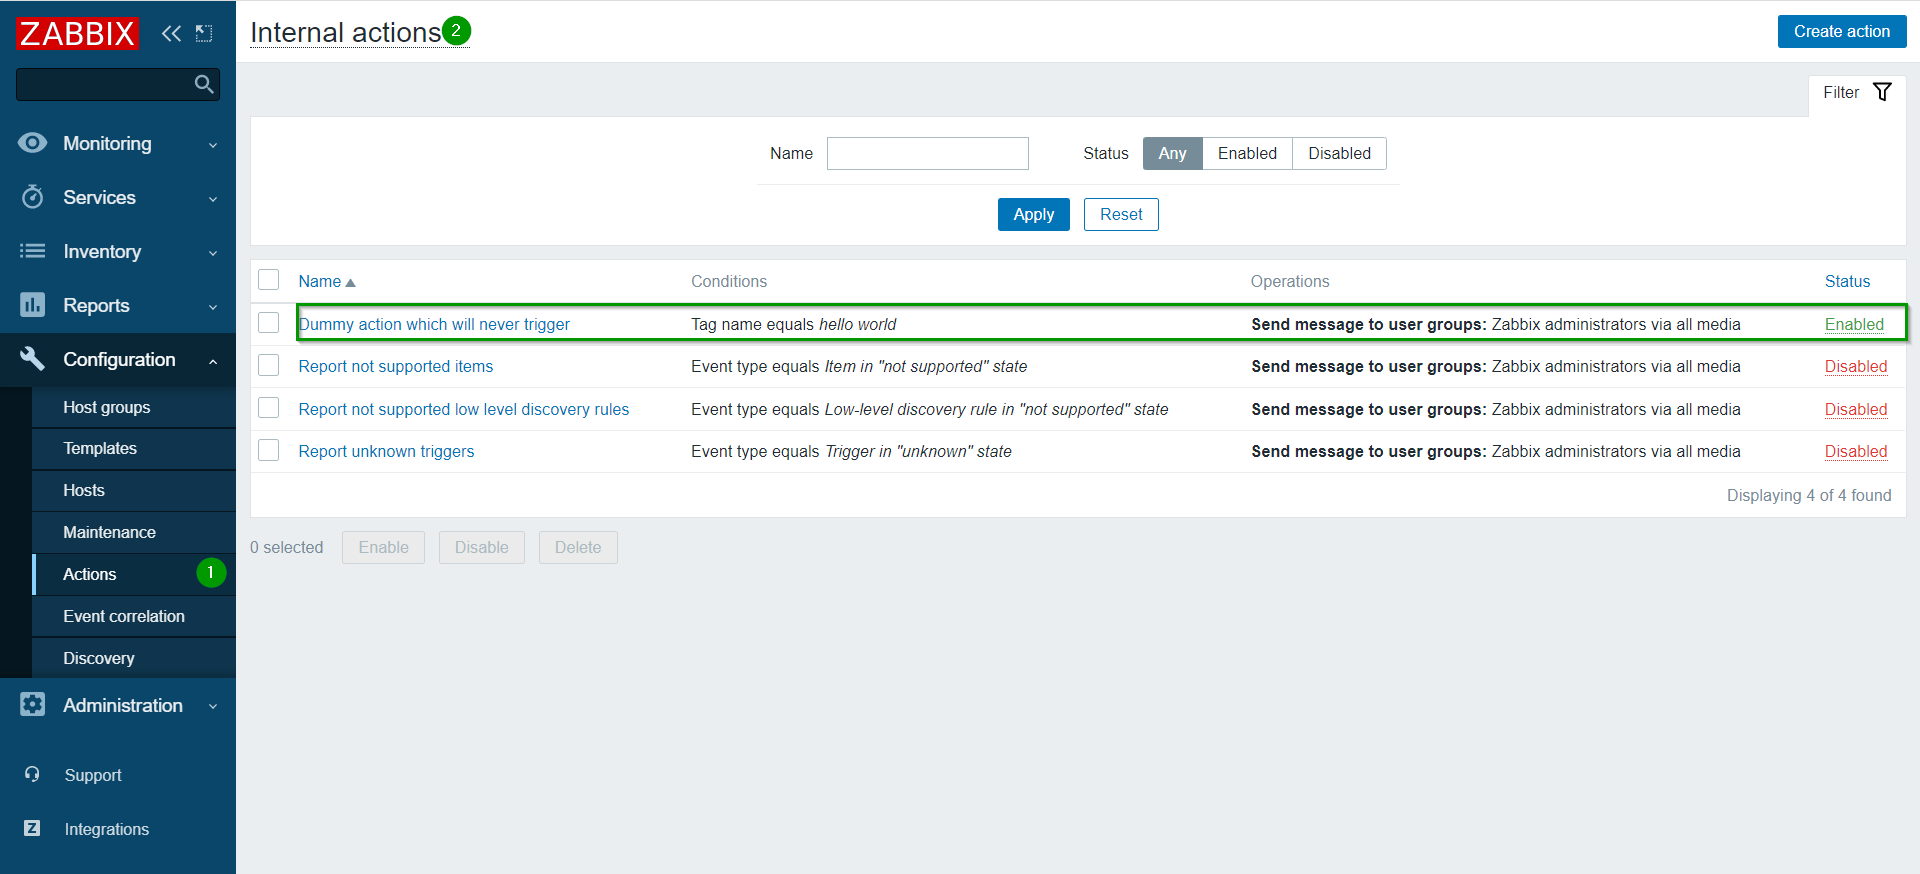
Be careful, if you have huge infrastructure and currently everything is disabled, then don’t enable! Or enable only for 4h to generate some statistics and then turn it off. If you keep internal events ON and a lot of things are not working, it will create frontend very slow. And it will get even slower every day.
Data collection
Monitoring is based on data collection. If new data does not come in, we cannot detect if the service is up or down. The following query will list all data collector items which cannot receive the data.
SELECT hosts.name, items.key_ AS keyName, problem.name AS error, CONCAT('items.php?form=update&itemid=',objectid) AS goTo FROM problem JOIN items ON (items.itemid=problem.objectid) JOIN hosts ON (hosts.hostid=items.hostid) WHERE problem.source>0 AND problem.object=4;
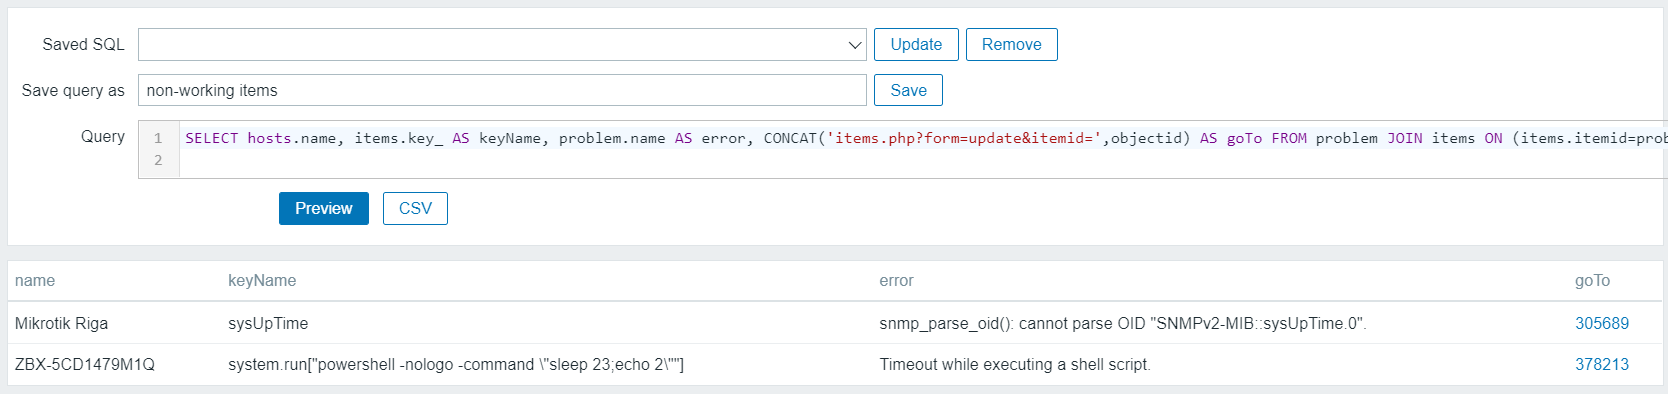
The output provides a clickable link to navigate to the item and investigate. Common issues can be a timeout, wrong credentials, and permissions.
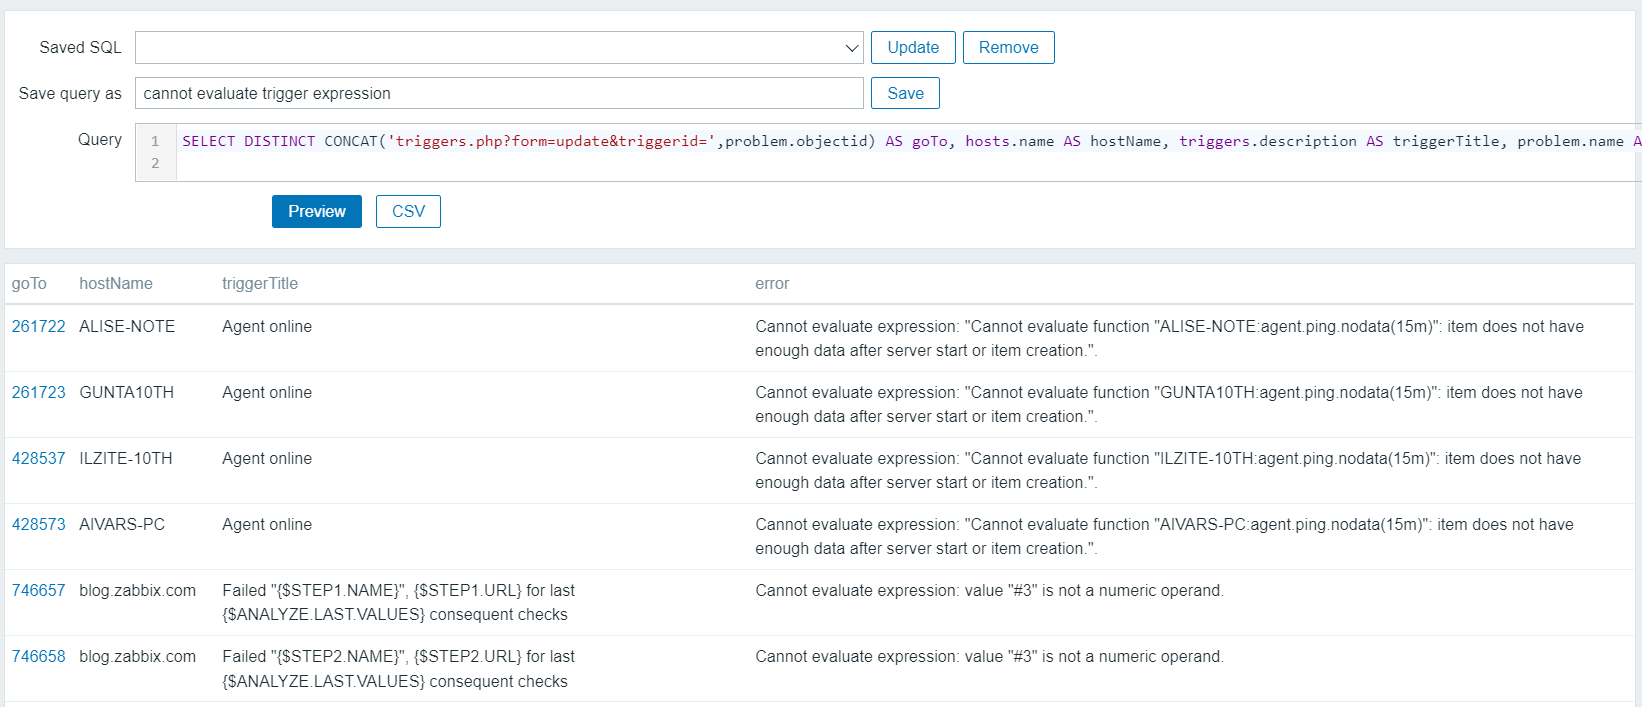
Trigger evaluation
When data is collected and if an item has a trigger linked, it’s possible that there is a problem in evaluating trigger logic. The result of the following query will show you why it’s impossible to detect the problem.
SELECT DISTINCT CONCAT('triggers.php?form=update&triggerid=',problem.objectid) AS goTo, hosts.name AS hostName, triggers.description AS triggerTitle, problem.name AS error FROM problem JOIN triggers ON (triggers.triggerid=problem.objectid) JOIN functions ON (functions.triggerid=triggers.triggerid) JOIN items ON (items.itemid=functions.itemid) JOIN hosts ON (hosts.hostid=items.hostid) WHERE problem.source > 0 AND problem.object=0;
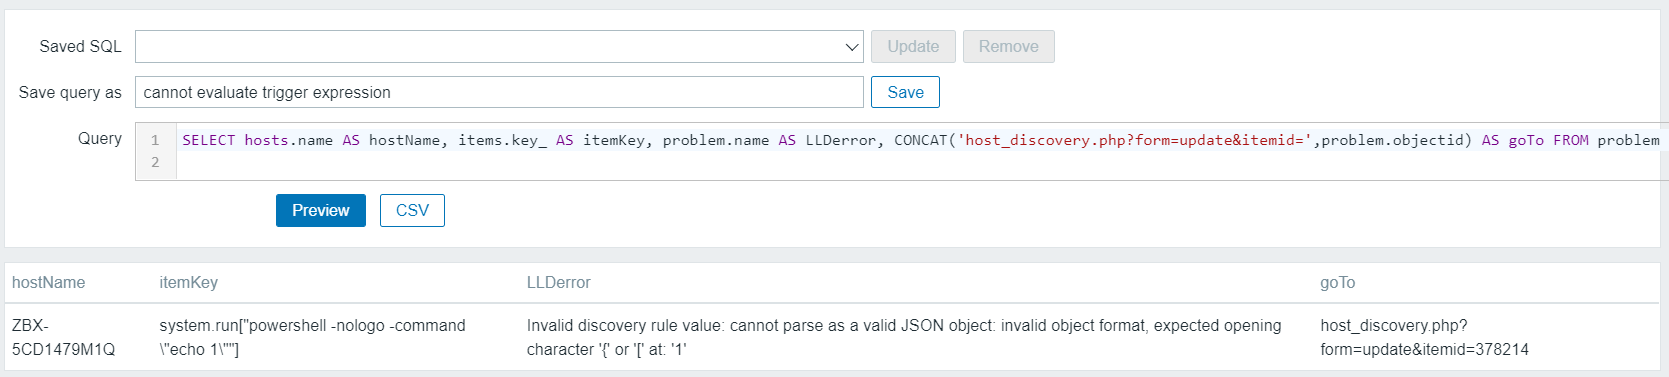
Low-level discovery
The purpose of low-level discovery is to find all elements which exist in a particular system. For example, find all services on a windows system. If discovery is not working, then additional elements will not get covered, which means no data collection, no trigger, and no notification. The following query will show all erroneous LLD rules and the reason there is a problem:
SELECT hosts.name AS hostName, items.key_ AS itemKey, problem.name AS LLDerror, CONCAT('host_discovery.php?form=update&itemid=',problem.objectid) AS goTo FROM problem JOIN items ON (items.itemid=problem.objectid) JOIN hosts ON (hosts.hostid=items.hostid) WHERE problem.source > 0 AND problem.object=5;
That is it for today.
In the comments section below, let us know what kind of report your company desires to see.
Appendix
Know issues of the module:
- When linking tables in SQL output, if there are multiple columns with the same name, only the first column will be printed. As a workaround, always use “AS ColumnName” directive to specify unique column names in the output.


Congratulations on the article, sensational.
Sorry for the English, I need to improve.
I really want to generate a report of all hosts, linked template, with their items, their status, last collection date and triggers.
Thank you for reading the article. There are some challenging parts of this requirement, like:
Thank you for the use case. Will think about it how to solve some parts of it.
Hi Aigars,
I am using zabbix_server (Zabbix) 5.0.13 version and as per the steps completed the required configuration. In the menu the SQL Explorer option is coming but while accessing it getting the HTTP ERROR 500. Any configuration change needed?
It would be nice if you can upgrade the version of frontend files to latest minor version 5.0.x. Module was tested and works with 5.0.30. Maybe SELinux is preventing some functions.
Hi Aigars,
I am using zabbix_server version (6.0.4) and completed the installation but it is not working, getting HTTP ERROR 500 (crbug/1173575, deprecated non-JS module files), any ideas?
Thank you for feedback.
The binary file
zabbix_server(servicezabbix-server) is not related to the functionality of module, this process is not required for module to work. On the frontend server (apache, nginx), run commandrpm -qa | grep zabbixorapt list --installed | grep zabbixand let us know the version ofzabbix-webpackage.P.S. I checked the module works fine with
zabbix-webversion 6.0.4.Good morning,
thanks for your answer, here goes the versions!
zabbix-web-deps-6.0.4-1.el8.noarch
zabbix-server-mysql-6.0.4-1.el8.x86_64
zabbix-release-6.0-1.el8.noarch
zabbix-apache-conf-6.0.4-1.el8.noarch
zabbix-web-mysql-6.0.4-1.el8.noarch
zabbix-get-6.0.4-1.el8.x86_64
zabbix-sql-scripts-6.0.4-1.el8.noarch
zabbix-web-6.0.4-1.el8.noarch
my error is the same as Mr TP
[Thu Dec 15 10:56:02.739464 2022] [proxy_fcgi:error] [pid 3121:tid 140296708941568] [client 10.250.39.6:53272] AH01071: Got error ‘PHP message: PHP Parse error: syntax error, unexpected end of file, expecting variable (T_VARIABLE) or heredoc end (T_END_HEREDOC) or ${ (T_DOLLAR_OPEN_CURLY_BRACES) or {$ (T_CURLY_OPEN) in /usr/share/zabbix/modules/zabbix-module-sqlexplorer-main/views/sql.form.view.php on line 135\n’, referer: http://10.130.6.9/zabbix/zabbix.php?action=module.list
You can try the same patch as recommended for Mr TP.
Open /usr/share/zabbix/modules/zabbix-module-sqlexplorer-main/views/sql.form.view.php, go to line 143 and remove all white spaces before keyword
CSS. Save the file. No need to restart anything, it should work. Another workaround is to use PHP 7.4 instead of 7.2.P.S. The problem will be fixed in original versio soon, so you can try install instructions 2 days later – the module will be fully supported with PHP 7.2.
Problem is fixed. Remove the directory of old module. Reload this page and do again the install instructions.
Thank you Aigars, it worked 🙂
Hi Aigars,
As per your suggestion I have upgraded the frontend to 5.0.30 but still I am getting the error. Selinux is in disabled state. Found the below error in httpd error log file.
Error:
[Wed Dec 14 21:40:26.243716 2022] [proxy_fcgi:error] [pid 27853] [client 10.150.84.39:60191] AH01071: Got error 'PHP message: PHP Parse error: syntax error, unexpected end of file, expecting variable (T_VARIABLE) or heredoc end (T_END_HEREDOC) or ${ (T_DOLLAR_OPEN_CURLY_BRACES) or {$ (T_CURLY_OPEN) in /usr/share/zabbix/modules/zabbix-module-sqlexplorer/views/sql.form.view.php on line 135\n', referer: http://zabbixstg01.lv.tivo.com/zabbix/zabbix.php?action=dashboard.viewThank you for finding a bug! I tested with CentOS 7 and official instructions – it does not work.
A fix is to open file /usr/share/zabbix/modules/zabbix-module-sqlexplorer/views/sql.form.view.php go to line nr 143 and remove all white spaces before keyword
CSS. It works like magic. No need to restart anything.The fix will be implemented in original post. You can wait 2 days an retry the install.
Thank you again for finding a problem.
It worked, thank you very much
Great work. 🙂
Hello, it works for me without problems on zabbix 6.0.12
Congratulations for the post and the module.
Very useful to have more information about the health of our zabbix.
I take this opportunity to congratulate you for all the knowledge you share on the Blog.
Thank you very much Agars.
Thanks also to Gregory.
Hi Aigars,
I am looking for export Report -> Availability report. Is this possible?
Thank you for the comment.
“Report” => “Availability” is not so easy to replicate in one go as it requires extracting all trigger IDs from the instance and then go through them one-by-one to aggregate statistics.
If we concentrate only on problems, this is as close as we can get. Top hits (not the ratio as you asked) for the events:
SELECT DISTINCT triggers.triggerid,
events.name, hosts.host, proxy.host AS proxy, COUNT(*)
FROM events
JOIN triggers ON events.objectid=triggers.triggerid
JOIN functions ON functions.triggerid=triggers.triggerid
JOIN items ON items.itemid=functions.itemid
JOIN hosts ON hosts.hostid=items.hostid
LEFT JOIN hosts proxy ON hosts.proxy_hostid=proxy.hostid
WHERE events.source=0 AND events.object=0
GROUP BY 1,2,3,4
ORDER BY 5 DESC
LIMIT 5;
This is actually mimicing “Trigger top 100”.
Hi Aigars, Thanks for the article. This Module could be exactly what I am looking for.
I have a requirement to server information from a Host group and export it to CSV.
It needs to contain Drive information and the zabbix dashboards are to small for the information to be displayed nicely. Is this possible with your tool.
I would need to export all disk and their utilization along with CPU and Memory consumption.
Any help would be very much appreciated
Gary
Hi Gary,
Thank you for comment. This is an interesting use case. I have update the post by including one example which can help to accomplish some parts of the result you desire. Refresh the page and check section “Reporting” => “Extract most recent metrics”
It looks very interesting. But it gives me “access denied” even though I’m in super admin profile. I have installed a version of zabbix 6.4.13-release, I would appreciate an indication. Thank you.
Hello Again. I am still with the problen of Access Denied. I install de version
*-zabbix-6.4-7.0.zipand verified the fix but still dont work.Thanks…
It looks very interesting. But it gives me “access denied” even though I’m in super admin profile.
Could you double-check that the frontend version is one of the supported ones, 5.0.x or 6.0.x?
If it’s a red hat system, try “setenforce 0” to set SELinux to permissive mode.
zabbix_server version (Zabbix) 6.4.13
it’s oracle linux 8
Mode from config file: permissive
and also restart zabbix service but still same error
Thank you very much for this excellent post Aigars!Regrads from Argentina!
Leandro
Love this module. On Zabbix 6, I want to be able to get a csv export and mimic this page https://servername/items.php?filter_set=1&filter_hostids%5B0%5D=11365&context=host
Basically specify 1 host get all items with appropriate chain of templates, show if it has triggers or not, and if so the trigger information. including overrides.
I know this would be too big of a query for more than 1 or a few hosts at one time, so yeah would use a where clause and provide the server name… Or maybe a host group to get multiple hosts.
Been trying to build my own query, but failing at getting correct template information for the item.
I have two front-ends with a reverse-proxy on the front of them. Should I install the modules in both front-ends ?
I see you’ve updated it to the latest version of Zabbix 7.2. Thank you for maintaining the module and for all your videos and tutorials. Great work!!!
Thanks to Gregory for maintaining the new version 😉
Aigars, with your permission, I attach the modified queries so that they would work for me in version ZBX 7.2.5
Unreachable Zabbix agent (ZBX) hosts
SELECT hosts.host, interface.error, CONCAT(‘zabbix.php?action=popup&popup=host.edit&hostid=’,hosts.hostid) AS goTo FROM hosts LEFT JOIN interface ON (interface.hostid=hosts.hostid) WHERE LENGTH(interface.error) > 0 AND interface.type=1;
Unreachable network (SNMP) devices
SELECT hosts.host, interface.error, CONCAT(‘zabbix.php?action=popup&popup=host.edit&hostid=’,hosts.hostid) AS goTo FROM hosts LEFT JOIN interface ON (interface.hostid=hosts.hostid) WHERE LENGTH(interface.error) > 0 AND interface.type=2;
Item update interval differs between host/template levels
SELECT h2.host AS Source, i2.name AS itemName, i2.key_ AS itemKey, i2.delay AS OriginalUpdateFrequency,h1.host AS exceptionInstalledOn, i1.delay AS FrequencyChild, CASE WHEN i1.flags=1 THEN ‘LLD rule’ WHEN i1.flags IN (0,4) THEN ‘data collection’ END AS itemCategory , CASE WHEN i1.flags=1 THEN CONCAT(‘host_discovery.php?form=update&context=host&itemid=’,i1.itemid) WHEN i1.flags IN (0,4) THEN CONCAT(‘zabbix.php?action=popup&popup=item.edit&context=host&itemid=’,i1.itemid) END AS goTo FROM items i1 JOIN items i2 ON (i2.itemid=i1.templateid) JOIN hosts h1 ON (h1.hostid=i1.hostid) JOIN hosts h2 ON (h2.hostid=i2.hostid) WHERE i1.delay <> i2.delay;
Abandoned items
SELECT hosts.host, items.key_,CONCAT(‘zabbix.php?action=popup&popup=item.edit&context=host&itemid=’,itemid) AS goTo FROM items JOIN hosts ON (hosts.hostid=items.hostid) WHERE hosts.status=0 AND hosts.flags=0 AND items.status=0 AND items.templateid IS NULL AND items.flags=0;
Non-working items
SELECT hosts.name, items.key_ AS keyName, problem.name AS error, CONCAT(‘zabbix.php?action=popup&popup=item.edit&context=host&itemid=’,objectid) AS goTo FROM problem JOIN items ON (items.itemid=problem.objectid) JOIN hosts ON (hosts.hostid=items.hostid) WHERE problem.source>0 AND problem.object=4;
Trigger evaluation
SELECT DISTINCT CONCAT(‘zabbix.php?action=popup&popup=trigger.edit&triggerid=15032&hostid=’,problem.objectid,’&context=host’) AS goTo, hosts.name AS hostName, triggers.description AS triggerTitle, problem.name AS error FROM problem JOIN triggers ON (triggers.triggerid=problem.objectid) JOIN functions ON (functions.triggerid=triggers.triggerid) JOIN items ON (items.itemid=functions.itemid) JOIN hosts ON (hosts.hostid=items.hostid) WHERE problem.source > 0 AND problem.object=0;
Low-level discovery
SELECT hosts.name AS hostName, items.key_ AS itemKey, problem.name AS LLDerror, CONCAT(‘host_discovery.php?form=update&itemid=’,problem.objectid,’&context=host’) AS goTo FROM problem JOIN items ON (items.itemid=problem.objectid) JOIN hosts ON (hosts.hostid=items.hostid) WHERE problem.source > 0 AND problem.object=5;
What a contribution! Thank you! I hope others can check and confirm that your queries work with MySQL. 7.2 is awesome for giving (back) the opportunity to enter trigger/item configuration via URL This was so lost in 7.0.
On the contrary Airgas, Thank you for all your video tutorials and contributions!!!