


Hosts, items, and triggers are some of the most basic concepts in Zabbix. To successfully configure their monitoring workflows, Zabbix users need to have a clear understanding of how these entities are used. This article is aimed at Zabbix beginners and should help anyone better understand the basics of Zabbix while providing guidance on how to start monitoring your initial set of hosts.
Table of Contents
Hosts
Hosts are top-level entities in Zabbix and represent your monitored endpoints. Whenever we need to monitor a device, web application, service, or anything else – we start by creating a host.
The host acts as a container for our items (representing the metrics we wish to collect) and triggers (problem threshold definitions). These entities can be created directly on the host or inherited from predefined templates.
Every host has 2 mandatory parameters – its unique name and at least a single host group. Host groups are used for grouping, filtering, and assigning read/write permissions to hosts. Hosts are not limited when it comes to the number of host groups they are assigned to.
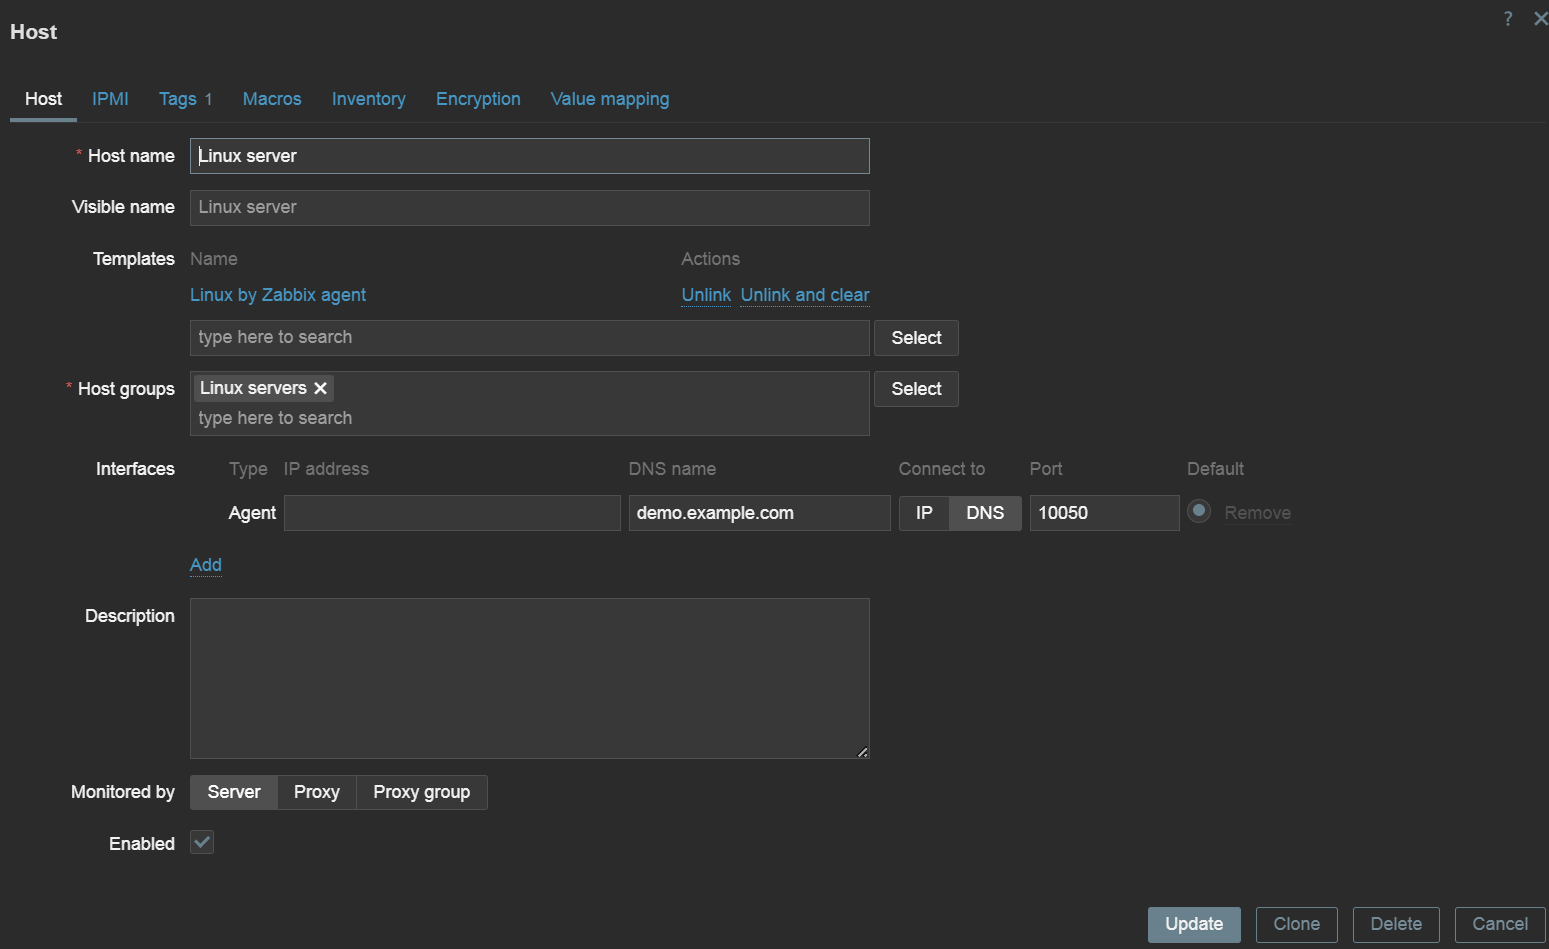
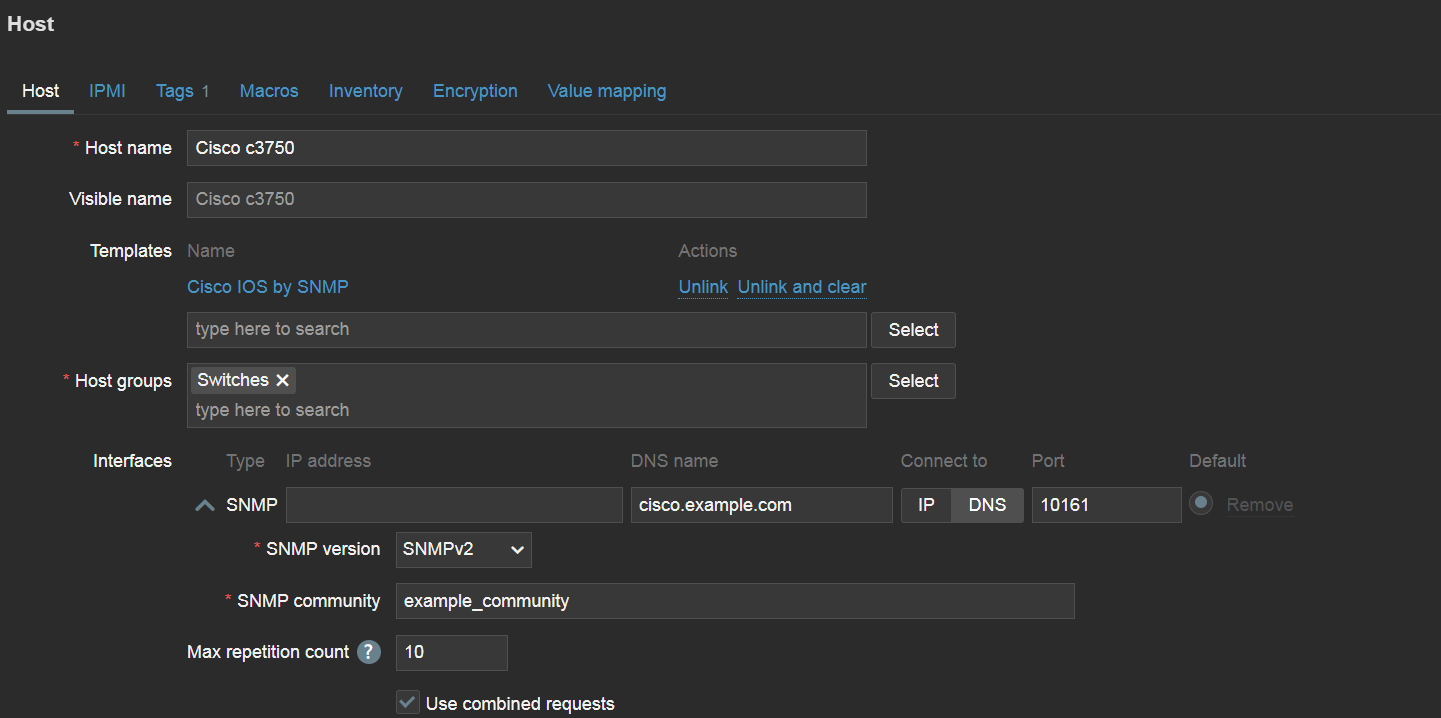
An interface might also be required, depending on the type of items we will create on the host. Interfaces define host addresses and, in case of SNMP interfaces, some additional authentication and security parameters.
There are 4 types of interfaces in total, representing 4 different data collection methods:
- Agent
- SNMP
- JMX
- IPMI
Zabbix supports other types of data collection methods, but for these 4 methods in particular an interface is required on the host. Other data collection methods define endpoint addresses directly in the item configuration or use push data collection (trapping) where Zabbix is not required to know the endpoint address.
Templates
Templates contain a set of predefined items and triggers and can be linked to hosts. This enables the standardization of monitoring workflows in your environment. Changes made on the template will be immediately applied on the hosts to which the template is linked. Zabbix comes prepackaged with over 300 templates for a variety of vendors and endpoint types.
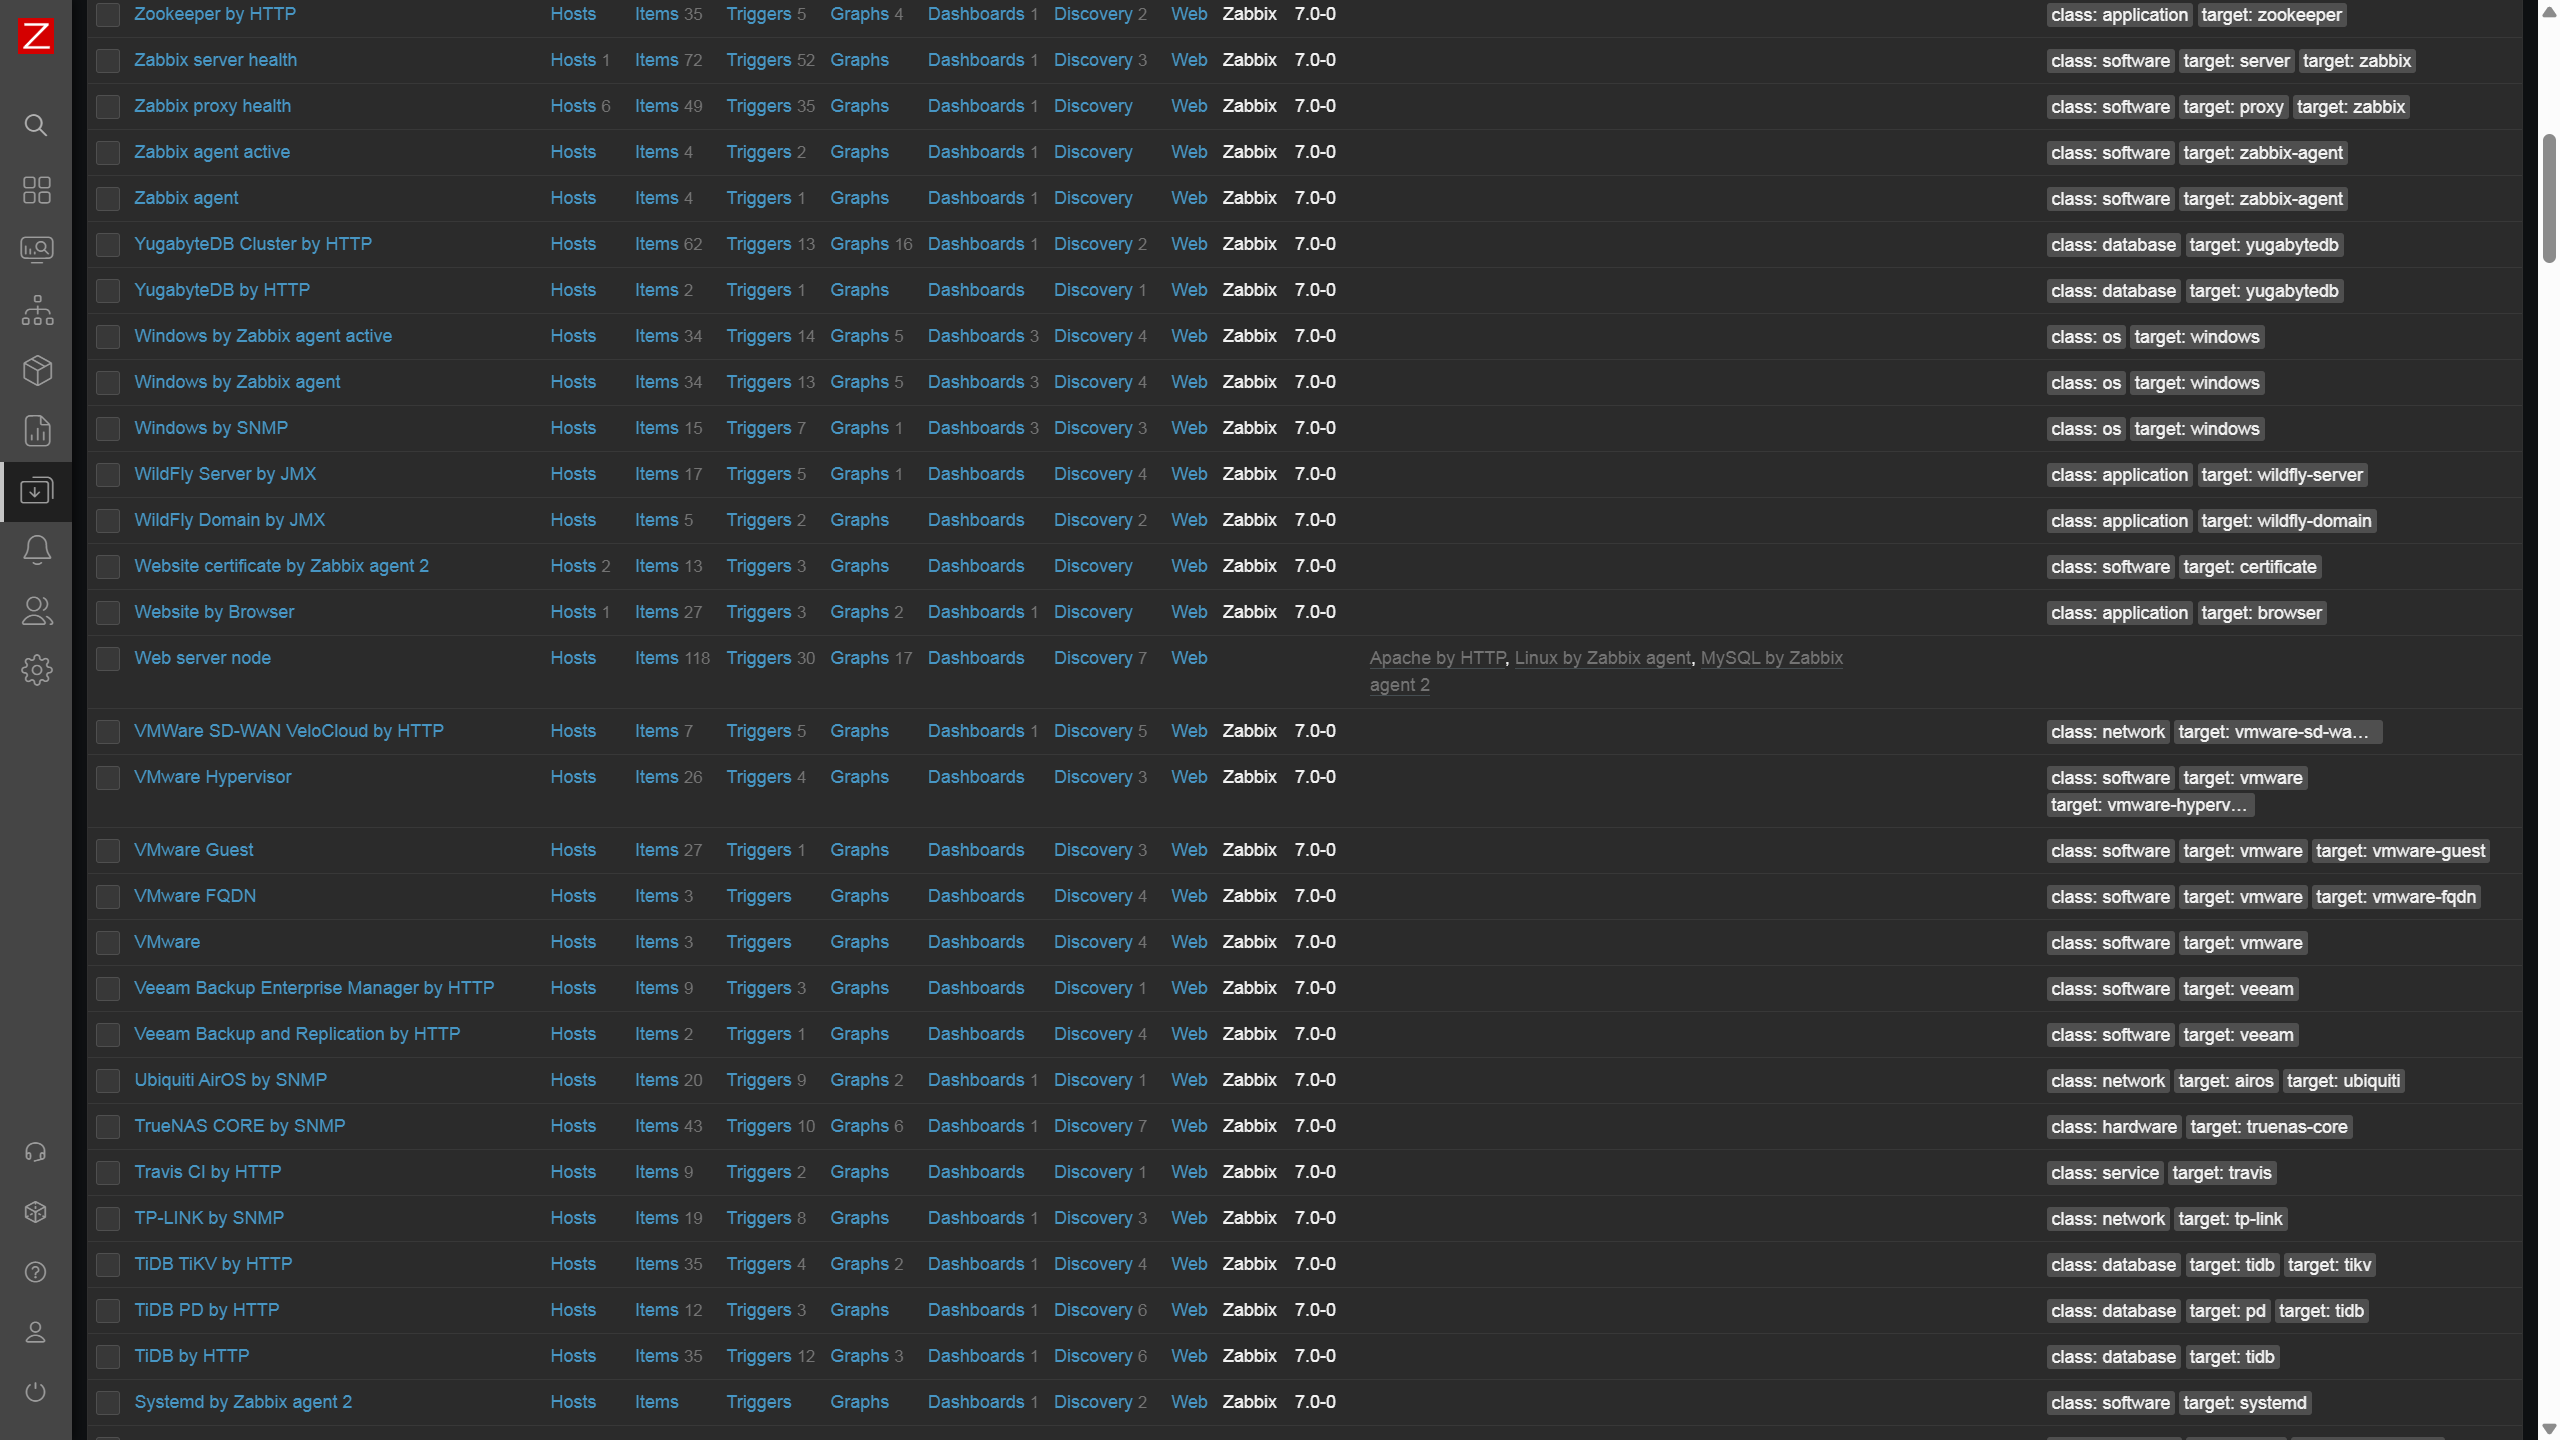
Zabbix users aren’t limited to just the official templates – anyone can create their own templates with items and triggers tailored to the requirements of a particular environment. We also recommend adjusting the official templates – disable the unnecessary items and adjust the triggers so they don’t generate any unnecessary noise.
Items
Items are used to define the metrics that we wish to collect, and are configured on hosts or templates. Items can be of various types. The type of the item usually defines the protocol and the methods used to collect metrics via this item. Some examples of item types:
- Zabbix agent
- SNMP agent
- SNMP trap
- Simple check
- HTTP agent
- IPMI agent
- JMX agent
- SSH agent
- …and many others.
The key of the item is used to specify what particular metric should be collected. There are some exceptions to this – for example, for SNMP agent items it’s the OID field, while the key can be written arbitrarily. The key should be unique per host.
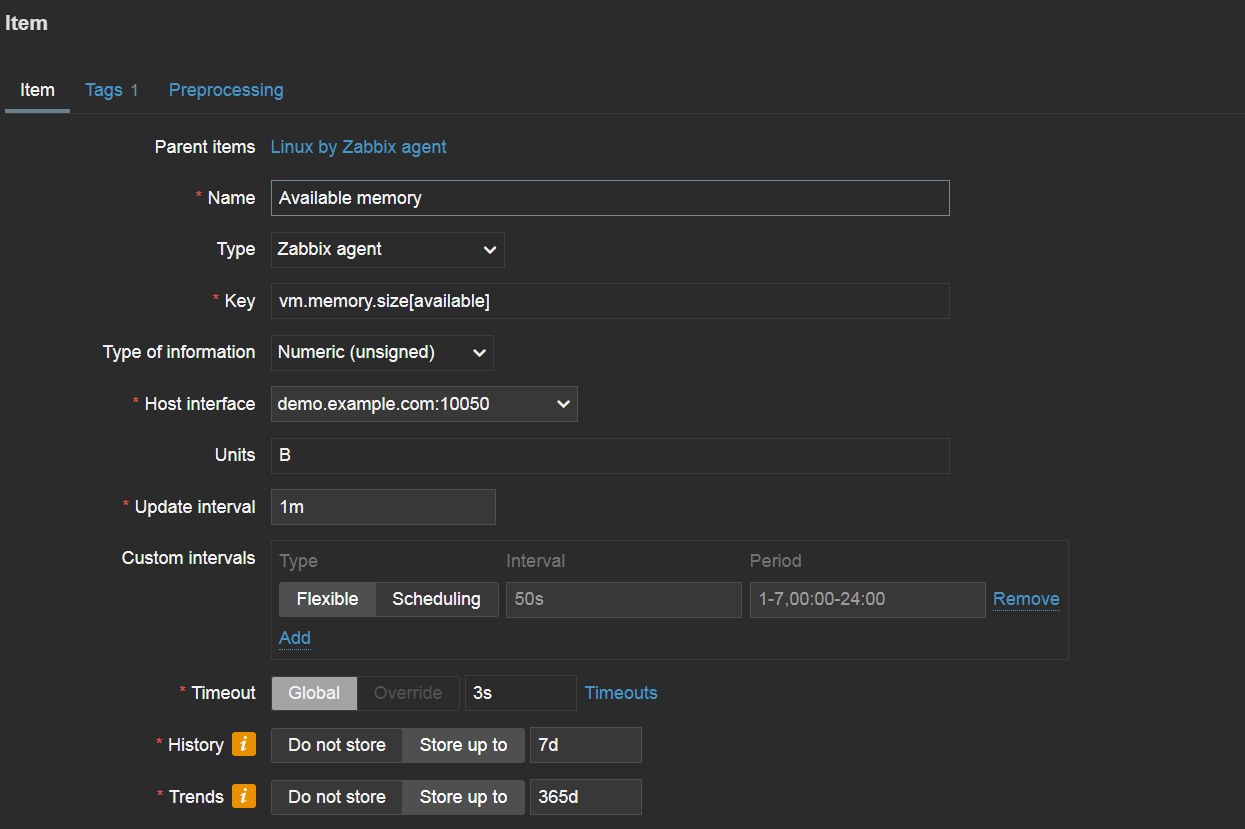
The key uses a <key>[<parameters>] format. For example, if we wish to collect available memory by utilizing Zabbix agent, we will use the vm.memory.size[available] item key. If we wish to collect available memory in percent, we would use the vm.memory.size[pavailable] item key. A quick item key reference is available by pressing select next to the Key field. You can find more about the available item keys and other configuration details in our documentation.
The update interval specifies how often metrics should be collected for this key, and the history/trend storage periods define for how long the collected data should be retained.
Triggers
Once we have configured our items, we should create triggers to react to item values reaching problem thresholds. First, let’s define a simple trigger name. The name should be simple enough for our Zabbix administrators to understand the goal of the trigger simply by glancing at it.
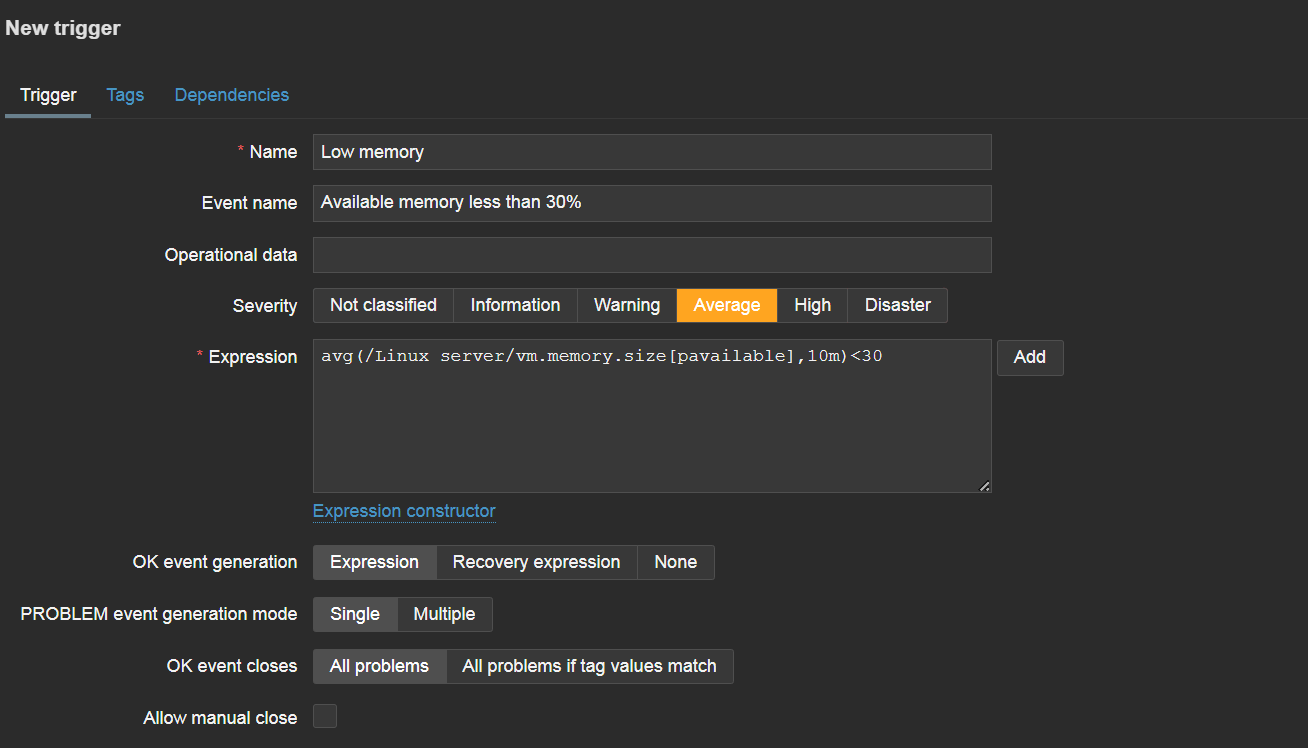
The event name field is used to define the name with which our problems will be displayed. Since the problem event name is often used not just in Zabbix but also in the alerts that your administrators will receive in their mailboxes or via messaging and ITSM systems, the event name should be more descriptive, giving general details about the problematic situation.
Operational data fields are used to display information about the current state of items analyzed by the trigger. By default, the field will display the current value of our item (available memory, for example). This allows users to compare the current item values with item values at the time of problem creation and decide if any additional interference is necessary to resolve the problem.
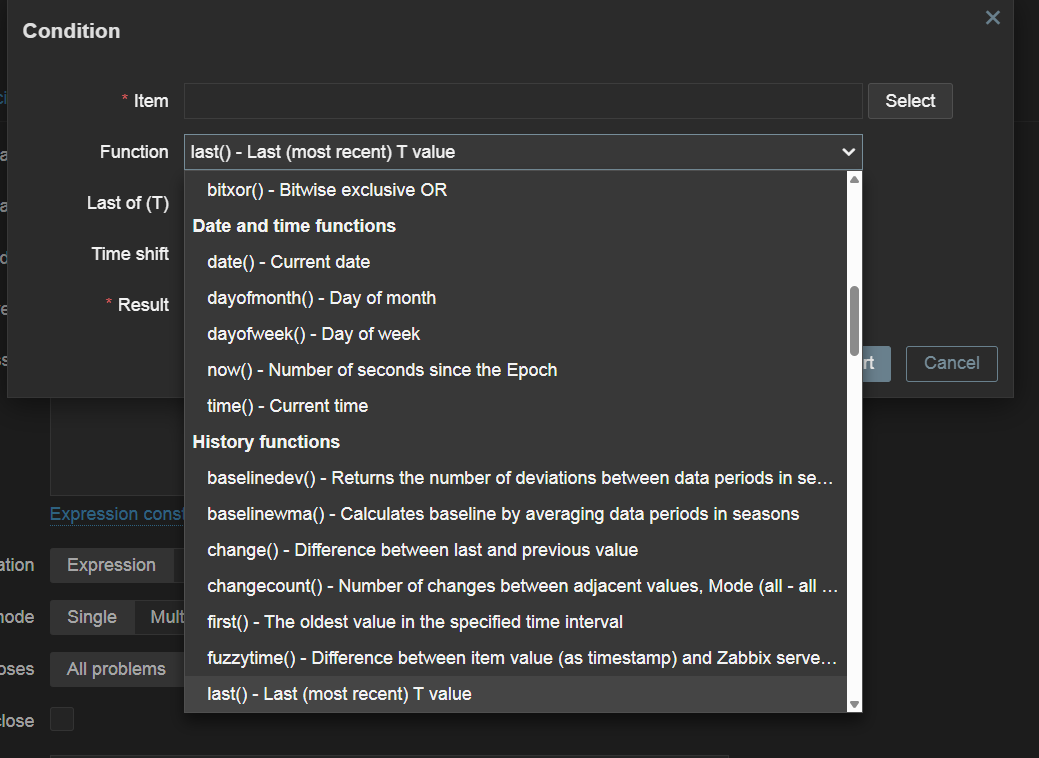
The expression field defines the logic behind detecting a problem. Here, we can either type in the expression manually or press the add button and build the expression by selecting the item that we wish to analyze – plus one of the various functions used for analysis. For example, the last function is used to analyze only the last received value and can generate a lot of noise when used for resource monitoring. Meanwhile, average, minimum, and maximum functions can be used to analyze values less sensitively over time. There are many more functions available for a variety of more advanced use cases – from string analysis functions to predictive functions and many others.
Once the trigger is created, it will be recalculated every time any of the related items receive a new value.
This article covered only the basics of Host, item and trigger configuration. There are many more options for more advanced use cases. If you’re interested or need help with more advanced Zabbix features, please check out a variety of tutorials, how-tos and case studies in our blog and YouTube channel.


great article for people interested to start working with Zabbix, or beginning users.
thanks