


Zabbix proxy is a major component in the whole Zabbix architecture. As a result, very often failure of one proxy can lead to dramatic results in all monitoring setup causing a storm of events and problems.
Contents
I. Setup (0:57)
II. Why the queue is growing? (2:57)
1. Misconfiguration (2:57)
2. Proxy cannot connect to the agent (6:26)
3. Proxy cannot connect to the server (12:15)
4. Proxy cannot send data fast enough (13:52)
5. Proxy doesn’t have enough processes (18:14)
6. Server cannot keep up with the data (23:34)
7. Too many unsent values (26:08)
In this post, the most common cases on proxy troubleshooting are considered, which will give you a quick insight on where you should look when something goes wrong.
Setup
Setup (installed from the packages):
- Zabbix 5.01,
- CentOS 8,
- Zabbix proxy on the same machine with the Zabbix Server,
- MariaDB database engine hosts Zabbix Server database, and Zabbix Proxy database.
- Three Zabbix server hosts (duplicated) in Configuration > Hosts,
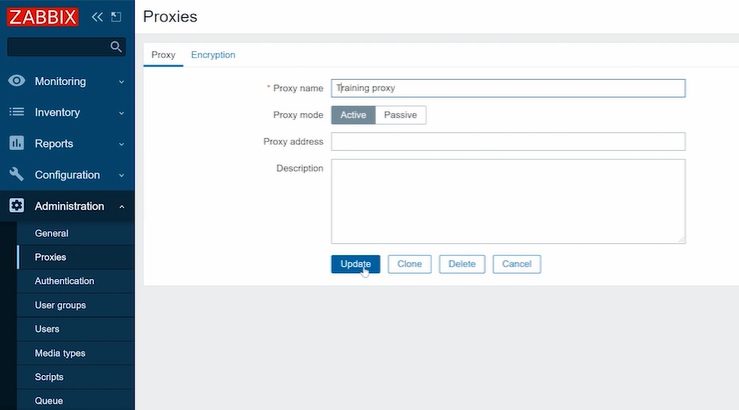
- ‘training proxy‘ — active proxy without encryption with compression turned on — added in Administration > Proxies.
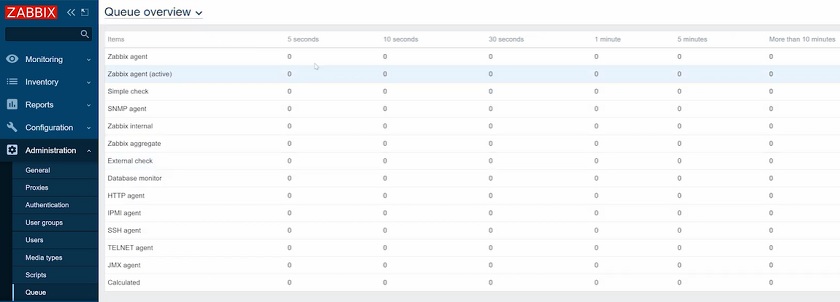
In Administration > Queue, the numbers growing, but considering the number of monitored items, no data is received from all items on my hosts.
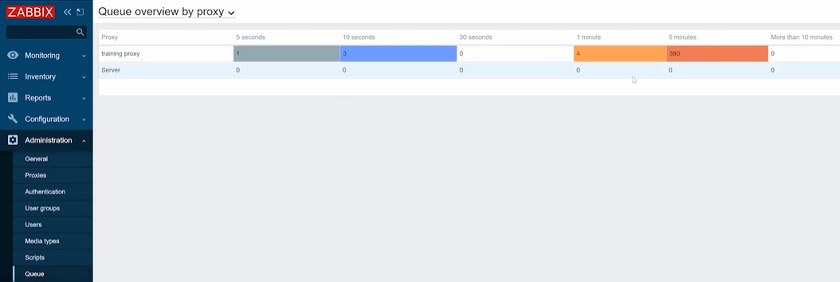
Queue overview
In the production instance, this would also lead to problems. In this case, all triggers with nodata() trigger function would fire and create a lot of problems.
Why the queue is growing?
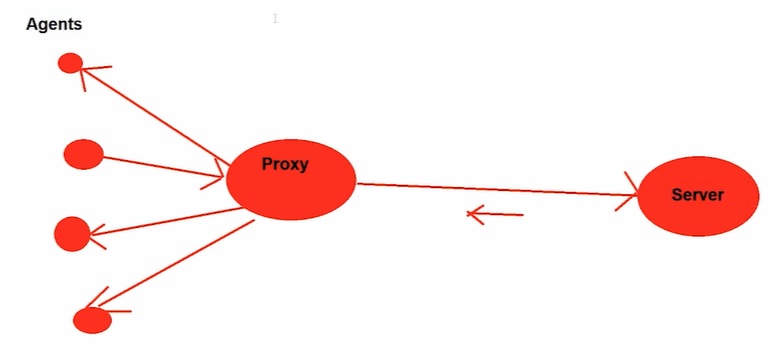
Zabbix Proxy is monitoring our Zabbix agents. Monitoring checks and types could be both – passive and active. Active checks mean that agents connect to proxy to request the configuration which will contain information what data should be collected. Grab that data on the host and pass it to proxy. Passive agent checks are working opposite way. Proxy is connecting to agents and polling for value that has to be collected. Proxy itself also could work in active or passive mode which also describes same connection specifics.
Misconfiguration
If we have an issue with the proxy, we should definitely check the proxy logs. Which means that we would need to have possibility to SSH to proxy server.
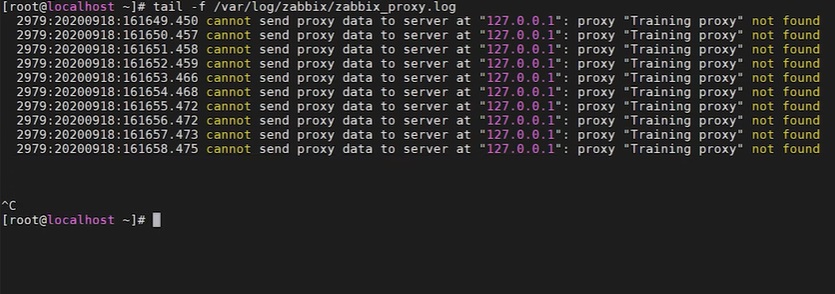
tail -f /var/log/zabbix/zabbix_proxy.log

‘cannot send proxy data to server’ message spamming
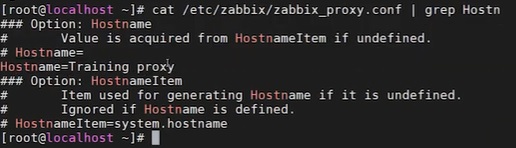
The message that proxy data cannot be sent to the server at the localhost IP address, because the proxy “Training proxy” is not found will appear only in one case — when the hostname parameter in the Zabbix proxy configuration file does not match the proxy name in the Zabbix frontend.
While we have the ‘Training proxy’ running, in the frontend, in Administration > Proxies, the ‘training proxy’ is specified in the lowercase. This is enough for the proxy to stop reporting the data to the server and start to write these errors in the log.
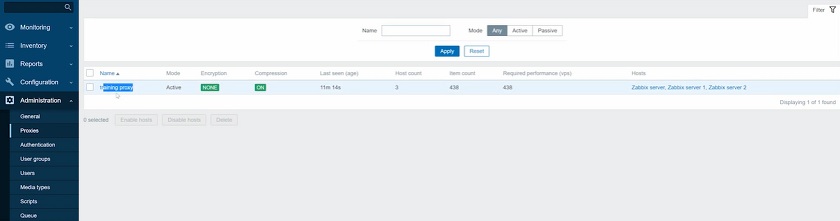
Different proxy name spelling
So, we need to change the proxy name and click Update.
Updating the proxy name
Then, to save us time to force reload of the configuration cache on the Zabbix Server, you may execute:
zabbix_server -R config_cache_reload
and then check the proxy logs. You’ll see that the message has stopped spamming. Note that server updates it’s configuration cache automatically every minute by default.
In Administration > Queue, no values are delayed, and all the data is processed.
Proxy queue overview
So, in misconfiguration cases, you need to:
a) check the log of the proxy, which in most cases will be enough, and
b) in rare cases, check the log of the server.
Proxy cannot connect to the agent
If the proxy is not able to get the data from an agent, it has nothing to do with the proxy-server communication or with the server itself. So, we need to check for some hints about problem in Proxy and Agent log files.
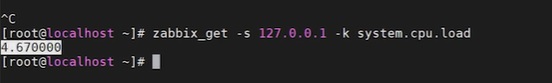
First, check the proxy. Most likely, in the logs you will see some ‘network errors’, ‘hosts unavailable’, ‘connection timed out’, ‘TCP connection problems’, or some similar errors. So, if there is an error message that connection is lost, for instance, to agent 1, but everything else is working fine, then the problem most likely is with the network. There might be some changes in the network that prevent the proxy from pulling the data from the agent. We can run zabbix_get from the proxy with the IP of the agent, which we are trying to troubleshoot, and some simple key to test connectivity.
If there are no problems, the agent should report back. If the agent is reporting but in the frontend we still don’t see any data, there might be other issues, for instance, if the proxy doesn’t have enough processes that are responsible for this monitoring type.
The agent might be simply stopped, crashed, or deleted. In this case, we would see error messages when running zabbix_get.

If we get this message, the proxy will not be able to get the value, and the problem is somewhere with a connection between the proxy and the agent or with the agent itself. In this case, we need to check the host, which we’re monitoring — whether the agent is running, or listening to the port, or whether there are some firewall rules that might be blocking the proxy connection to the agent. Maybe simply Server= IP address in the agent configuration differs from Proxy IP address
So, if the proxy can’t connect to the agent, you need to:
a) check proxy logs,
b) check agent logs,
c) isolate agents that are not working. If all agents are not working, then it’s a network problem,
d) use zabbix_get or snmpget (snmp problems) to test the connection between the proxy and the host.
Proxy cannot connect to the server
When the proxy cannot connect to the server, we might not see anything on the server log as the connection is broken and the server will not receive any data. We need to check the proxy logs where we’ll see error messages, such as ‘cannot connect to server‘ or ‘cannot send proxy data to server‘.
If the proxy can’t connect to the server, you need to:
a) check the proxy logs.
Proxy cannot send data fast enough
If there is a queue from the proxy but some data is going through, the proxy is able to connect to the server and to the agents, as the data is received and sent, though with a delay. This means that the proxy cannot keep up with the data flow, and the data in the proxy is piling up faster than it is sent. You can see the problem in the Latest data where the graphs will have gaps and dots.
To check for the problem, you need to execute ps ax | grep sender on Zabbix proxy host.
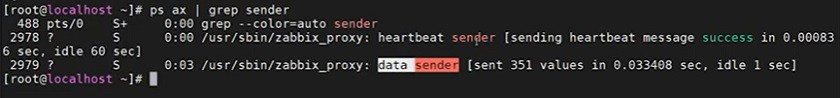
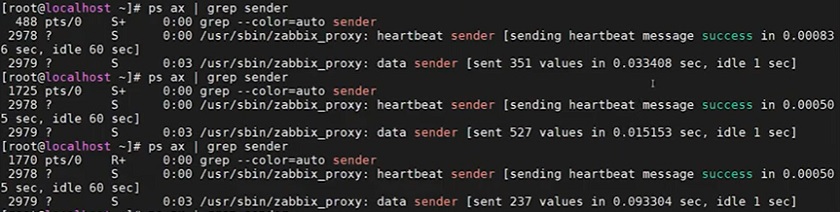
There is only one process — data sender on the Zabbix proxy, which doesn’t exist on the server and which is the only process responsible to send data to the server. Here, we are interested in the lines describing the sender. If we run the command multiple times, the lines describing the sender will be changing.
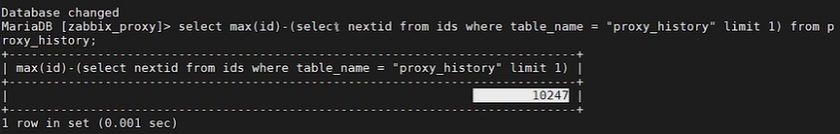
The problem exists, if we see that the number of values sent per second is not enough. One iteration of data sender takes hundreds of seconds or even more. In this case, we can open the database and run the query:
select max(id)-(select nextid from ids where table_name + "proxy_history" limit l) from proxy_history;
This query will tell us how many values in the proxy database are left that are not yet sent to the Zabbix server. Basically, that’s a backlog queue on the proxy.
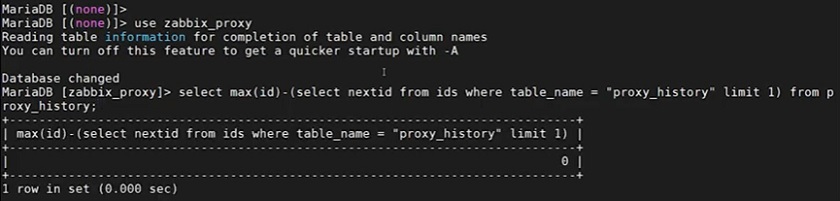
In the example above, everything works fine, the queue is not piling up.
if we would observe that it takes hundred of seconds for data sender to send values to server, most likely result from query would be not zero. And running query multiple times would show that backlog on the proxy is only increasing.

These problems might be for several reasons, one of them is a slow network connection between the Zabbix proxy and the Zabbix server. In this case, the ping is usually not enough to tell if the network is good or bad. If all the processes are not busy, but the data sender is struggling to send the data, then you should probably consult your networking team. It could also be a problem on Zabbix server side. Data sender is single process that is sending data to the server, but on the server side only Trappers are responsible to accept that data. So make sure that you have enough trappers on the server and that they are not 100% busy.
So, if the proxy cannot send data fast enough, you need to:
a) check data sender,
b) check the queue on the proxy database,
c) check the network connection speed.
Proxy doesn’t have enough processes
Suppose, we have a Zabbix server up and running, Zabbix frontend, and most of the environment is monitored through the Zabbix server.
In Administration > Proxies, we see that our Training proxy has only three hosts added.
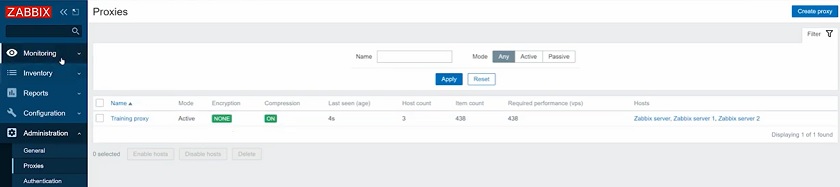
These three hosts are receiving data, there’s no queue and no data is missing. Suppose, in a month we need to deploy a network discovery or an active agent registration on the proxy and add more hosts to be monitored. We might end up with around 30,000 hosts when we’ll see the problems: gaps or the queue raising on the proxies.
If we check the server log, there might be nothing wrong in it — no problems, no slow queries. We can also go Monitoring > Hosts and display, for instance, the ‘internal process busy‘ graph.
Then the issue might be on the proxy. As we’ve added 30,000 new hosts, the number of processes on the proxy might not be enough for current amount of data going through proxy.

Processes running on the proxy
So, when we deploy 30,000 hosts, amount of processes we had previously is not enough for current setup. This problem will not be displayed in the server logs or the server graph. In this case, we need to monitor the proxy. To do that, go to Configuration > Hosts, create a host, add it to the group, specify that the host is monitored by proxy, and the proxy itself. Click Add.
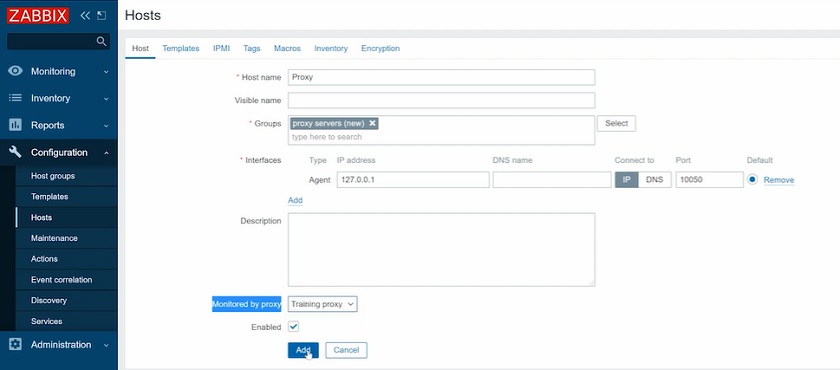
Adding host
NOTE. Users often specify the interface of the agent to the external address of the proxy, which is not exactly correct.
You’ll monitor the proxy with the template Template App Zabbix Proxy in Configuration > Templates. This proxy has internal items that don’t use the IP address specified in the Zabbix agent interface.
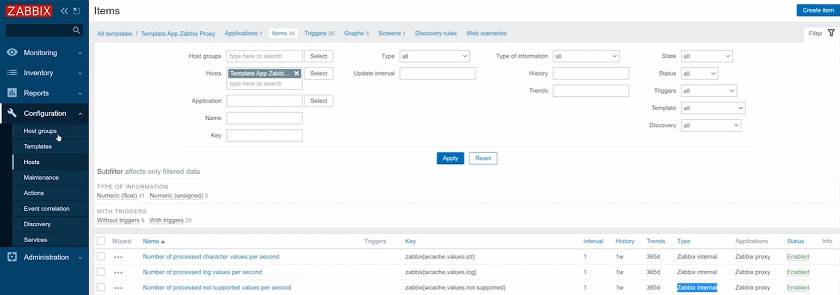
Internal items on the proxy
If you won’t configure this host to be monitored by the proxy itself in Configuration > Hosts, then you will still see the data on those performance graphs, but that data will be coming from the Zabbix server, and you might be misled by the Monitoring > Hosts graphs, data collector processes, and internal processes. So, you would actually see the data from the server, which might not be busy, while the proxy might be struggling. In this case, all you need is to add more processes as pollers, trappers, etc.
If the proxy doesn’t have enough processes, you need to make sure you monitor the proxy correctly and to check the performance graphs of the proxy:
a) data gathering processes busy,
b) internal processes busy, and
c) cache free percentage.
Server cannot keep up with the data
If the data is seamlessly pulled from the agents by the proxy, which then pushes it to the server, there might be problems on the server. We’ll be able to notice this in the logs of the server where we most likely would see some slow queries or timeouts. Most importantly, we will see the same information in the performance graphs in Monitoring > Hosts.
Here, we need to check, for instance, ‘data gathering process busy‘.
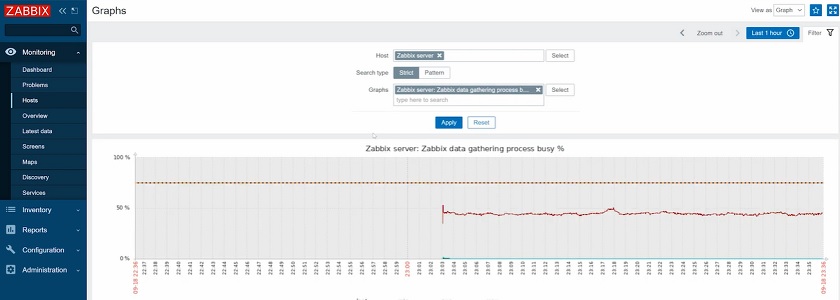
‘data gathering process busy‘ performance graphs
More specifically, we interested in the trappers, as only trappers are operating with active proxies that we are considering in this example.
So, if trappers are completely busy, most likely the only thing you need to do is simply increase the number of trappers.
If trappers are busy, but in ‘Zabbix internal process busy %‘ graph we see that housekeeper, history sinker, and basically most of the graphs are running with a 100% load, and there are some dots and gaps in the graph, this means that you have serious performance issues with the Zabbix server. In 99% of cases, this will be caused by database performance issues and the problem with the Zabbix setup.
So, if the server cannot keep up with the data, you need to:
a) check the server logs,
b) check server performance graphs,
c) check for slow queries in the log. If you see slow queries to insert the data in the history table, then it is the database that is not keeping up.
Too many unsent values
Sometimes, any of the above problems can cause the proxy to collect a backlog when the queue not dropping or dropping extremely slow after the problem is fixed. In this case, we can run the query to check the backlog on the proxy database.
If you see, for instance, millions of values, then the proxy is not functioning for some period, has a huge backlog in the database, and the queue is still piling up. In this case, the only thing that we can do is to drop the backlog — delete all the data stored in the proxy database and start from scratch. We’ll lose the unsent data history for that period, but at least you will get back to monitoring.
To do that, we need:
1. stop the Zabbix proxy,
systemctl stop zabbix-proxy
2. open the database,
mysql
3. Tuncate two tables — proxy history query and IDs,
truncate proxy_history;
truncate ids;
4. exit from the database and start Zabbix proxy,
systemctl start zabbix-proxy
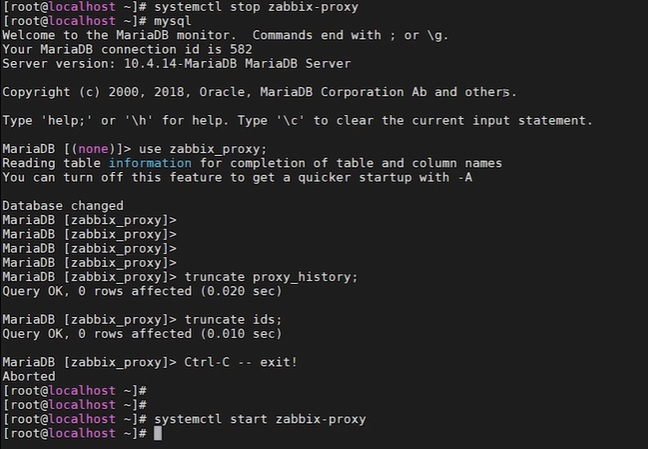
Dropping proxy backlog
5. reload,
zabbix_server -R config_cache_reload
6. open the database,
mysql
7. use Zabbix proxy,
use zabbix-proxy;
and in the query, you will see no backlog.
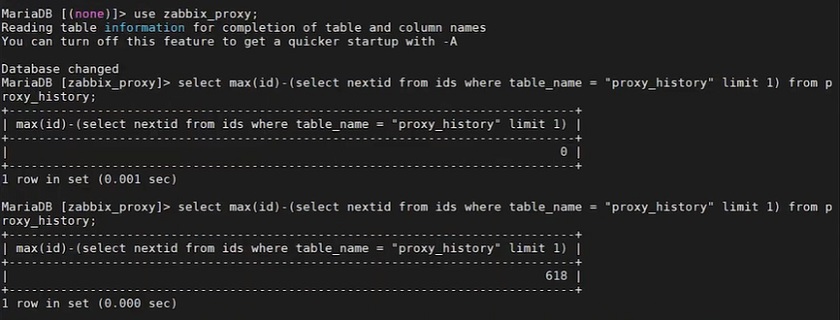
Proxy backlog dropped
NOTE. Don’t forget to truncate IDs table. If you truncate only proxy history tables, nothing is going to work.
So, if there are too many unsent values and the proxy queue is piling up, you need to drop the backlog.
—
Watch the video


Hi Dmitry,
Is there any solutions, why the graph on my zabbix always delayed (about 1-2 hours) and this always happens at night. The following is a description of the topology: device/agent -> zabbix proxy (2 poller/zabbix proxy) -> zabbix server -> database server. I’m using zabbix server version 4.2.0 and the database is using postgres 9.6. When the graph is delayed and I check for the performance of the zabbix proxy, the history syncer process is always above 70% and a maximum of 100%. Here’s the configuration on zabbix_server.conf:
StartPollers=50
StartPollersUnreachable=25
StartTrappers=10
StartPingers=50
StartDiscoverers=5
StartAlerters=5
HousekeepingFrequency=0
CacheSize=8G
CacheUpdateFrequency=900
StartDBSyncers=25
HistoryCacheSize=2G
HistoryIndexCacheSize=2G
TrendCacheSize=2G
ValueCacheSize=24G
Timeout=3
Really appreciate for any answer and your advice.
Thank You.
Hi,
this post has been a great help to debug issues with our zabbix servers and proxies, but since a few weeks we have seen our queue growing a lot without finding why… It was a discovery rule over zfs snapshot which were creating unsupported items (they were working during tests ofc). I’ve looked a lot and didn’t find anyone having this issue and i thought it would be great if you talk about it in your troubleshout docs
regards