Dashboard widgets have received substantial improvements in the latest Zabbix releases – everything from brand-new widgets to greatly expanding upon existing widget features. The post will cover some of the new improvements as well as lesser-known dashboard and widget features, while discussing multiple dashboard use cases targeted at large organizations and MSPs.
Table of Contents
Broadcast and listen capabilities
Zabbix widgets can be used to not only display static data, but they can also be linked together by using widget broadcast and listen capabilities. Depending on the built-in capabilities, widgets can either broadcast data (such as the item, host, event, or time interval selected in the widget) or listen and display the selected data points – multiple widgets support both broadcast and listen capabilities.
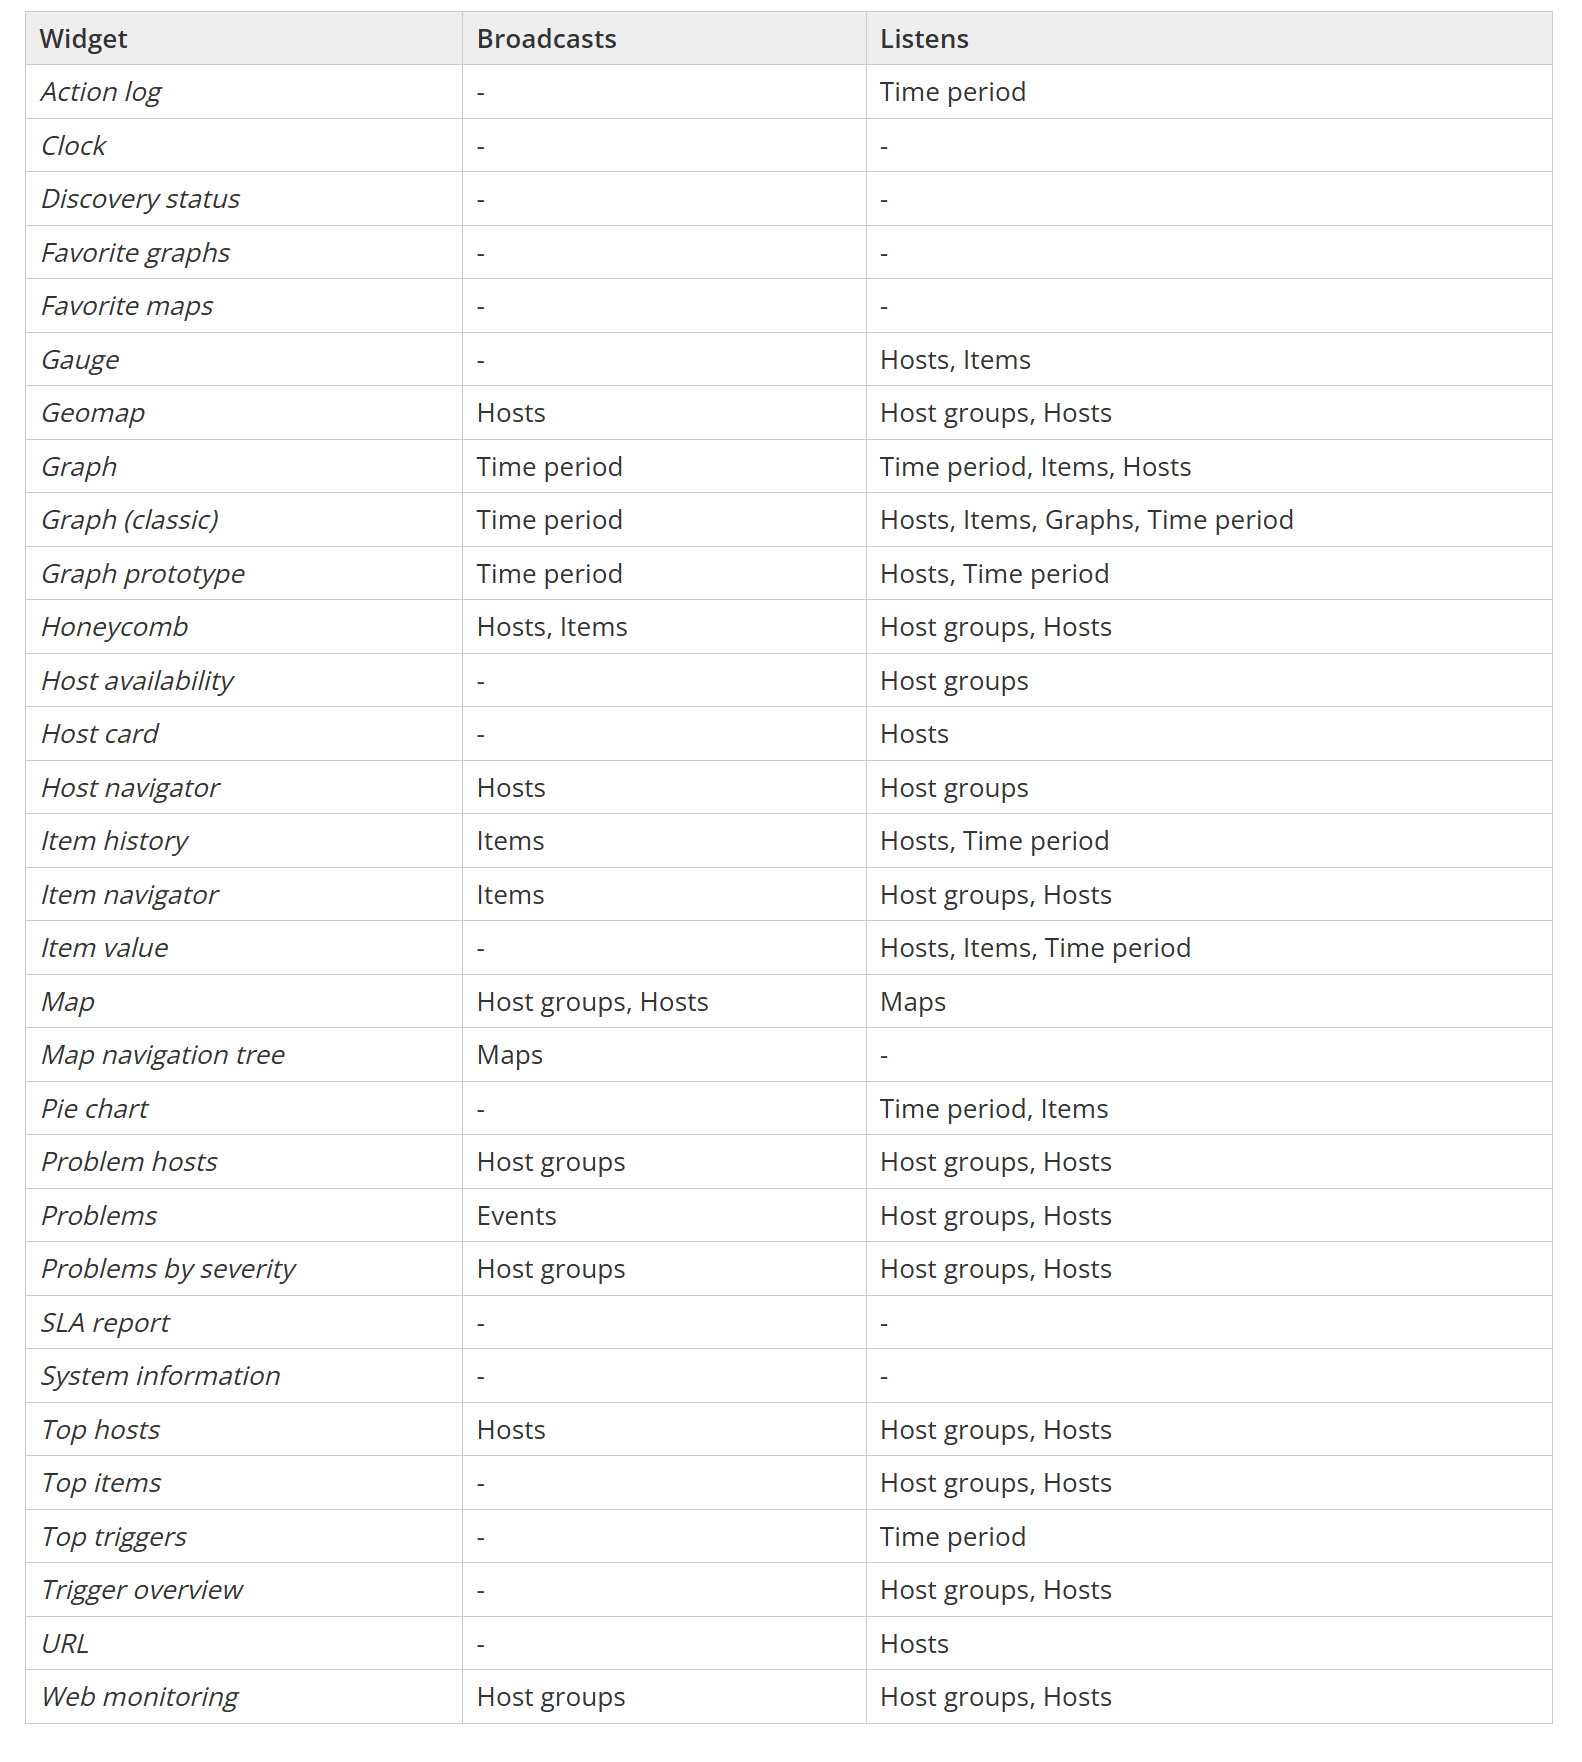
Widgets can broadcast and listen for the following entities:
- Hosts
- Host groups
- Time periods
- Items
- Events
- Maps
Zabbix documentation contains the full list of widget broadcast and listen capabilities.
Navigator widgets
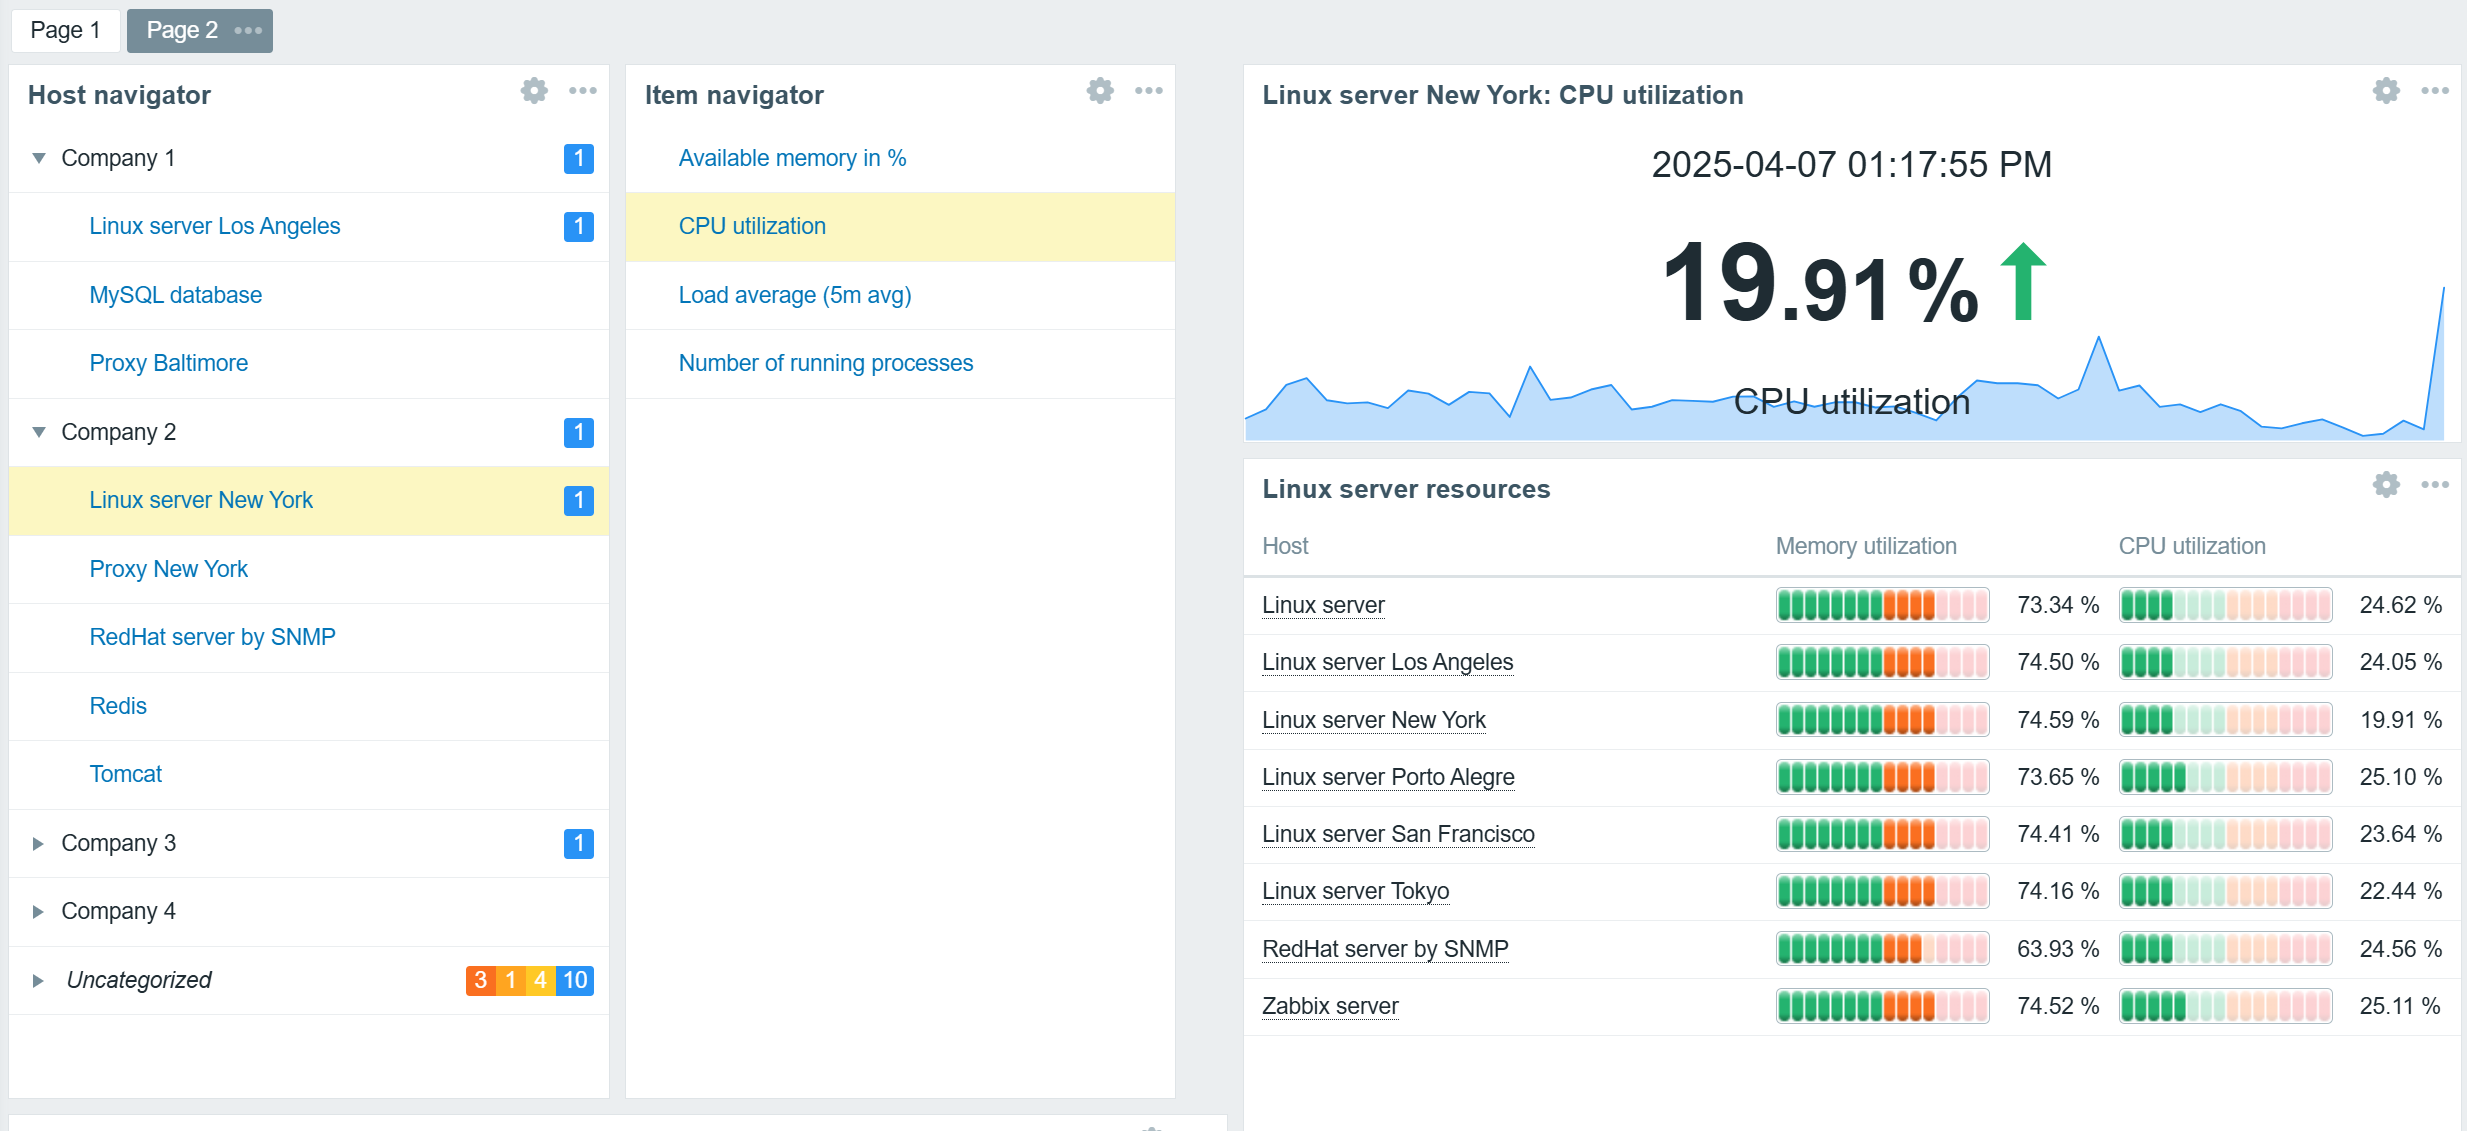
Host and Item navigator widgets serve as simple examples of broadcast widgets. The sole purpose of these widgets is to display an organized, interactive list of hosts or items. The selected hosts and items can be broadcast to other widgets such as graphs, gauges, problem widgets, an item value widget, and many others.
In addition to regular widget filters based on hosts, host groups, and tags, navigator widgets can be configured to group hosts or items based on tags, host groups, and existing problem severities. This can be used to provide an organized overview of hosts or items based on MSP clients, organization departments, and any other grouping.
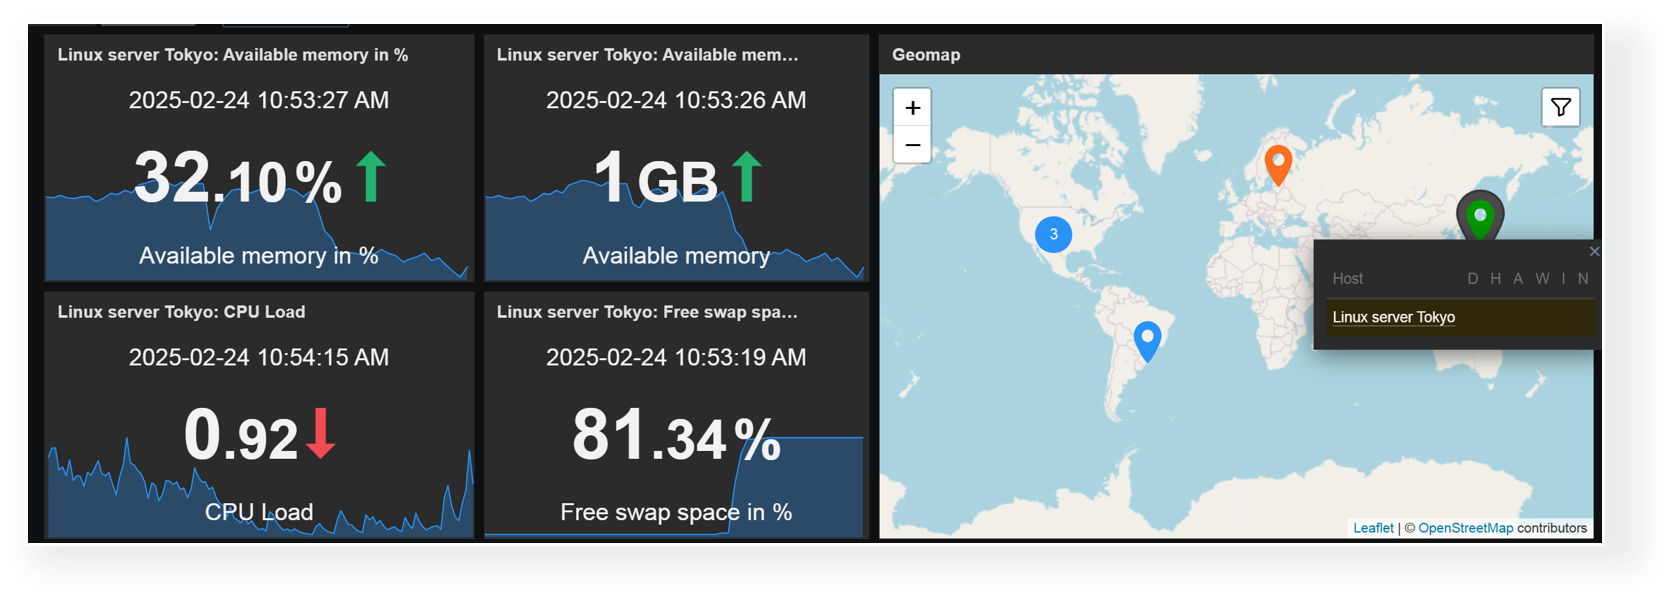
Any combination of widgets from the above table can be used to create interactive dashboards. For example, you could combine the Item value widget listen capabilities with the Geomap widget broadcast capabilities to display item values for hosts selected on the Geomap.
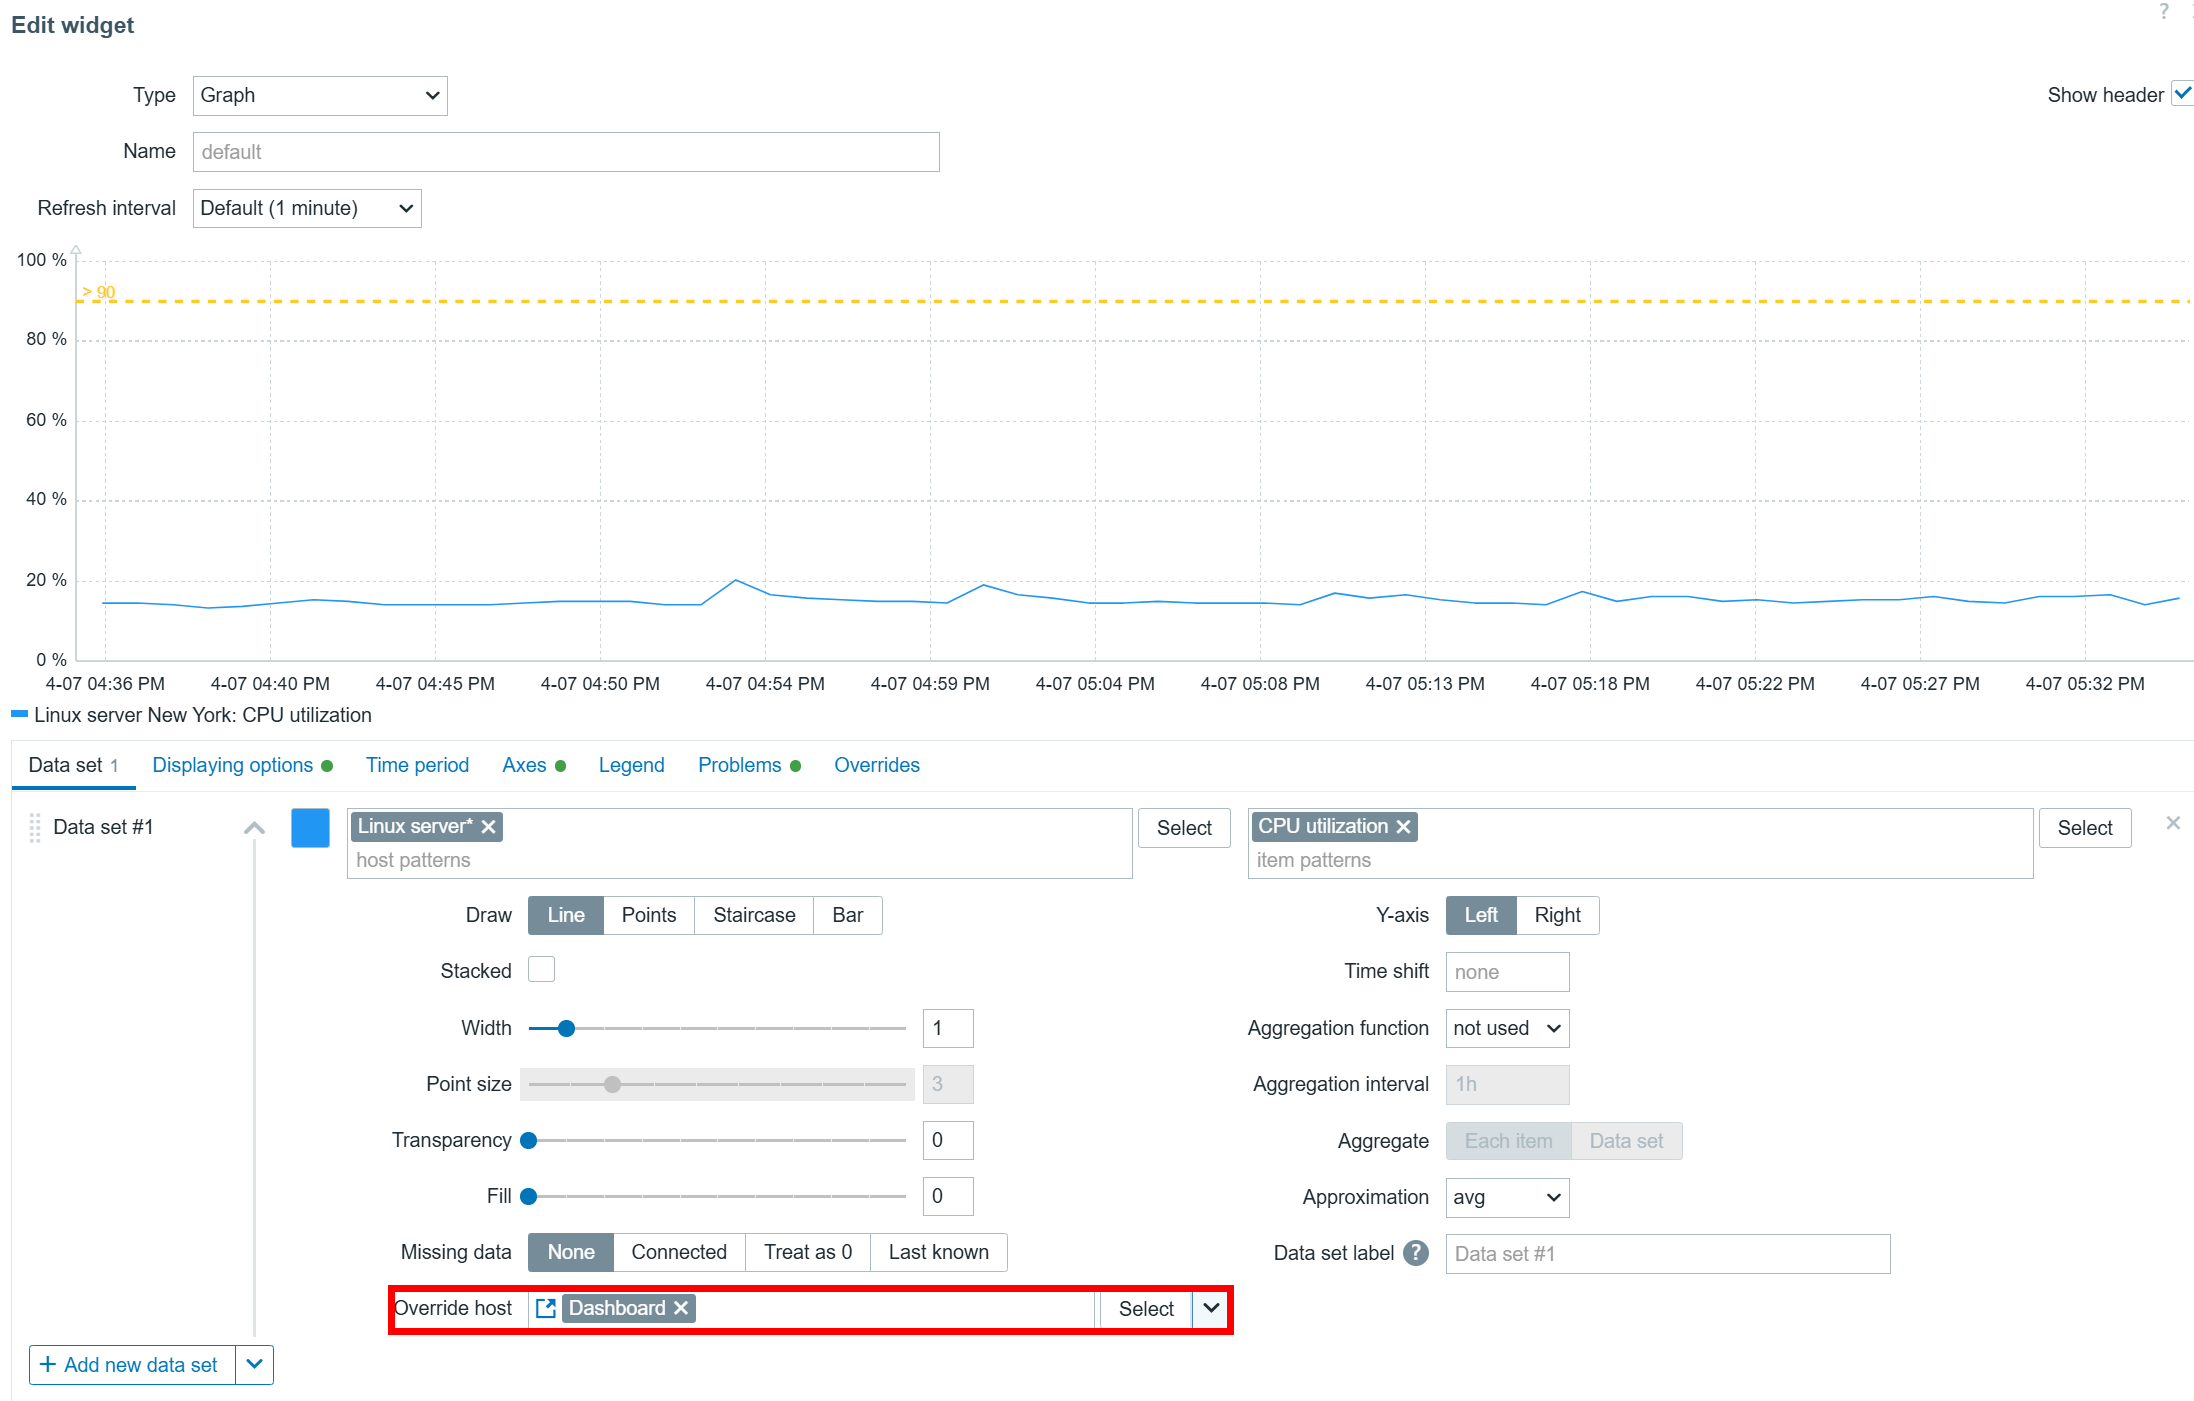
Dashboard-level host broadcast
Host overrides can also be performed on a dashboard level. Once you have set the Override host setting in your widgets to Dashboard, you can select the host in the top right corner of the dashboard. After the host is selected, the widgets will start displaying information related to the selected host.
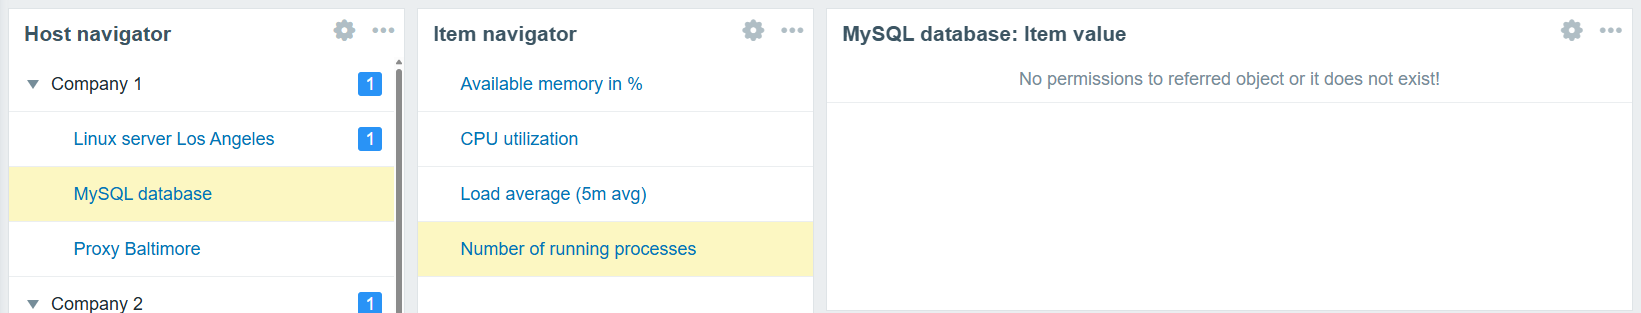
Selecting non-existing items
One final thing you should consider when implementing widgets with host/item sources from broadcast widgets is what happens if the selected item does not exist on the selected host. In that case, your widget will display a message “No permission to referred object or it does not exist!” – the same error message the users will see if they lack the read permissions on an item. Ideally, you’d want to define widget filters and broadcast/listen configuration in a way where such errors can be avoided – especially if Zabbix is used as a central monitoring hub for users from multiple departments or organizations.
Advanced graph widget use cases
The Zabbix graph widget has a variety of advanced features that can enable many new use cases and provide new insights based on the collected item values.
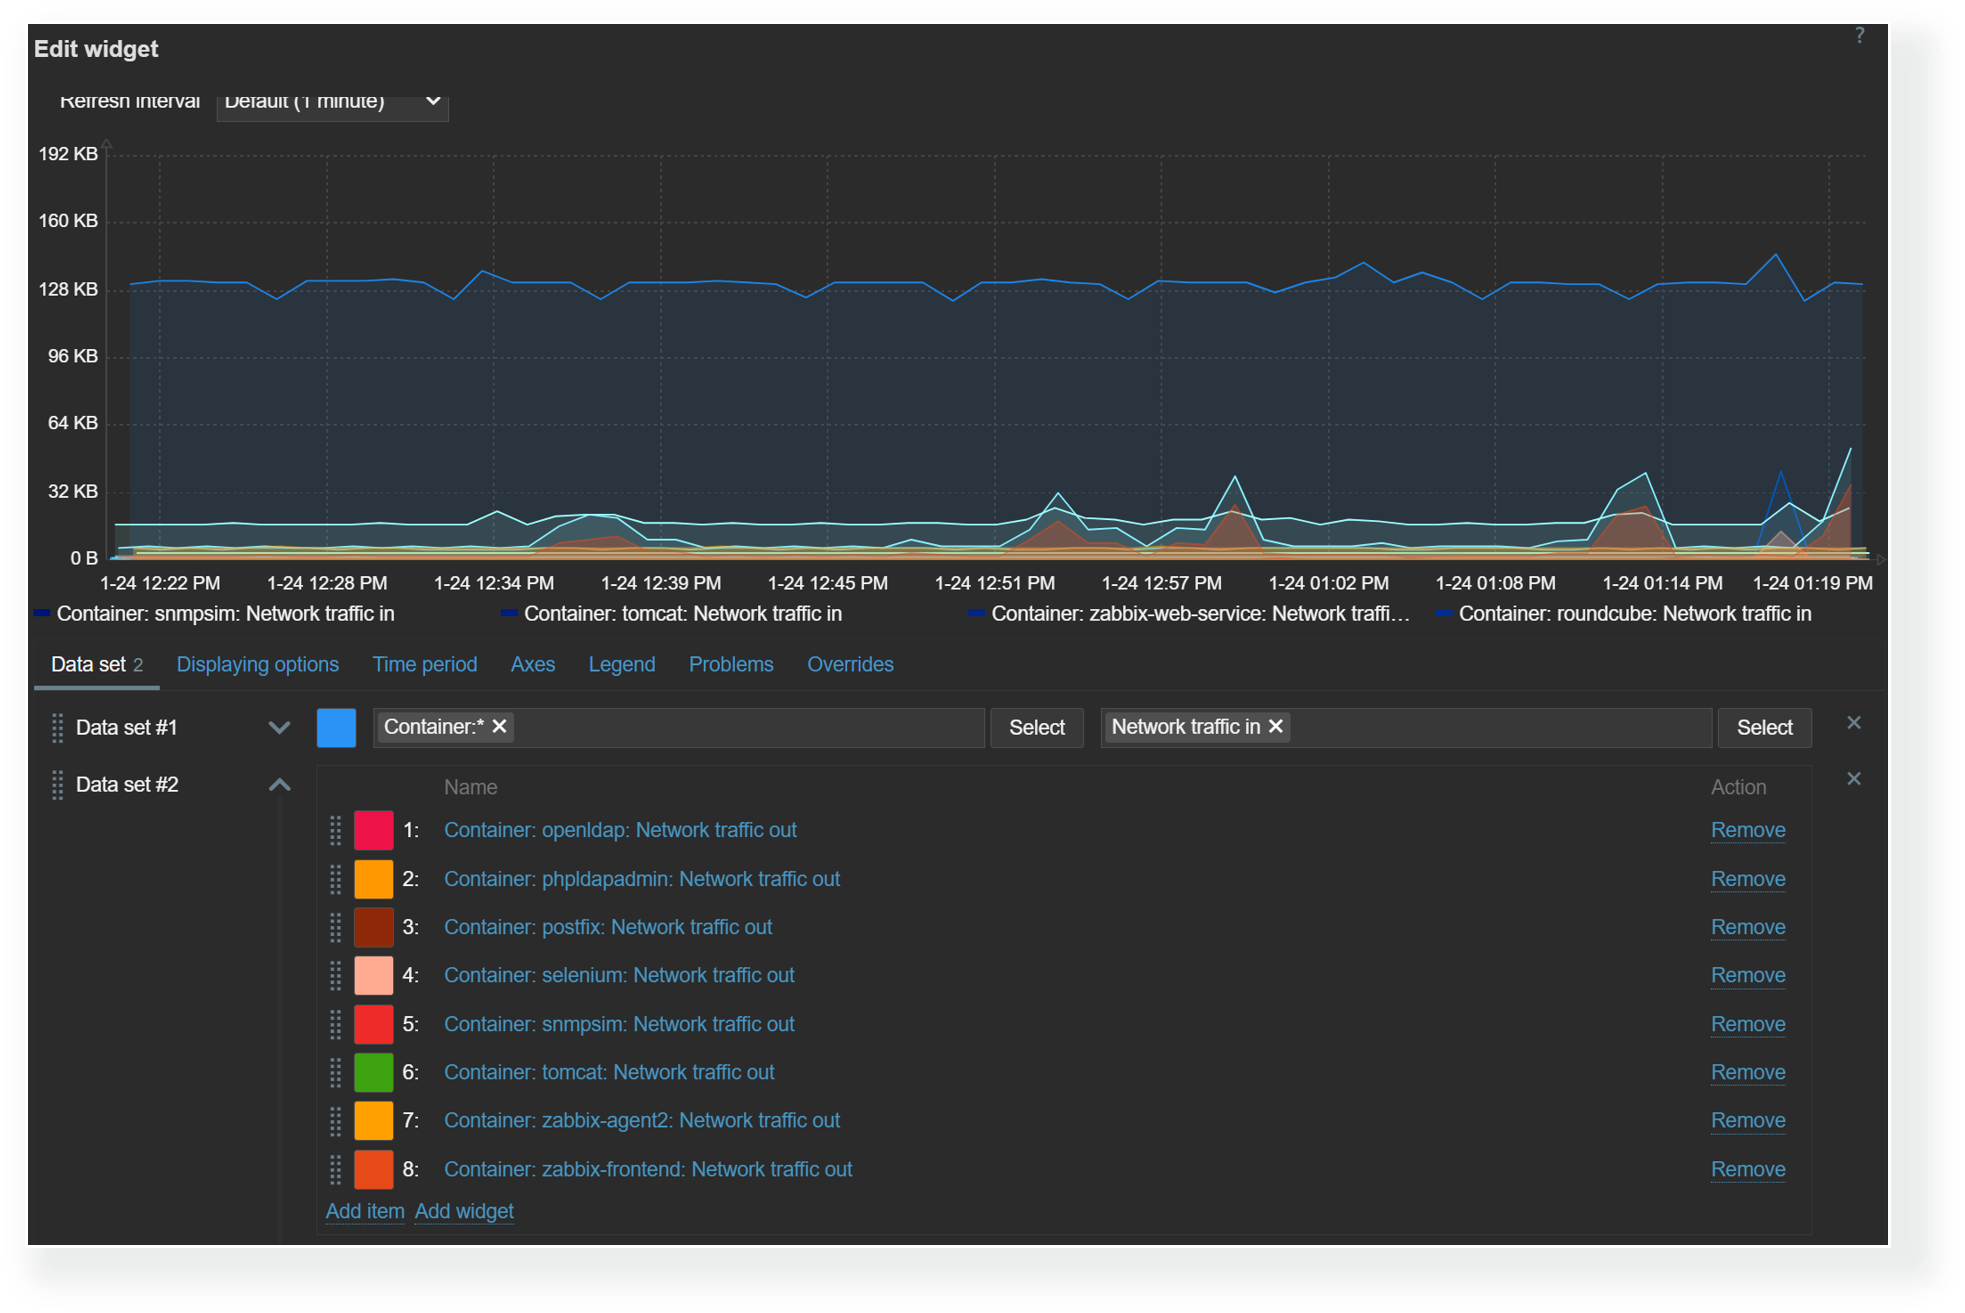
Data sets
The graph widget utilizes data sets to select, match, and group items that would be displayed in the graph. There are two types of data sets – item pattern and item list. When using item list data sets, you have to individually select each item that you wish to display on the graph. On the other hand, item pattern data sets provide more flexibility. Here we can utilize wildcards in host and item names to match items and hosts by name. This is especially useful for items discovered by low-level discovery in dynamic environments. With item pattern data sets, the addition or removal of items matching the pattern will be automatically reflected in the graph.
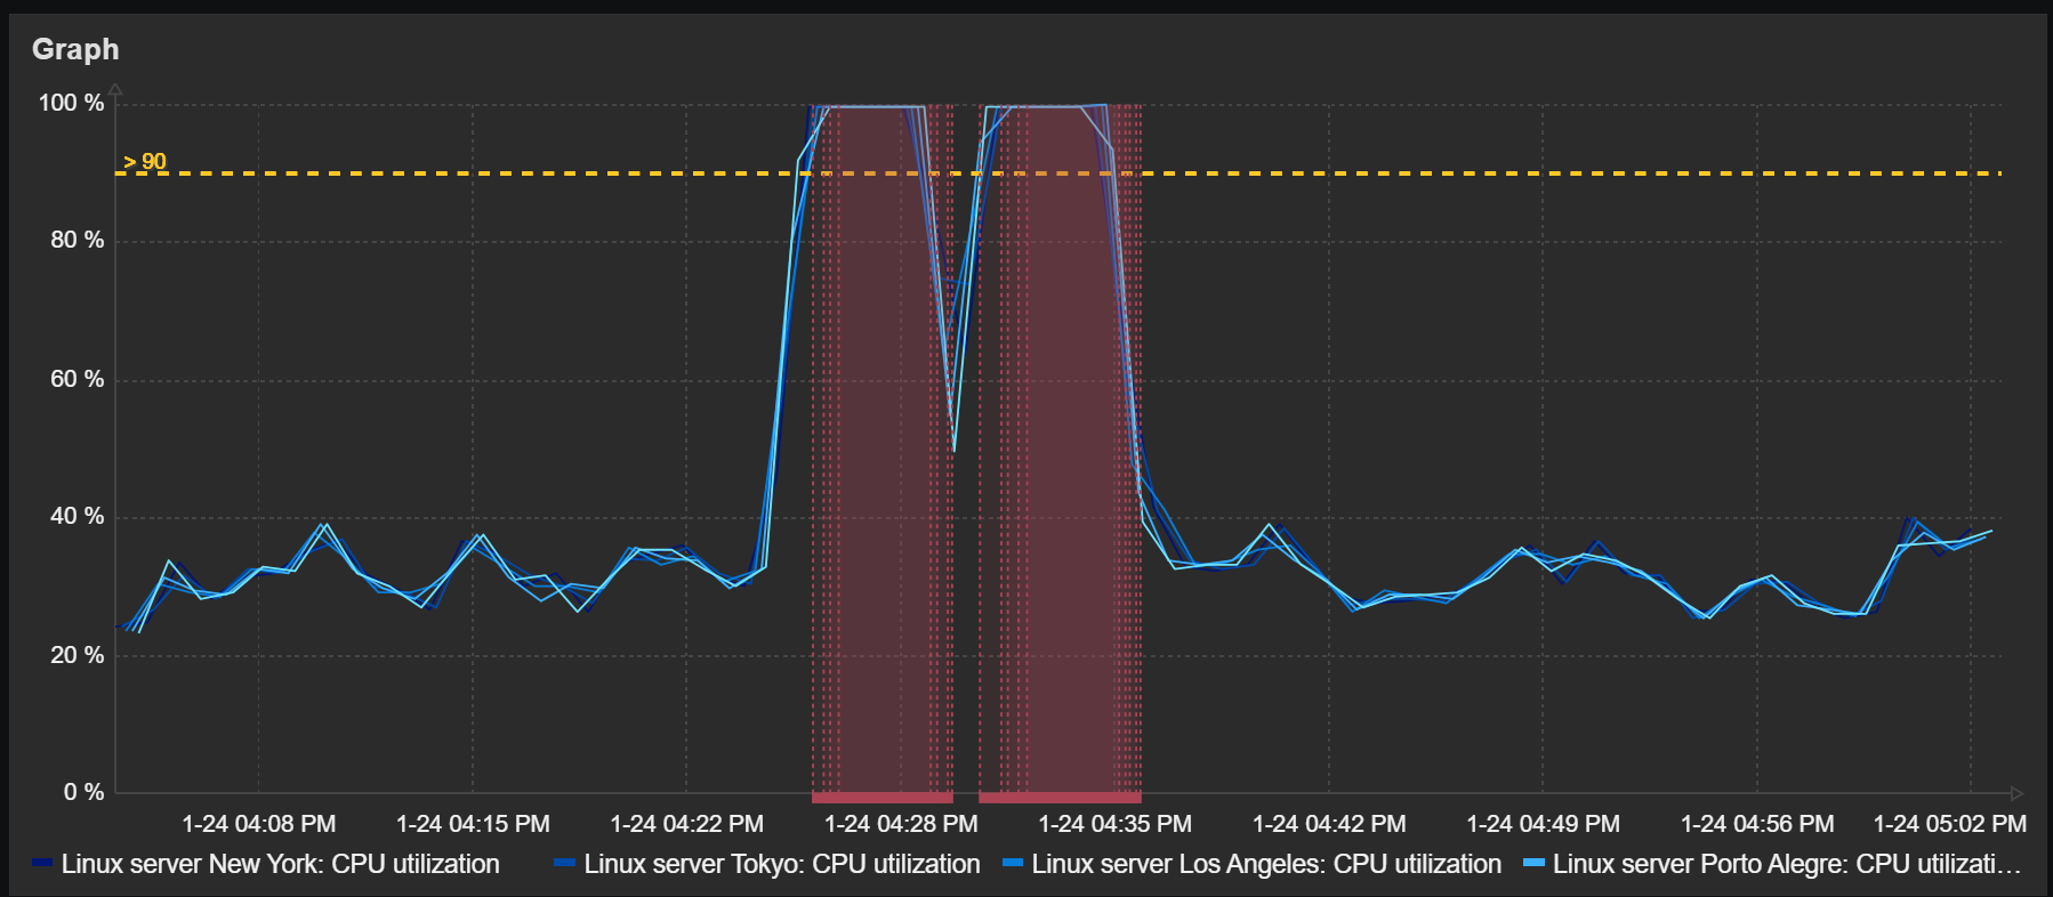
Trigger and problem display
Detected problems and trigger thresholds can also be displayed in dashboard graph widgets. The time periods during which a trigger related to the displayed items has been in a problem state will be highlighted in red. The graphs also provide an option to display a trigger line for triggers utilizing last, min, max, and avg functions.
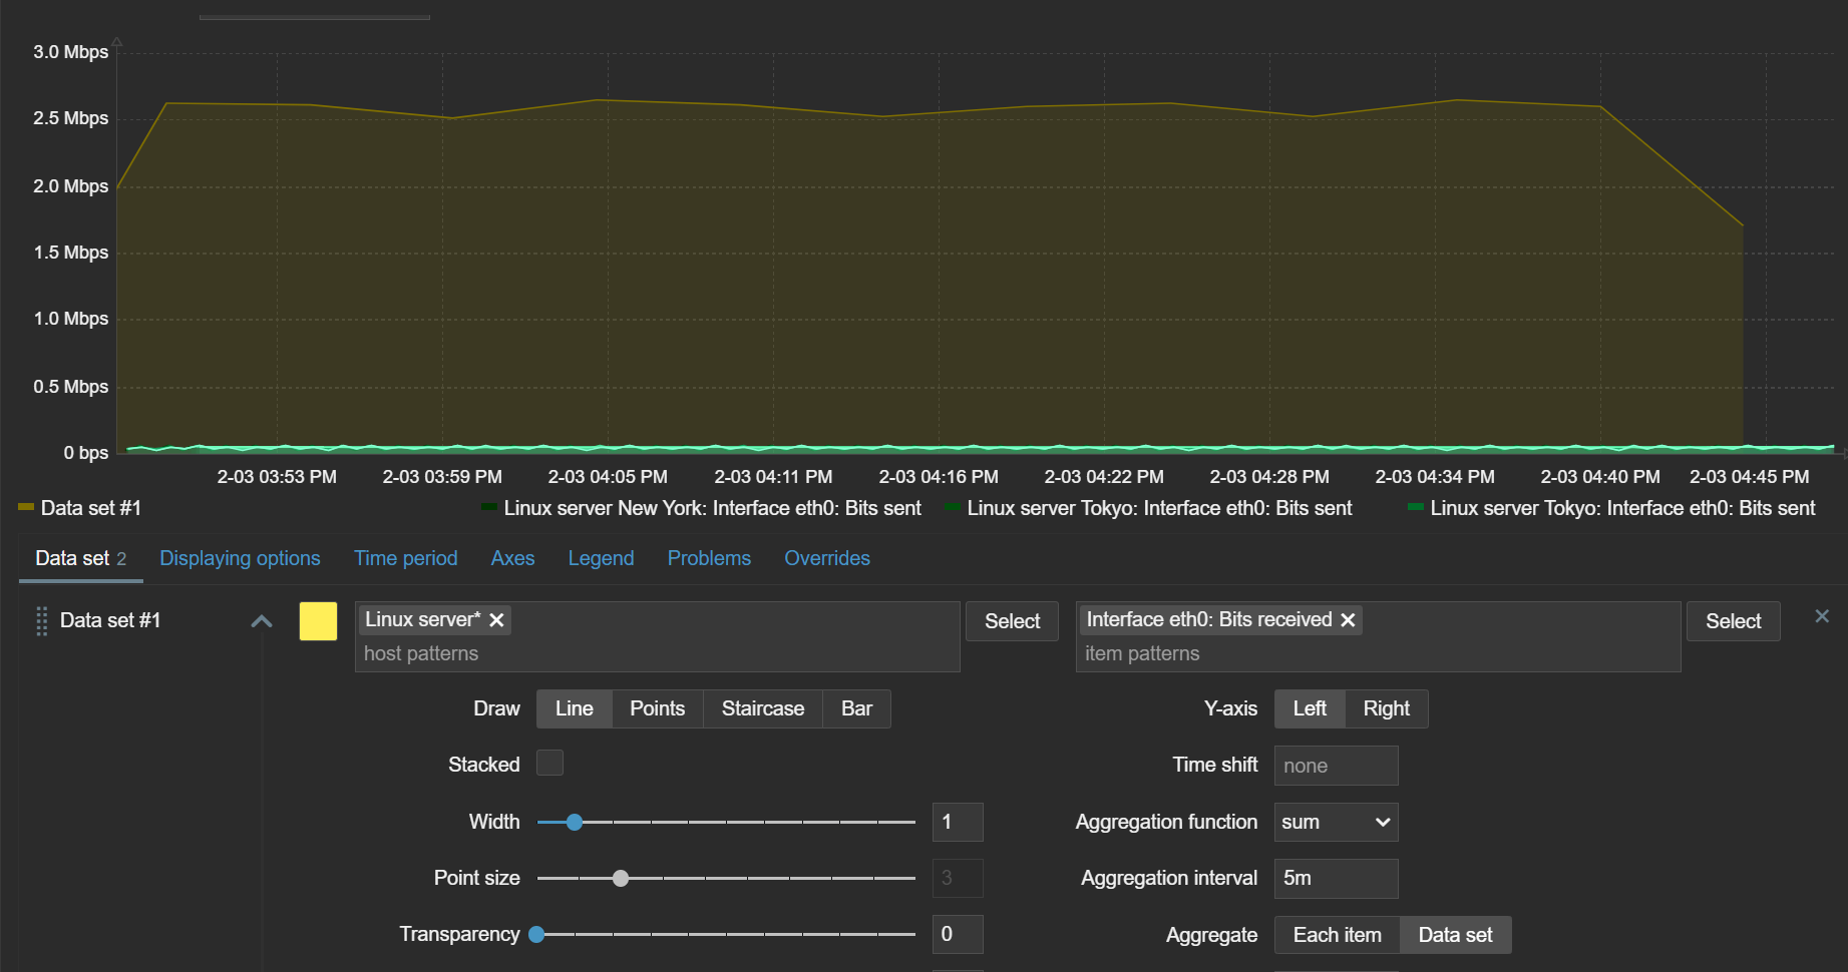
Aggregation
The ability to aggregate data directly within the widget can be an extremely useful tool for gaining new insights from existing data. With graph widget aggregations, it is possible to aggregate each individual item (for example, displaying hourly averages for network traffic on each interface) or the whole data set (total hourly traffic from all interfaces).
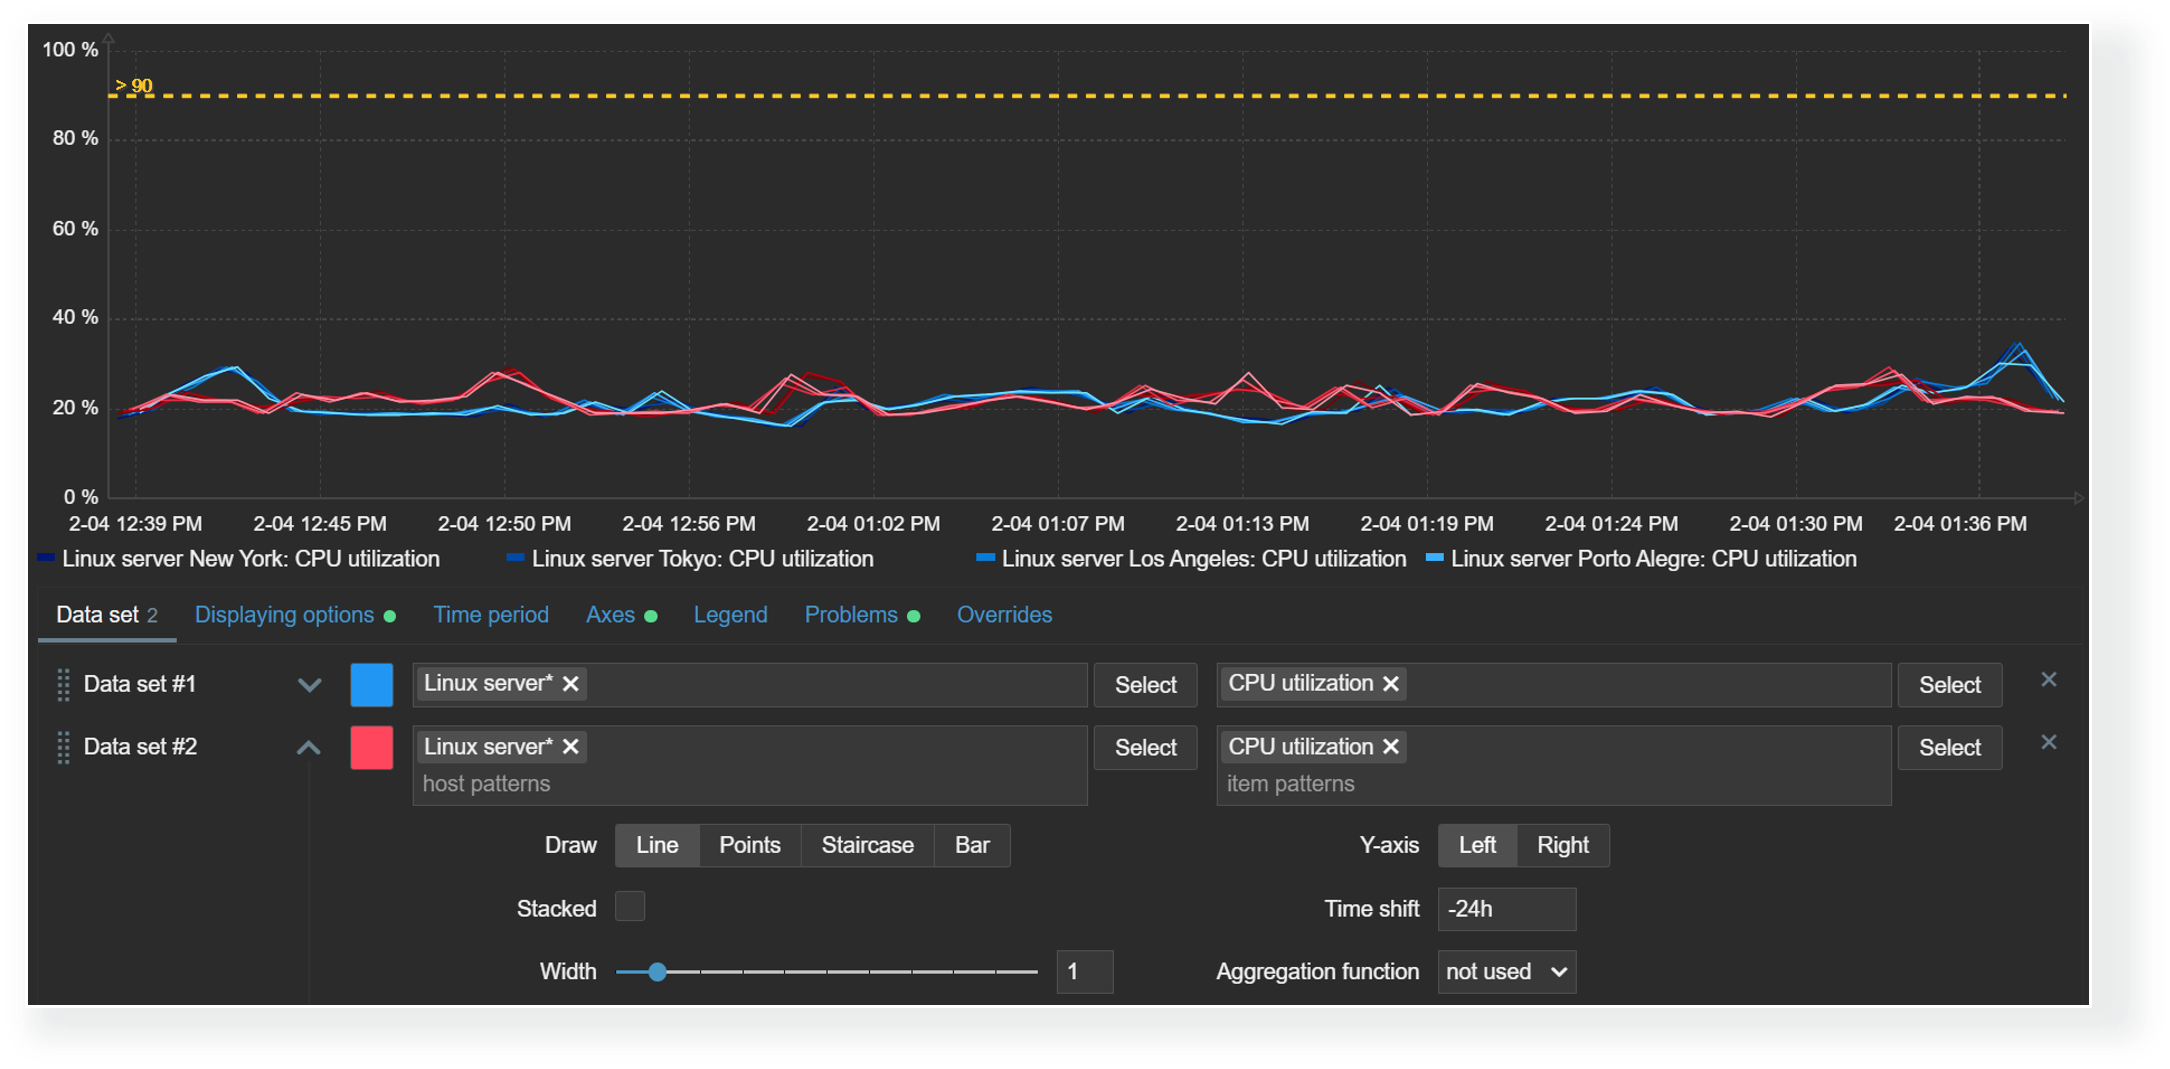
Time shift
The time shift feature is useful for visually comparing current values with values collected some time in the past. For example, we could compare the current CPU load on our application server with the CPU load for the same time period yesterday. This could allow us to detect unexpected deviations just by glancing over the graph.
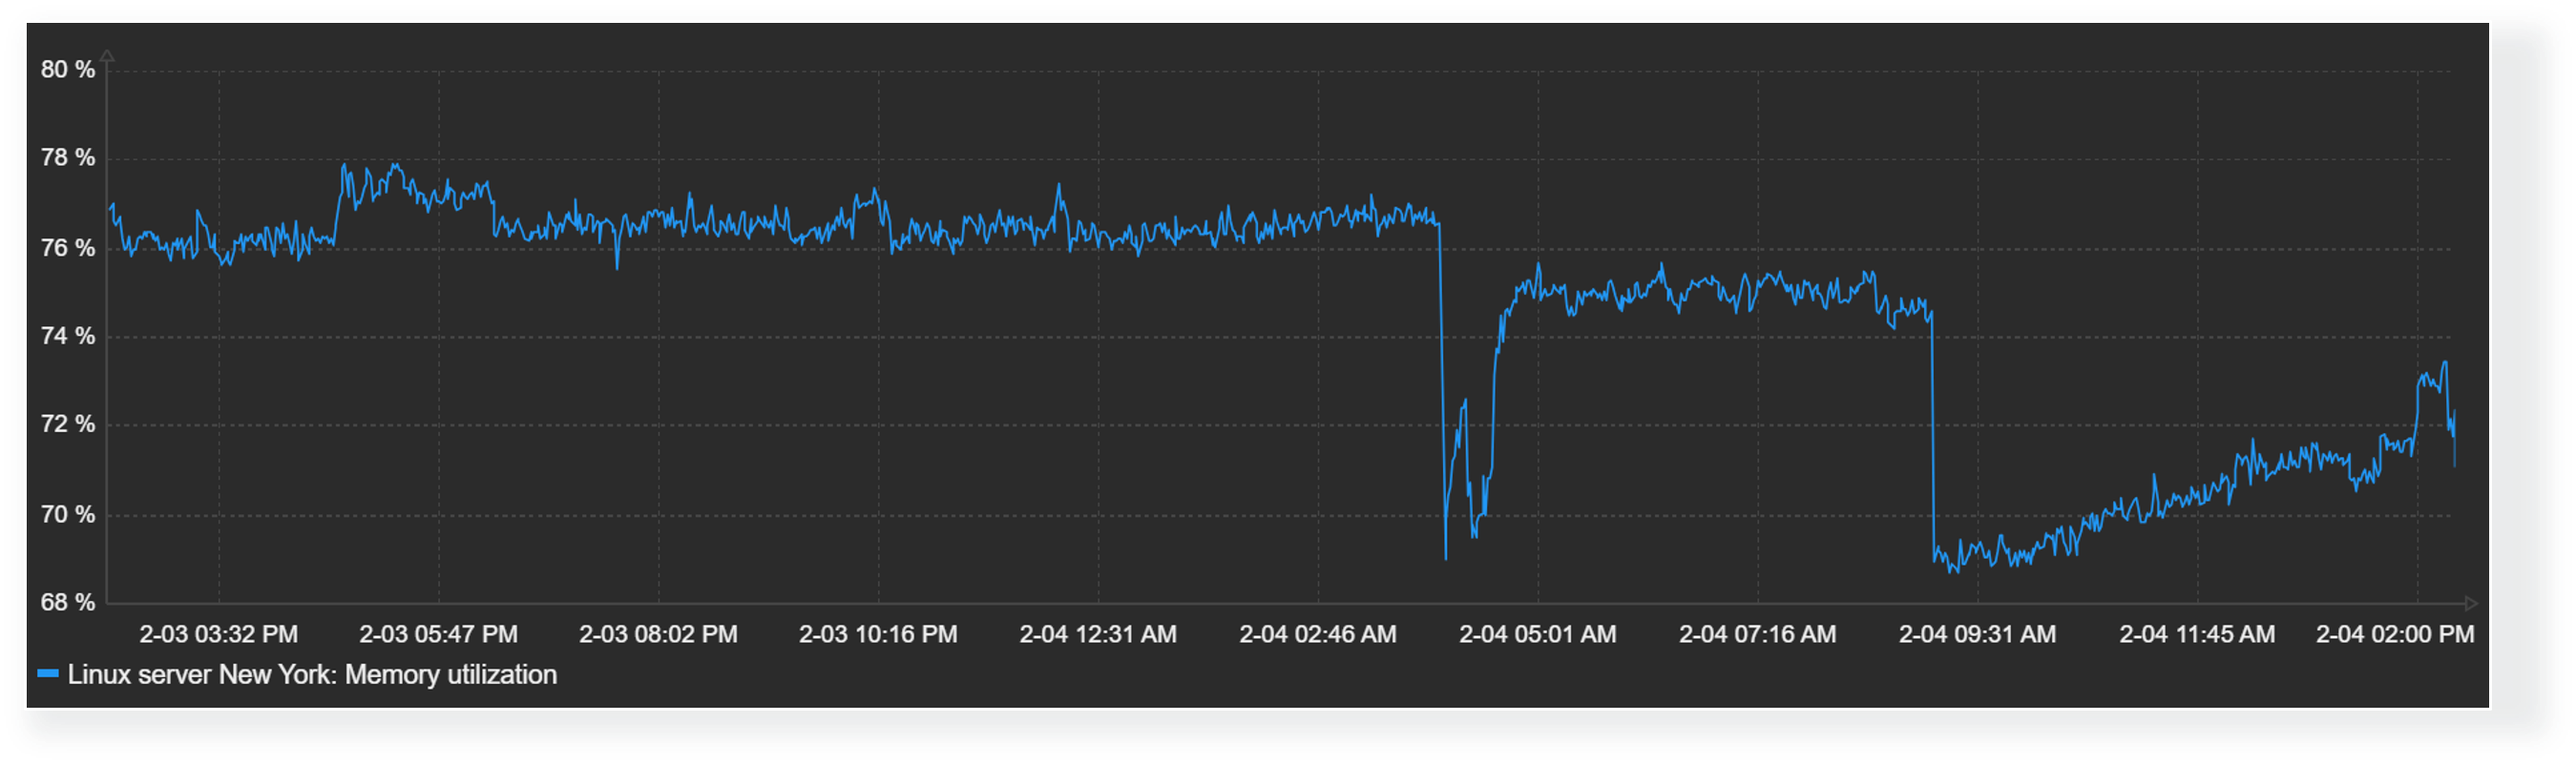
Missing data
Finally, the graph widget enables Zabbix users to choose how they wish to display missing values. Values for items could be missing for a variety of reasons – anything from data collection errors to various preprocessing workflows that could discard item values by design. Accordingly, it makes sense to design your graphs with the correct representation of missing data in mind.
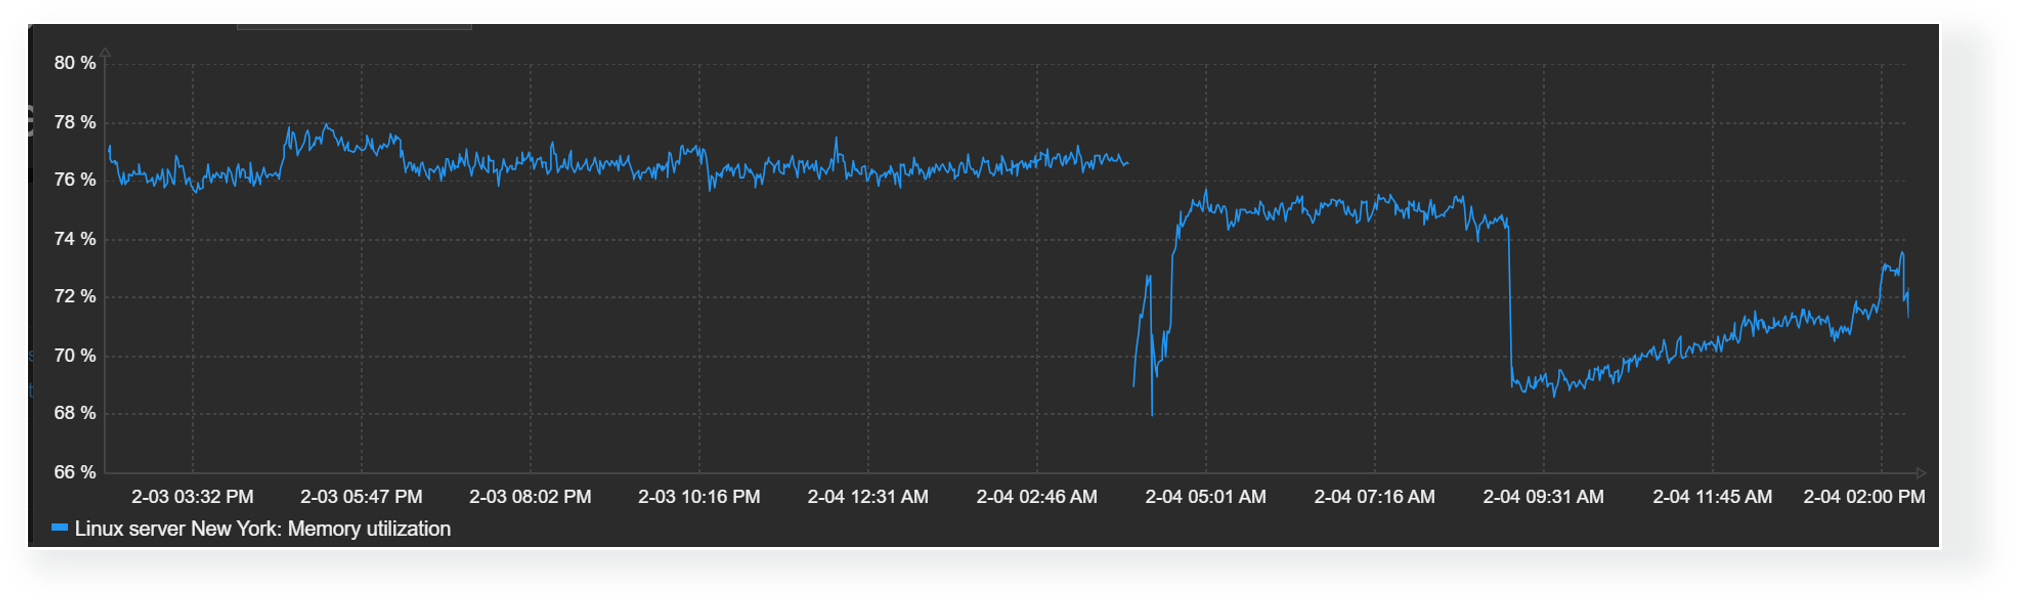
Missing values in graphs can be displayed in the following formats:
- Treat missing values as 0
- Do not display missing values
- Connect the last known value with the current value
- Treat missing values as the last known value
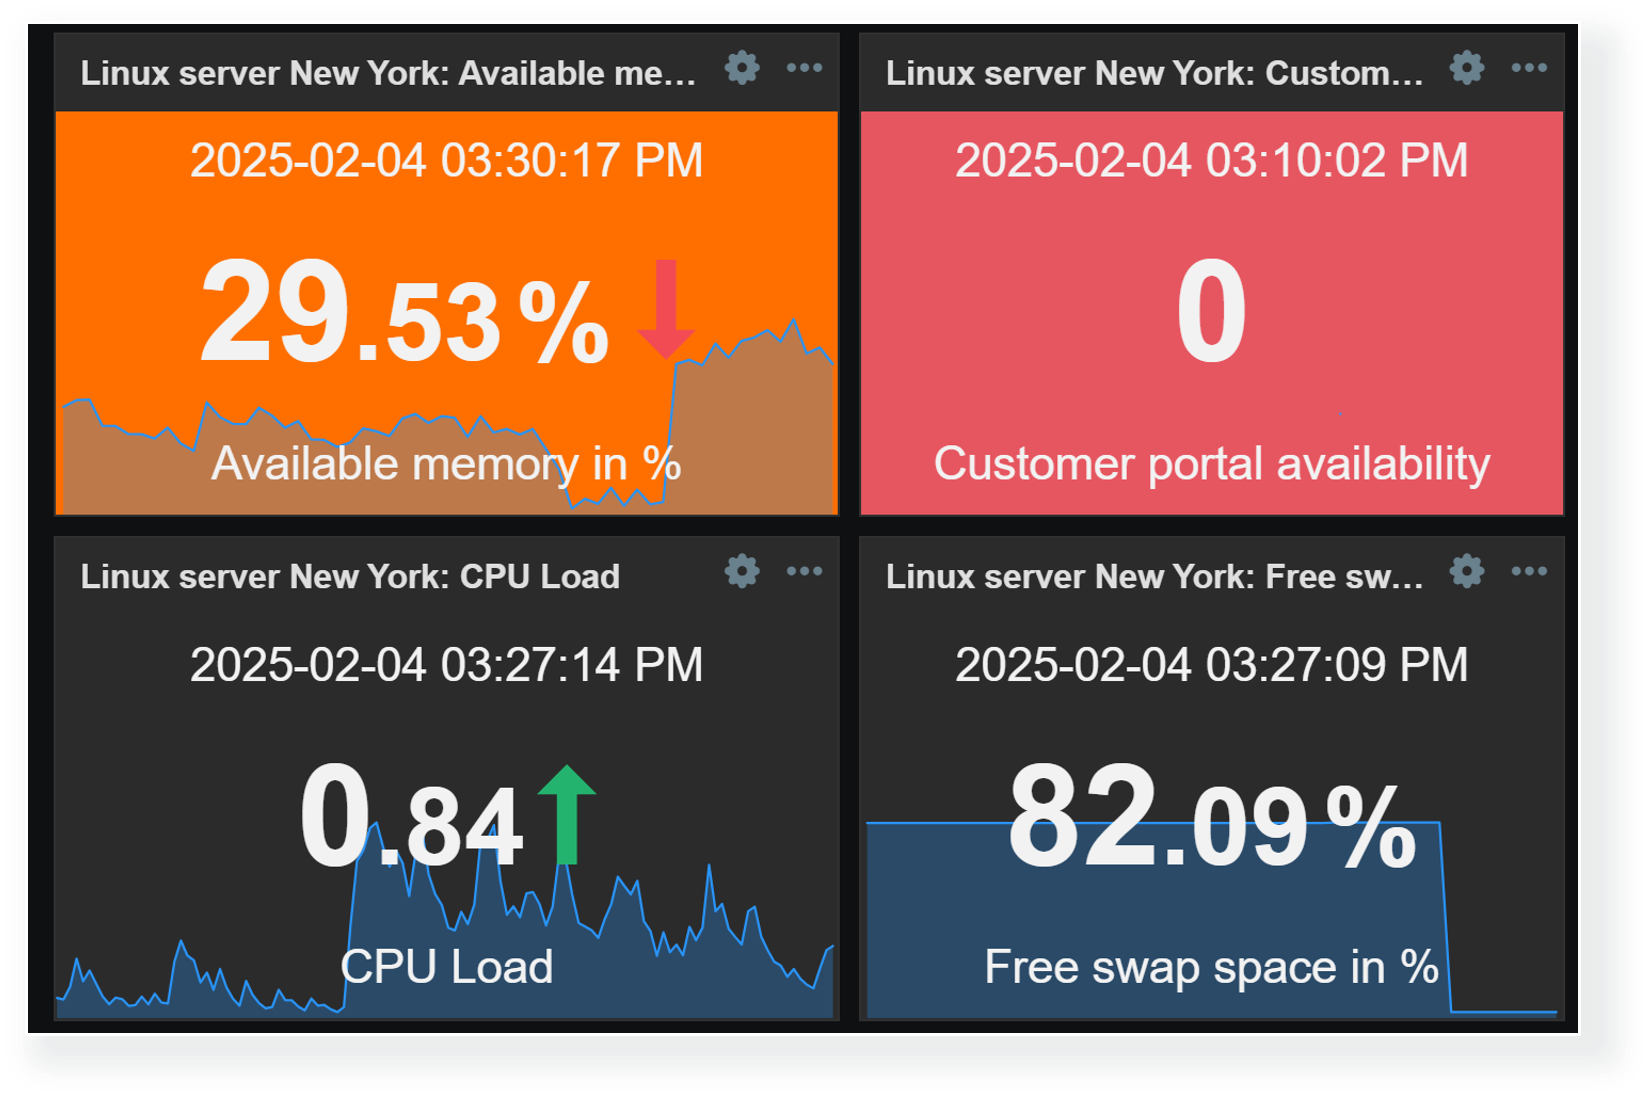
Defining widget value thresholds
Threshold values can be defined for multiple widgets to make the visualization of data more dynamic. This way, Zabbix dashboards can instantly highlight resources exceeding warning/critical thresholds, services in unexpected states, unreachable endpoints, and a variety of other issues. As of Zabbix 7.2, widget thresholds are available only for numeric item values.
Widgets with threshold support
Multiple widgets provide the ability to define value thresholds:
- Item value
- Gauge
- Top hosts
- Top items
- Honeycomb
Thresholds can be defined in widget configuration. By defining one or multiple thresholds, we specify that whenever values for the selected item reach or exceed the threshold, they will be highlighted in the selected color.
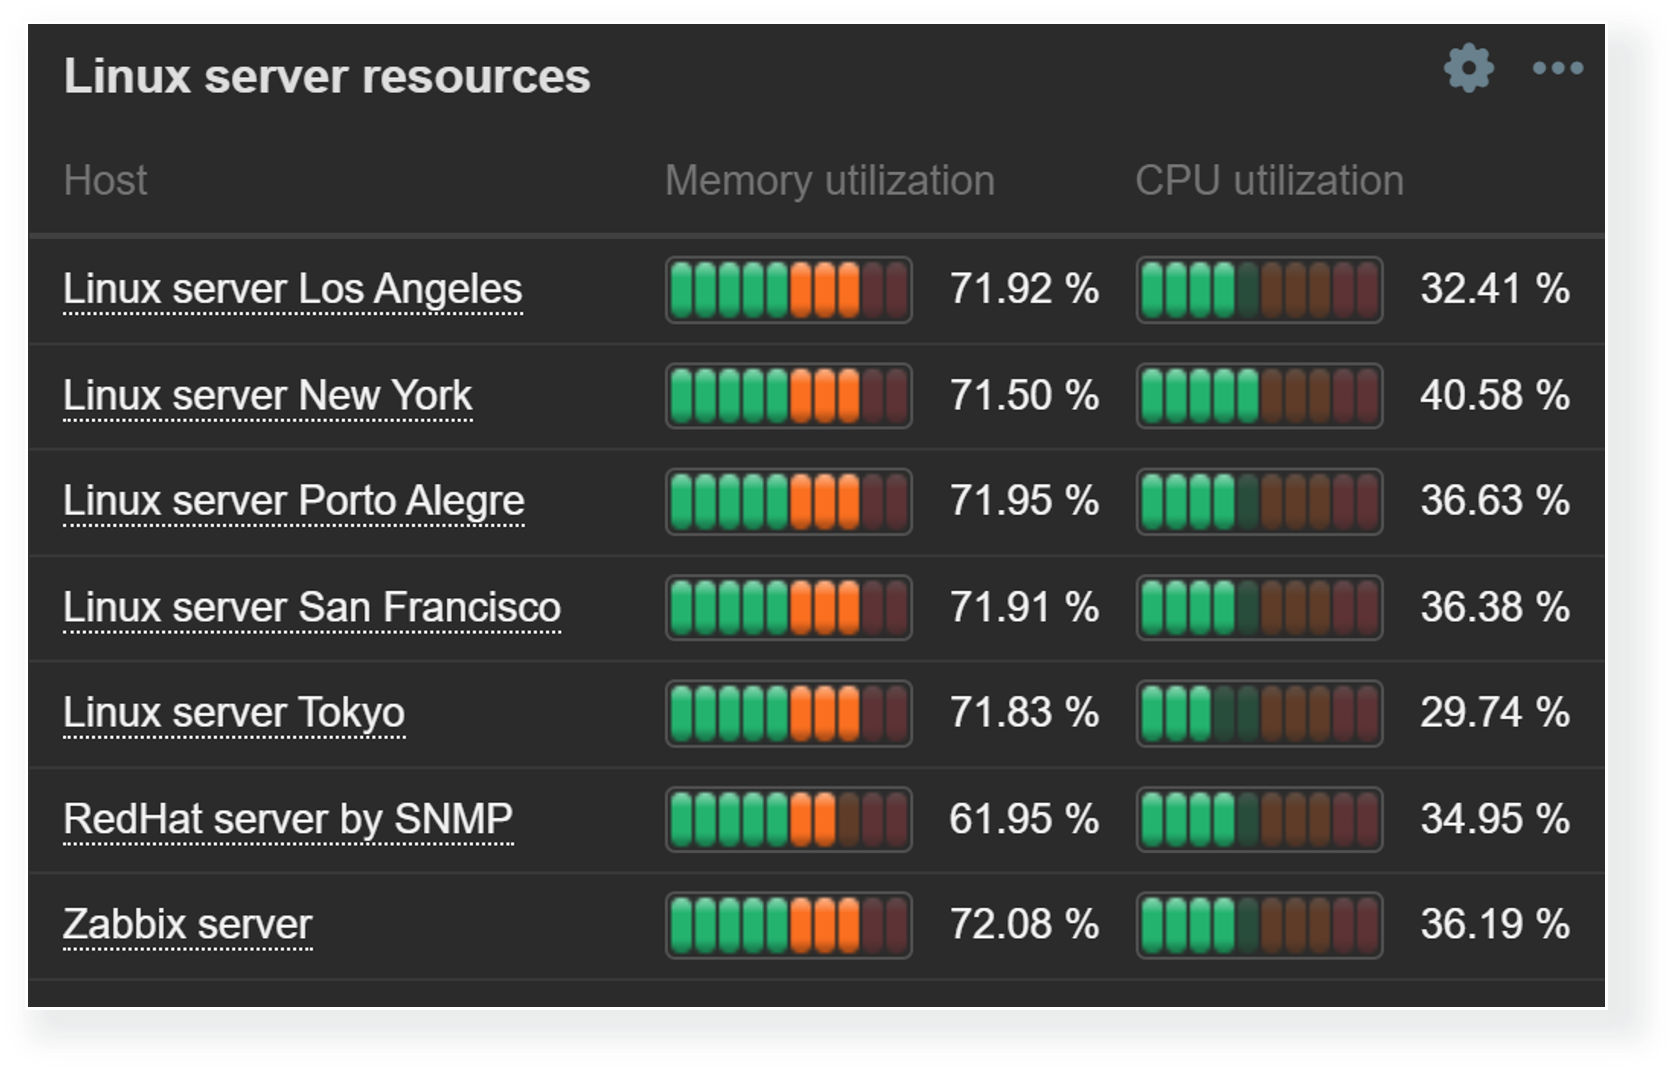
Thresholds are useful for not only highlighting the problematic items in Item value or Gauge widgets, but can also be used to provide a broader view of overall resource utilization with Top hosts and Top items widgets. Since we aren’t limited to a single item, Top hosts and Top items widgets enable us to do a surface-level correlation by looking at the utilization of various resources and highlighting the resources nearing critical utilization thresholds.
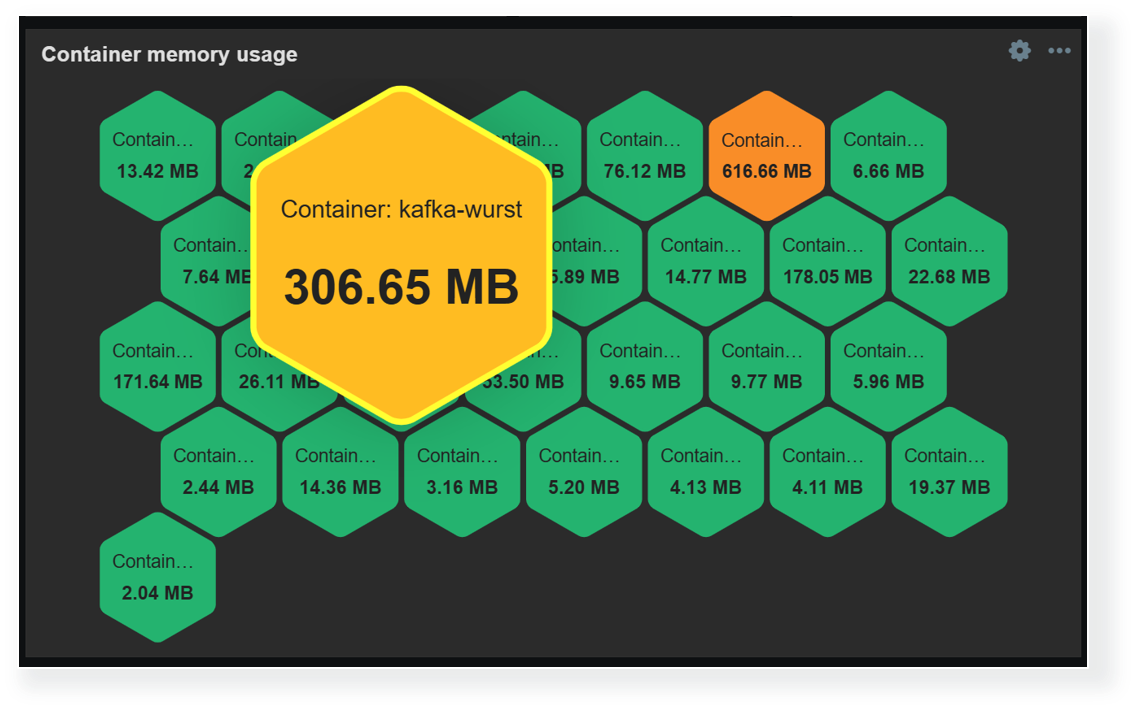
Another way to display and highlight our infrastructure state on a larger scale is by using the Honeycomb widget. The Honeycomb widget utilizes item patterns to display the matching item values. Here, thresholds can be combined with color interpolation to provide a more dynamic view of our environment. The Honeycomb widget is also capable of broadcasting the selected item and host, which enables us to quickly gain more information about the problematic host by clicking the corresponding cell in the widget.
Dashboards for MSPs
The previous sections have already highlighted a variety of features, useful widgets, and widget features for large organizations and MSPs. But let’s not forget that MSPs require granular access permission and control features. MSPs must also ensure that each client’s information (Hosts, items, dashboards) is fully isolated and secure from outside access.
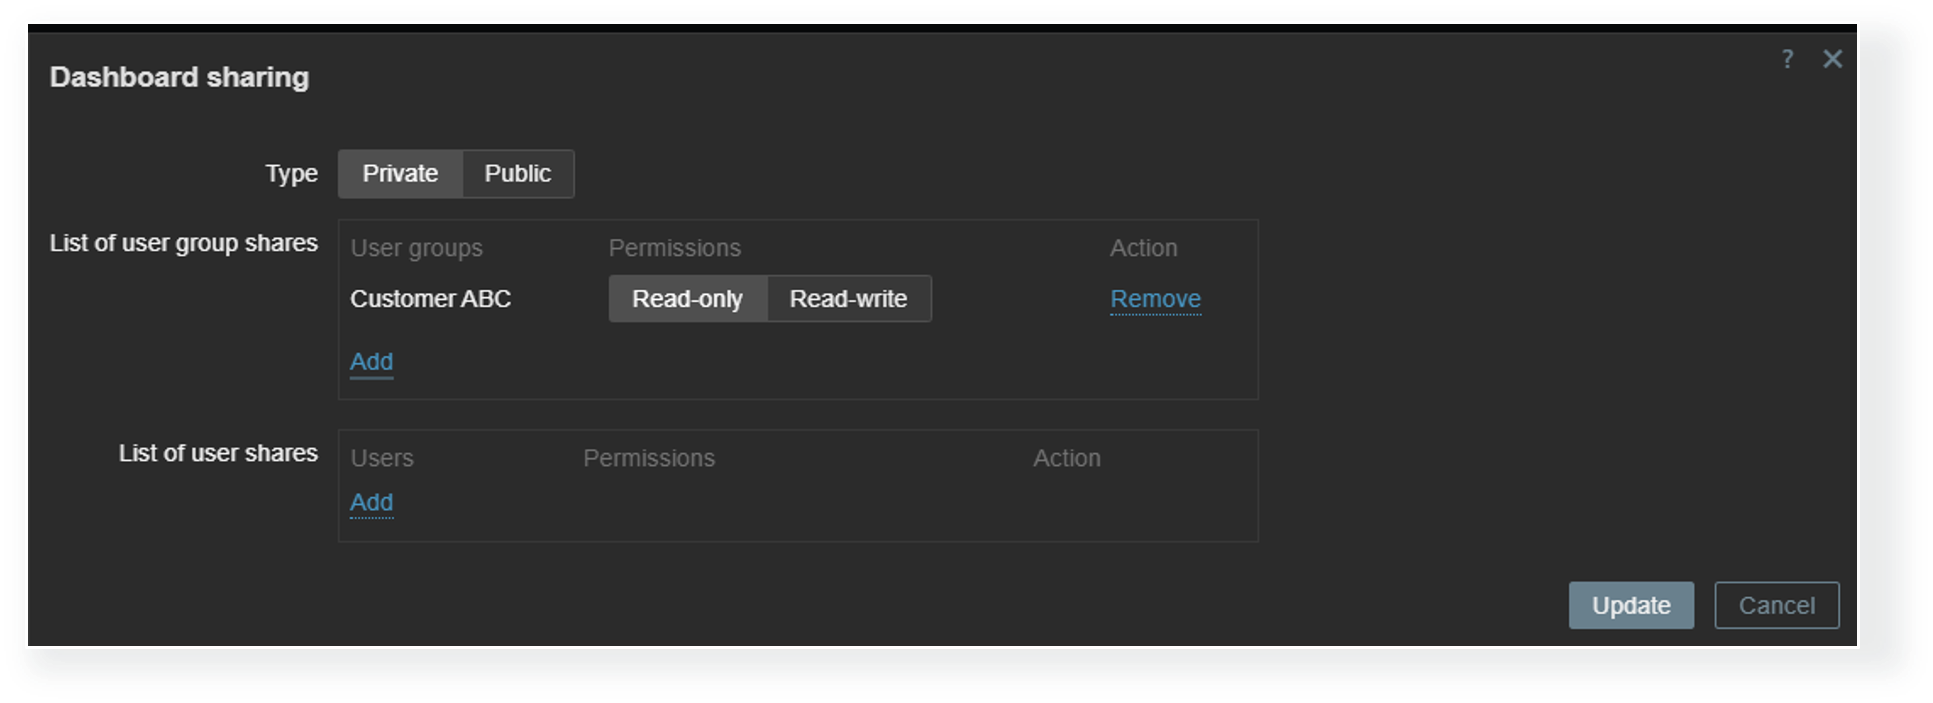
Dashboard visibility
Each dashboard can be deployed either as a public or a private dashboard. Public dashboards are available to every user in read-only mode, while private dashboards require explicit read and write permissions for users who need access to them. MSPs can utilize private client organization dashboards to allow each client to view information about their environment in multiple views while completely hiding the dashboards assigned to other organizations.
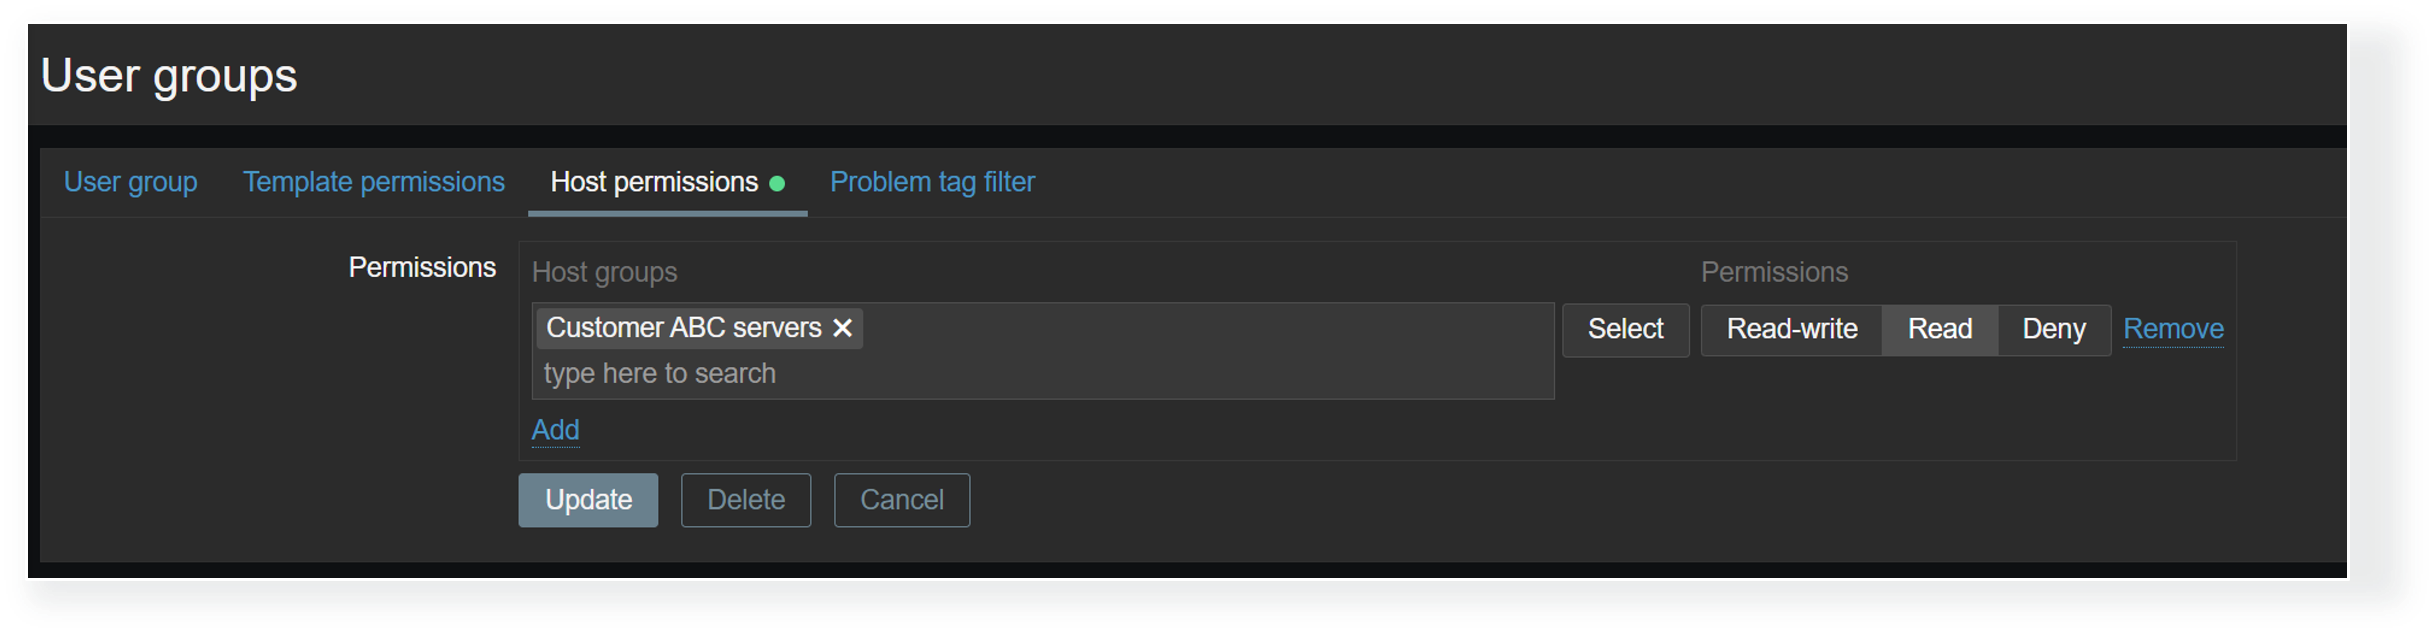
Host permissions
Dashboard visibility is only the first access control layer. Even when a Zabbix user has access to a dashboard, we must ensure that the user also belongs to a user group that has at least read permissions on the hosts displayed on a dashboard. Without at least read permissions, the hosts will not be displayed in dashboard widgets. This way, MSPs can utilize a single dashboard where each organization’s users can only see the information related to their environments, as opposed to having many duplicate dashboards, where each has a custom host filter that matches just the particular organization’s hosts.
Restricting access to widgets
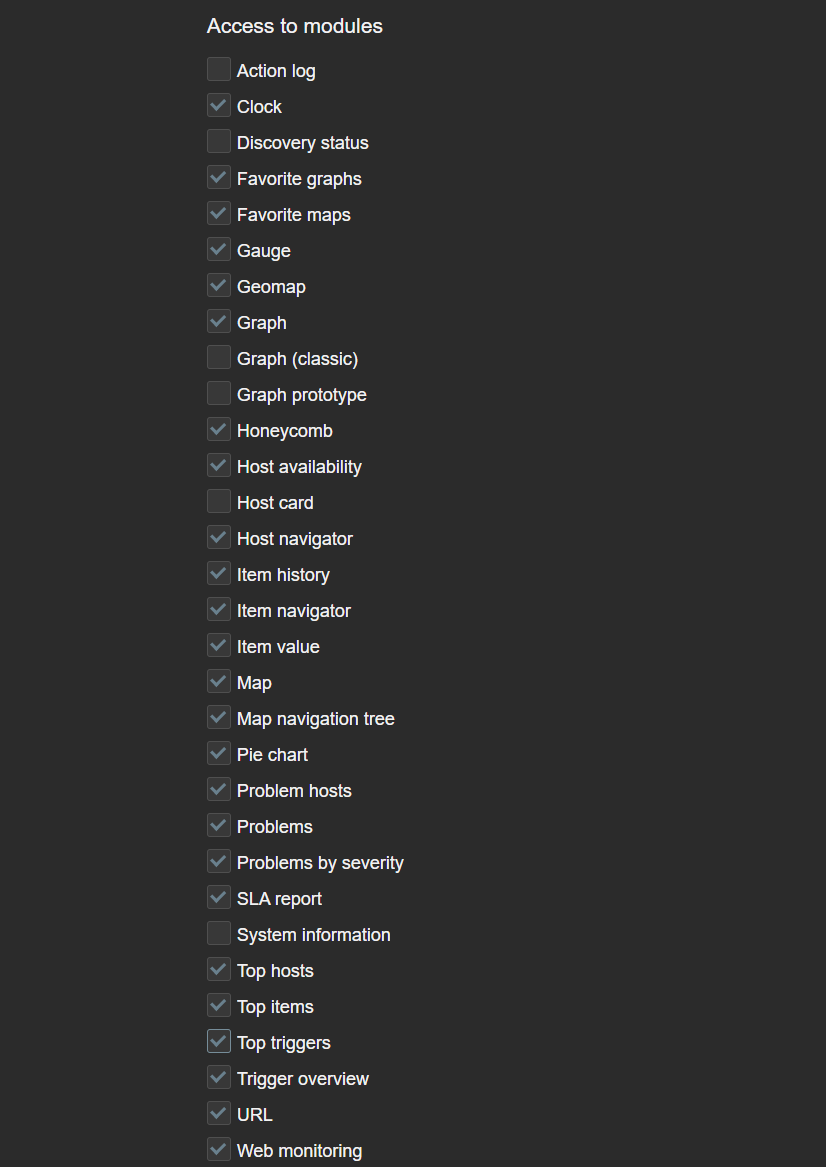
Access to each widget can also be restricted in Zabbix. This can be done globally by disabling widget modules under Administration—General—Modules or by disabling access to modules on an individual user role level. This can come in handy if the Zabbix environment in question enables users from various departments or organizations to create their own dashboards or edit existing ones. In addition, we may also have some custom community or in-house widgets which are utilized only by Zabbix administrators. which we may want to restrict access to.
If a Zabbix user opens a dashboard containing the restricted widget, the widget will be replaced with the message “No permissions to referenced object or it does not exist!” Ideally, it is recommended to avoid situations where users encounter such widgets, since such a message can be confusing to a user not familiar with various Zabbix permission and access error messages.
Dashboard ownership
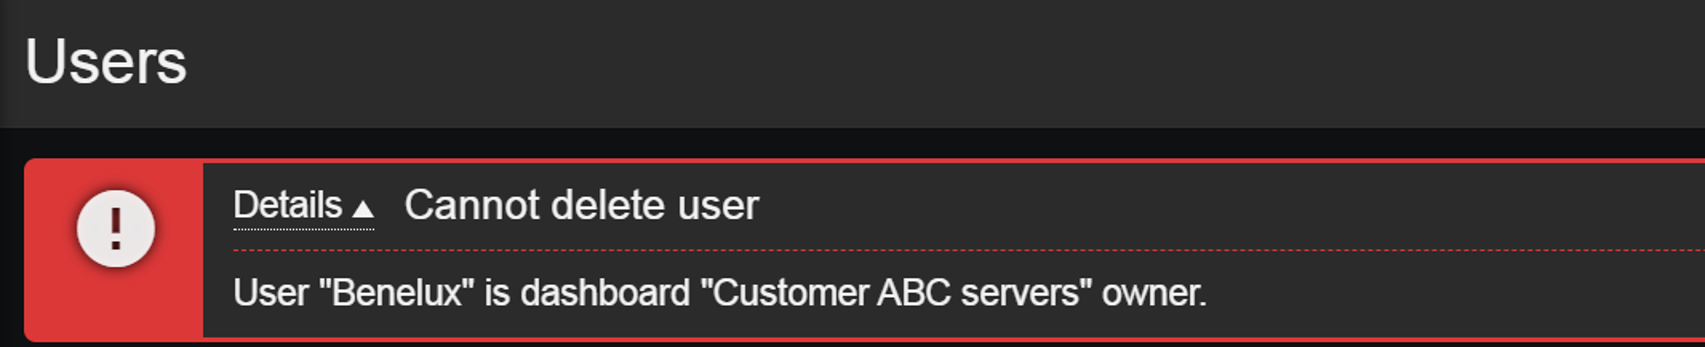
Dashboard ownership can also play a role in our user onboarding and offboarding process. Dashboard owners can edit permissions on the dashboards they own, but this can add an extra step in our user offboarding process since dashboards cannot remain without an owner! Therefore, before deleting a Zabbix user, we need to ensure that either their dashboards have also been removed or have their owners be changed. If we attempt to delete a user who is also a dashboard owner, Zabbix will display an error message.
This article touches upon only a few of the latest and lesser-known features useful to MSPs and large organizations. There are many more advanced ways of utilizing Zabbix widgets, permissions, tags, low-level discovery rules, and many other features that come in handy to organizations of various sizes, utilizing Zabbix for a variety of use cases. Follow our blog, watch the latest Zabbix videos on our YouTube channel, and check out our on-premise and online events to learn more about the flexibility of Zabbix data collection, alerting, and visualization features.