In the previous blog post, we installed the Zabbix Agent Helm Chart and set up official Kubernetes templates to monitor a cluster in Zabbix. In this edition, part 2, we will explore the functionality provided by the Kubernetes integration in Zabbix and discuss use cases for monitoring and alerting on events in a cluster. (This post assumes that the Kubernetes integration has been set up in at least one cluster using the helm chart and provided templates.)
Want to see Kubernetes monitoring in action? Watch Part 2 of our Kubernetes monitoring video guide.
Table of Contents
Node and Component Discovery
Following integration setup, the templates will discover control plane components, each node, and the kubelet associated with it using the Kubernetes API via a “Script” item type.
Note:
In the last blog post, I showed a managed EKS cluster. Control plane components cannot be discovered in an EKS cluster because AWS does not make them directly available through the API. For the sake of demonstrating the full capabilities of the integration, this post will use screenshots depicting a cluster that was created using the kubeadm utility.
In the latest version of Zabbix (6.2 at the time of writing), control plane components are discovered via node labels added only for clusters created with kubeadm. Depending on your setup, you may be able to add the same node labels to your own control plane nodes or modify the template to use your specific labels.
This example cluster has 4 worker nodes and 1 master node. The control plane runs entirely on the master node.
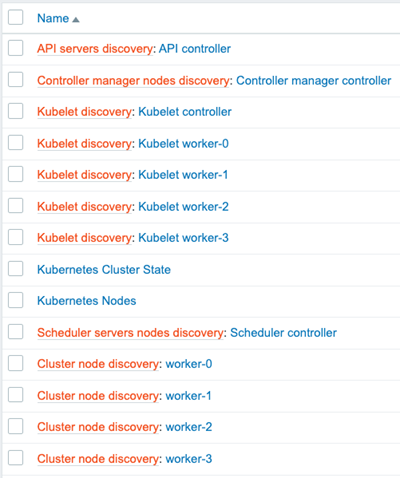
Zabbix’s “Low-Level Discovery” is the backbone of the Kubernetes integration. Zabbix discovers each node and creates two hosts to represent them in the cluster. The first host attaches the “Linux by Zabbix Agent” template to it, and the second attaches a custom Kubelet template called “Kubernetes Kubelet by HTTP. Zabbix also creates items for most standard objects like pods, deployments, replicasets, job, cronjob, etc.
Node and Kubernetes Performance Metrics
In this example, there are four discovered worker nodes with the “Linux by Zabbix Agent” template attached to them. The template will provide metrics about the machines running in the cluster.
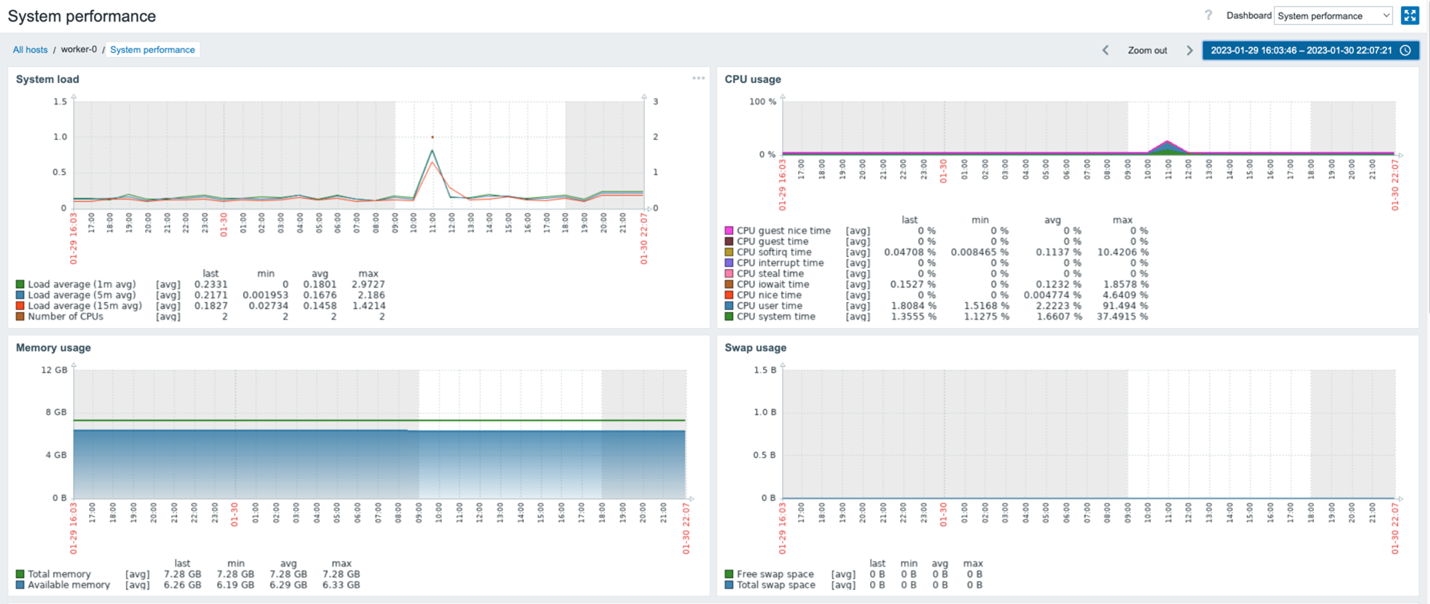
Each worker host’s “System performance” dashboard shows system load, CPU usage, and memory usage metrics.
Zabbix will also collect Kubernetes-specific metrics related to the nodes. “Latest Data” for the Kubernetes Nodes host shows metrics such as the Allocatable CPU available to pods and the node’s memory capacity.
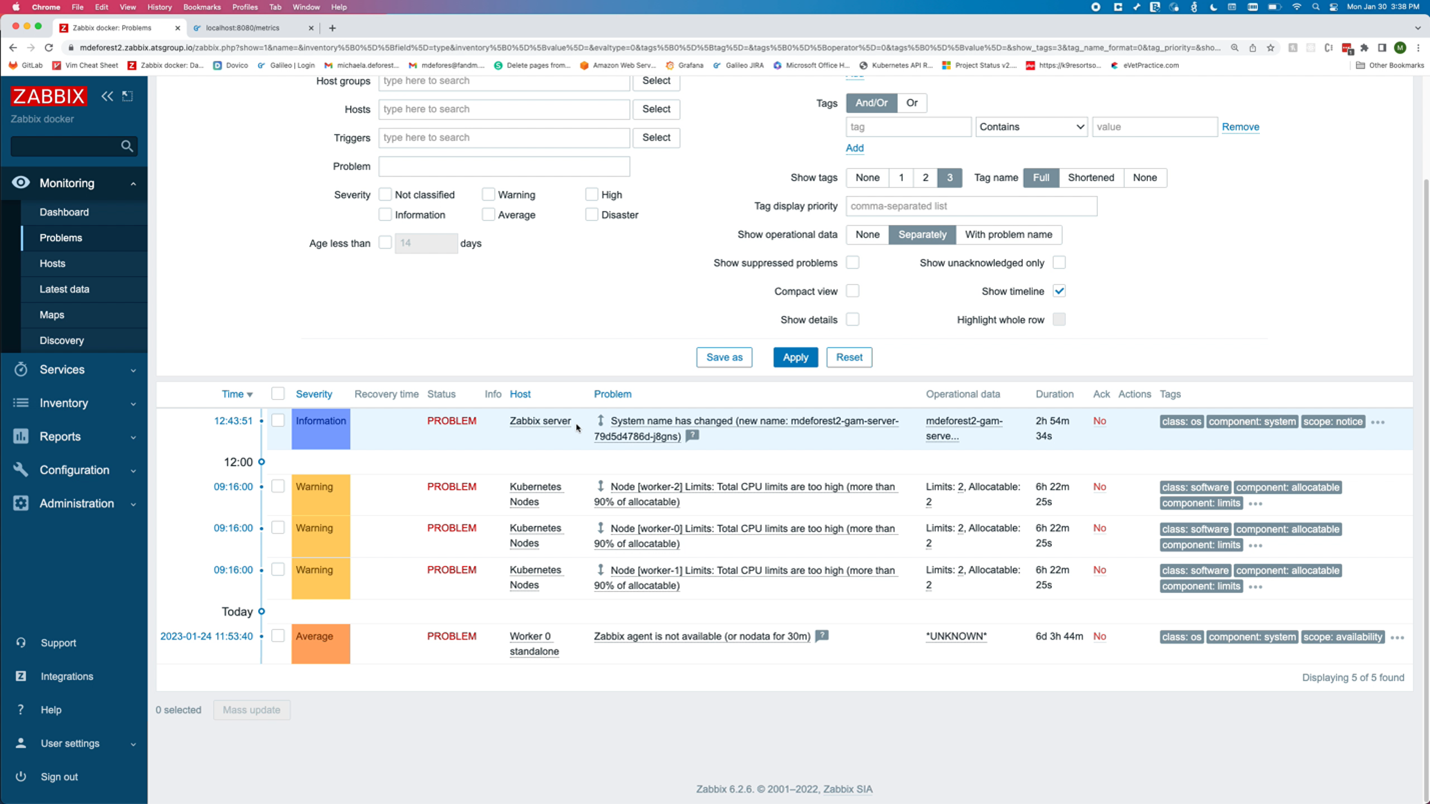
Alerts are generated for events such as the allocation of too much CPU. This could indicate that capacity should be increased, assuming that the memory and CPU limits set on the pod label are accurate.
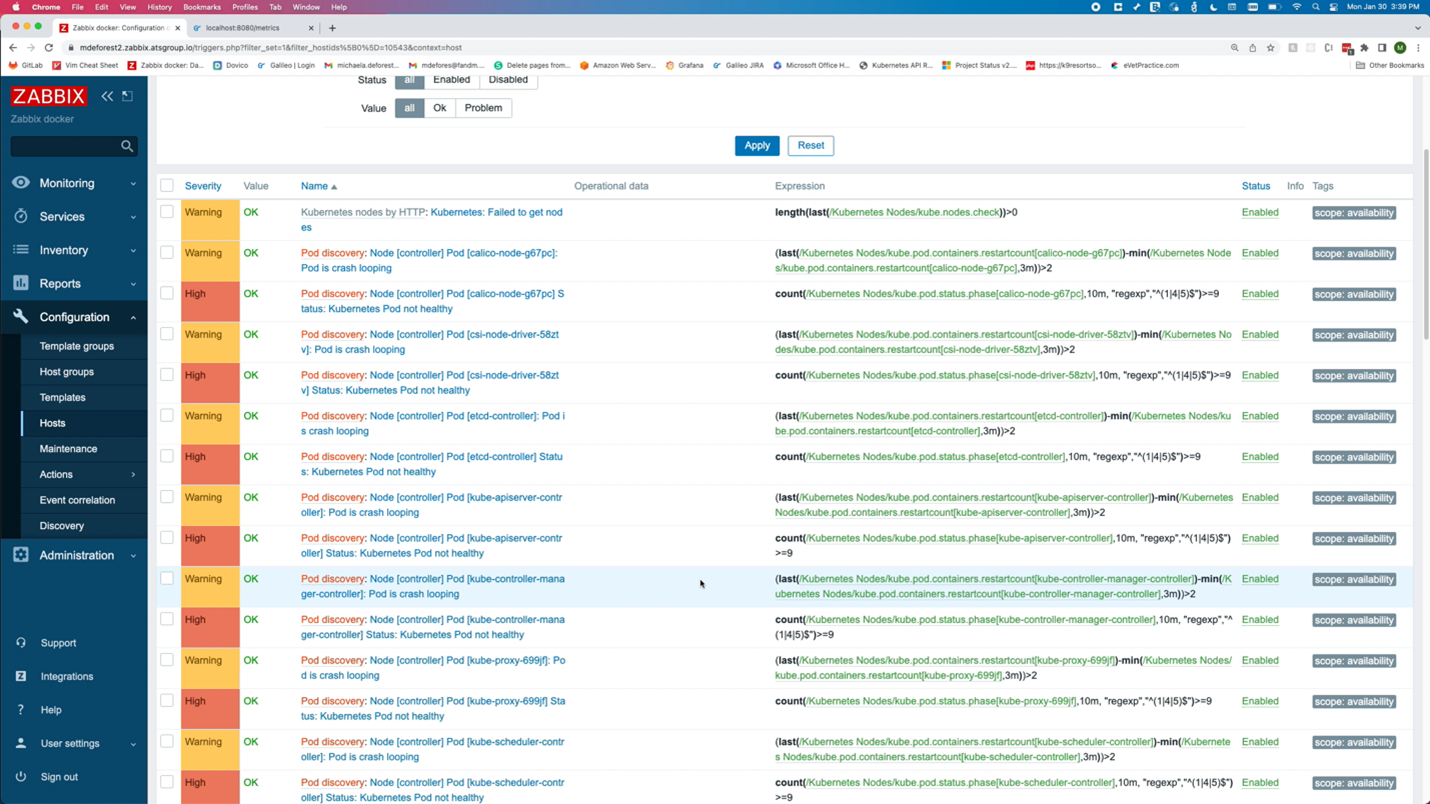
The Kubernetes integration also monitors object states. As a best practice, any tool used to monitor Kubernetes should be monitoring and alerting critical status changes within the cluster. The image above shows the triggers related to the health of a pod. There are also triggers when certain conditions are detected by the nodes, like memory or CPU pressure.
Zabbix discovers objects like pods, deployments, and Replicasets, and triggers on object states. For example, pods that are not up or deployments that do not have the correct number of replicas up.
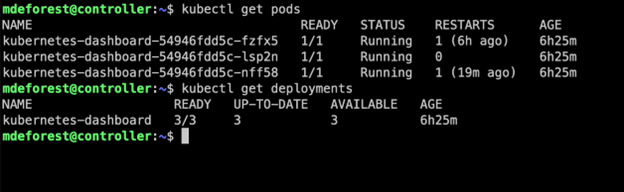
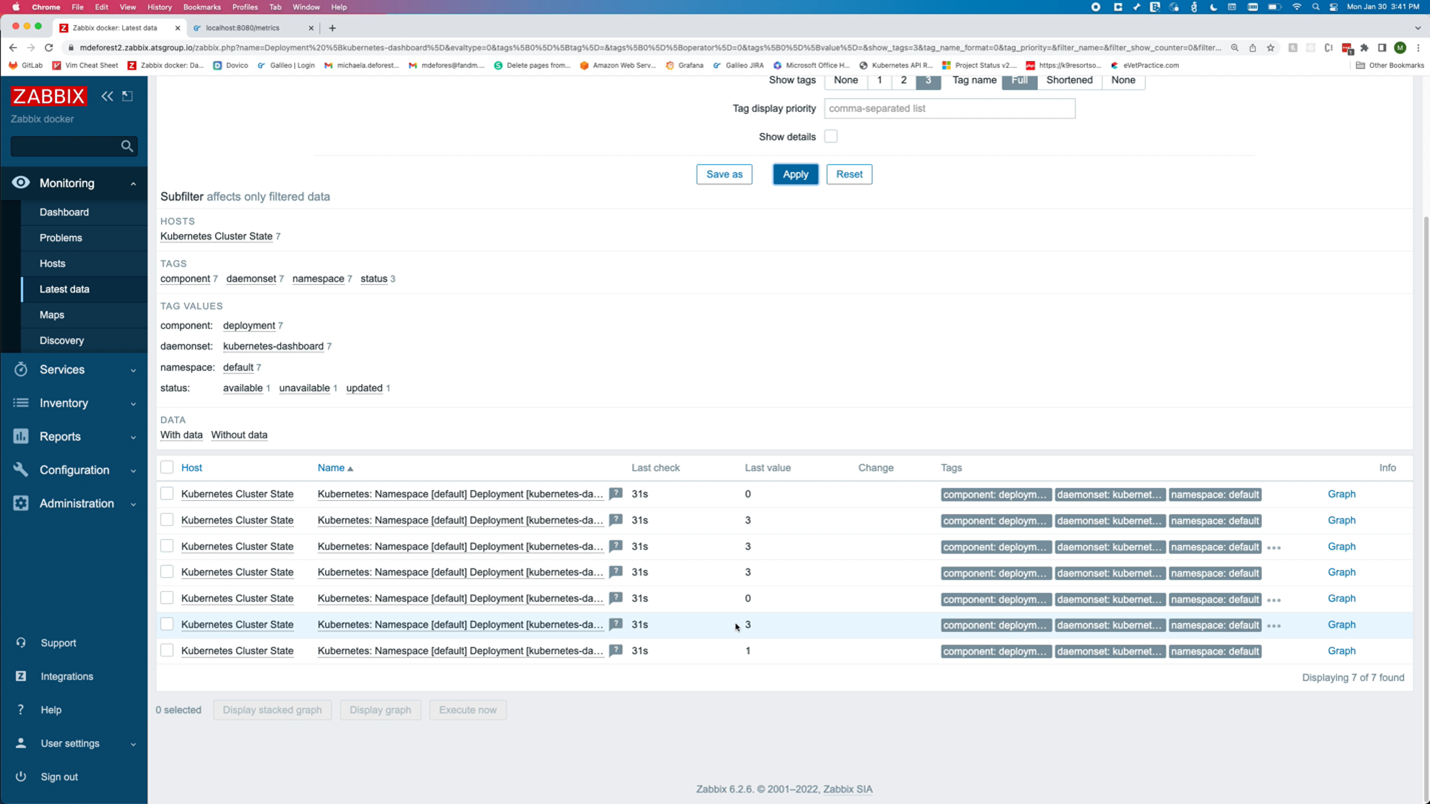
In this example, a cluster is running a Kubernetes dashboard deployment with 3 replicas. By running the following command, we can see that all 3 replicas are up. Under “Latest Data,” Zabbix shows those 3 replicas available out of the 3 desired.
kubectl get deployment kubernetes-dashboard
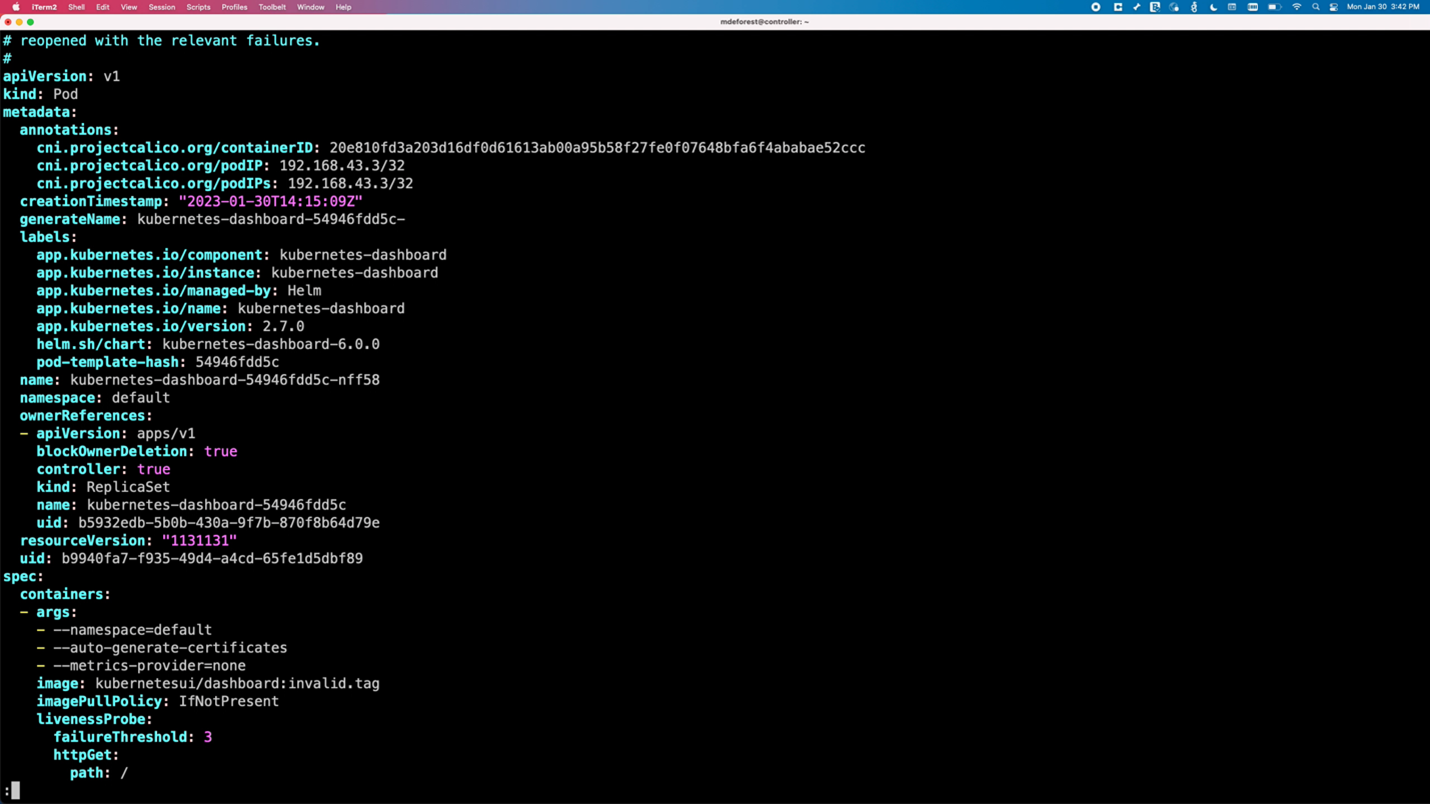
To mimic a pod crashing, the pod is edited to use an invalid image tag.
kubectl edit pod <pod name>
The image tag is changed to “invalid.tag, “ which is unavailable for the image. This causes the pod to fail because it can no longer pull the image. Output now shows that one pod is no longer ready.
Looking at the data in Zabbix, the number of available replicas is only 3, while the number of unavailable replicas is now 1.
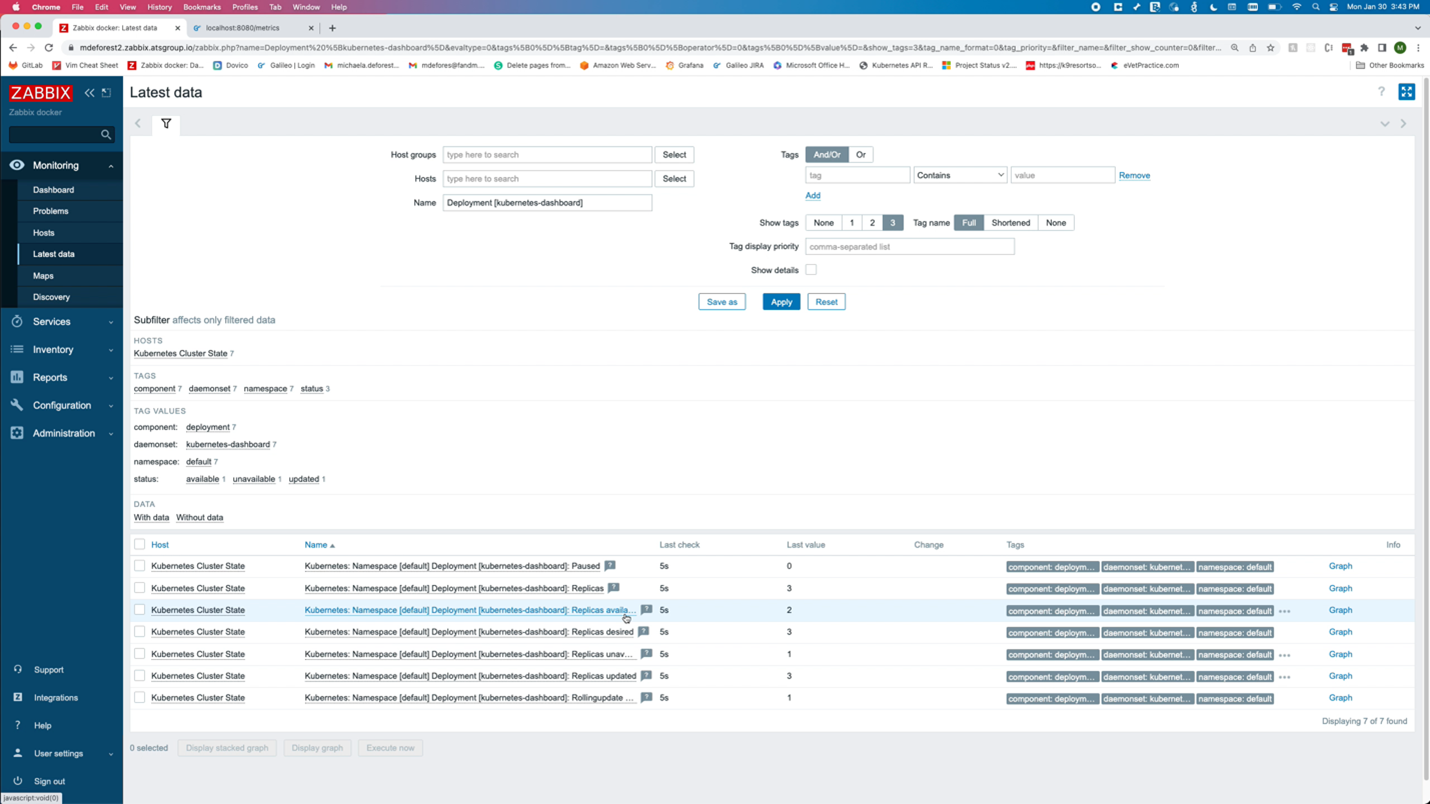
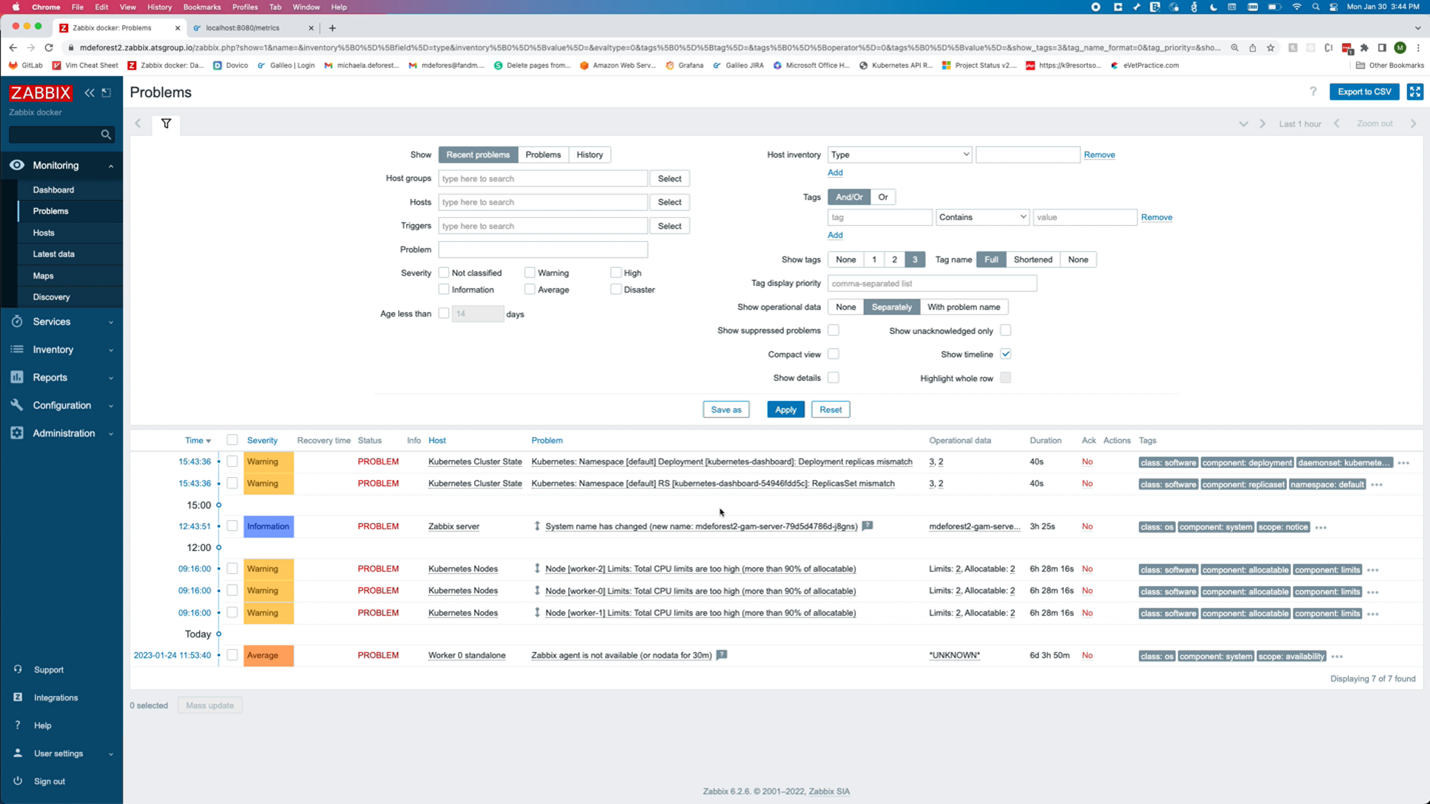
On the problems page, there are two new problems. Both alerted that there is a mismatch between the number of replicas for the dashboard and the number of desired replicas.
Changing the tag back to a valid one should cause those problems to be resolved.

The Kubernetes templates offer many metrics and triggers, including most provided by Prometheus and Alert Manager. With some Zabbix experience and the ability to navigate kube-state-metrics and Kubernetes APIs, creating new items is possible.
What’s Next?
Above is an example of the output from the kube-state-metrics API. Unlike most APIs that return data in JSON format, the kube-state-metrics API uses the Prometheus data model to supply metrics.
As you get comfortable with Kubernetes monitoring in Zabbix, you may want to parse your own metrics from kube-state-metrics and create new items.
In the next video, we will learn how to monitor applications with Prometheus in Zabbix.
About the Author
Michaela DeForest is a Platform Engineer for The ATS Group. She is a Zabbix Certified Specialist on Zabbix 6.0 with additional areas of expertise, including Terraform, Amazon Web Services (AWS), Ansible, and Kubernetes, to name a few. As ATS’s resident authority in DevOps, Michaela is critical in delivering cutting-edge solutions that help businesses improve efficiency, reduce errors, and achieve a faster ROI.
About ATS Group: The ATS Group provides a fully inclusive set of technology services and tools designed to innovate and transform IT. Their systems integration, business resiliency, cloud enablement, infrastructure intelligence, and managed services help businesses of all sizes “get IT done.” With over 20 years in business, ATS has become the trusted advisor to nearly 500 customers across multiple industries. They have built their reputation around honesty, integrity, and technical expertise unrivaled by the competition.