


A big data analytics engine can be used to optimize large and complex Zabbix installations: keeping track of the amount and kind of problems over time, top alert producers, and much more. You can employ Splunk to optimize and analyze vital Zabbix runtime parameters, such as ‘unsupported items,’ repeatedly happening host availability issues, misconfigured agents, and Zabbix Queue entries.
Contents
I. Complexity (1:15)
II. Zabbix entity inventory (8:28)
III. Use cases (15:16)
IV. Conclusion (20:09)
V. Questions & Answers (21:41)
secadm GmbH is a service provider located in the south of Germany. The company with a strong background in monitoring and automation, network infrastructure, and security software development supports customers of all sizes to manage their IT infrastructures. secadm GmbH is a Zabbix partner and also a Zabbix training partner.
Complexity
Operating a Zabbix deployment of a specific size comes with some challenges:
- A huge number of hosts, templates, items, host groups, macros, and configuration elements inside your Zabbix instance.
- LLD rules/unsupported items — items that are unable to fetch information, for example, a wrong password or a wrong path, in an external check. It is often hard to get a hold of how many of those you have and in which of the various error states. Therefore, it’s also difficult to fix them.
- Host availability/network issues — errors that you see only in the logs — things going up and down, losing their connectivity, but getting back in time before issuing an alert.
- Queue entries. In larger Zabbix installations, you might have ten thousand or even more items in this service queue. Zabbix actually tells you that some items do not receive their data in time. Zabbix shows that something is really wrong, though it doesn’t give a hint about what is wrong.
- Zabbix as a monitoring tool is there to actually generate problems and alerts out of these problems. Many problems often cause ‘alert fatigue’ when people start ignoring monitoring results because of too many alerts.
Therefore, we receive a lot of questions from our customers, such as:
- Where do all these problems come from?
- What are the hosts generating most of the problems, at what times, and generated by what templates?
- Did the latest change/upgrade have any negative impact on our monitoring?
- Can you get rid of unsupported items?
- How many hosts have specific problems (for instance, caused by a known bug in an old version of an agent that behaves strangely with a specific version of the Zabbix server), and what would be the effect if we fixed those problems?
- Where do all these queue entries come from?
Zabbix is a transparent and predictable monitoring tool that offers great ways to organize the monitored elements with templates and macros. Zabbix also offers excellent visualization capabilities. However, Zabbix is not an analytical utility offering a flexible query language to gather the required information in the required format, having on-demand statistical functions, and allowing you to enrich and correlate data with the data from arbitrary sources. So, extra tools will have to do the extra work.
Secadm GmbH being the partner of Zabbix and Splunk, has concluded that it’s obvious to use Splunk for such extra work. Splunk is offering many possibilities to onboard data in the platform far beyond the simple indexing of log data, looking up the Key-Value store, implementing scripts and programs inside the Splunk platform to fetch data in real-time and on-demand out of other systems without having to store and to index any kind of information, as well as performing custom search commands.
Zabbix entity inventory
The most important Zabbix data used for analysis — the inventory of all elements inside Zabbix that do not often change, such as:
- Hosts,
- Items,
- Proxies,
- Templates,
- Triggers,
- Discovery rules (LLD),
- Item Prototypes, and
- Trigger Prototypes.
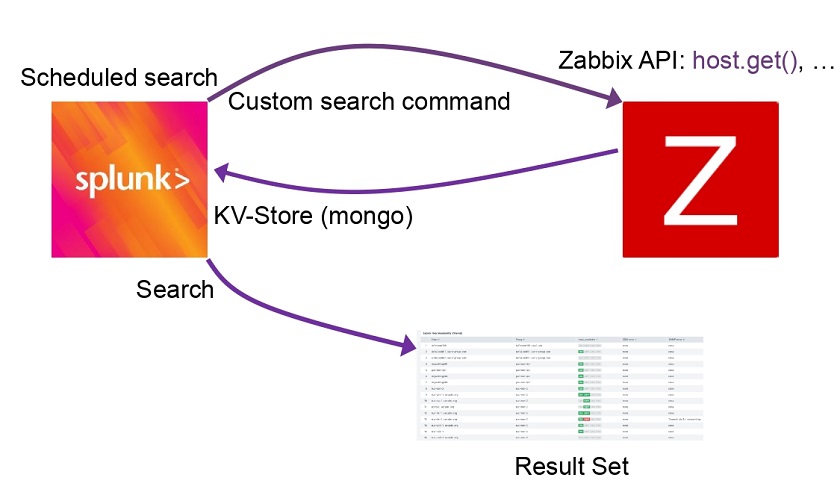
As this data is not changing constantly, we fetch this data from Splunk with the scheduled search and custom search command directly from the API endpoints in Zabbix. Then we can store this information inside the Splunk KV Store, which is, in fact, the MongoDB allowing us to perform searches in milliseconds without having to index any data and quickly get the results.
Zabbix entity inventory
So, you can get statistics on status and state to drill down on the unsupported items for a list of all of the items. You can further identify the correlation for the hostnames instead of host IDs, which are not human-readable. The hostnames are available at the KV Store, which stores the hosts with their metadata. You can also identify how many unsupported items there are on each host.
You can also get information on the hostnames, hosts, item names, item types, and errors. You can categorize the problems as SNMP problems, shell problems such as wrong paths, and see how often certain problems happen and what hosts are assigned to what templates and host groups, and so on. This information may also be aggregated or correlated with information from UCMDB.
More data
More fun than having data within a data analytics platform has more data.
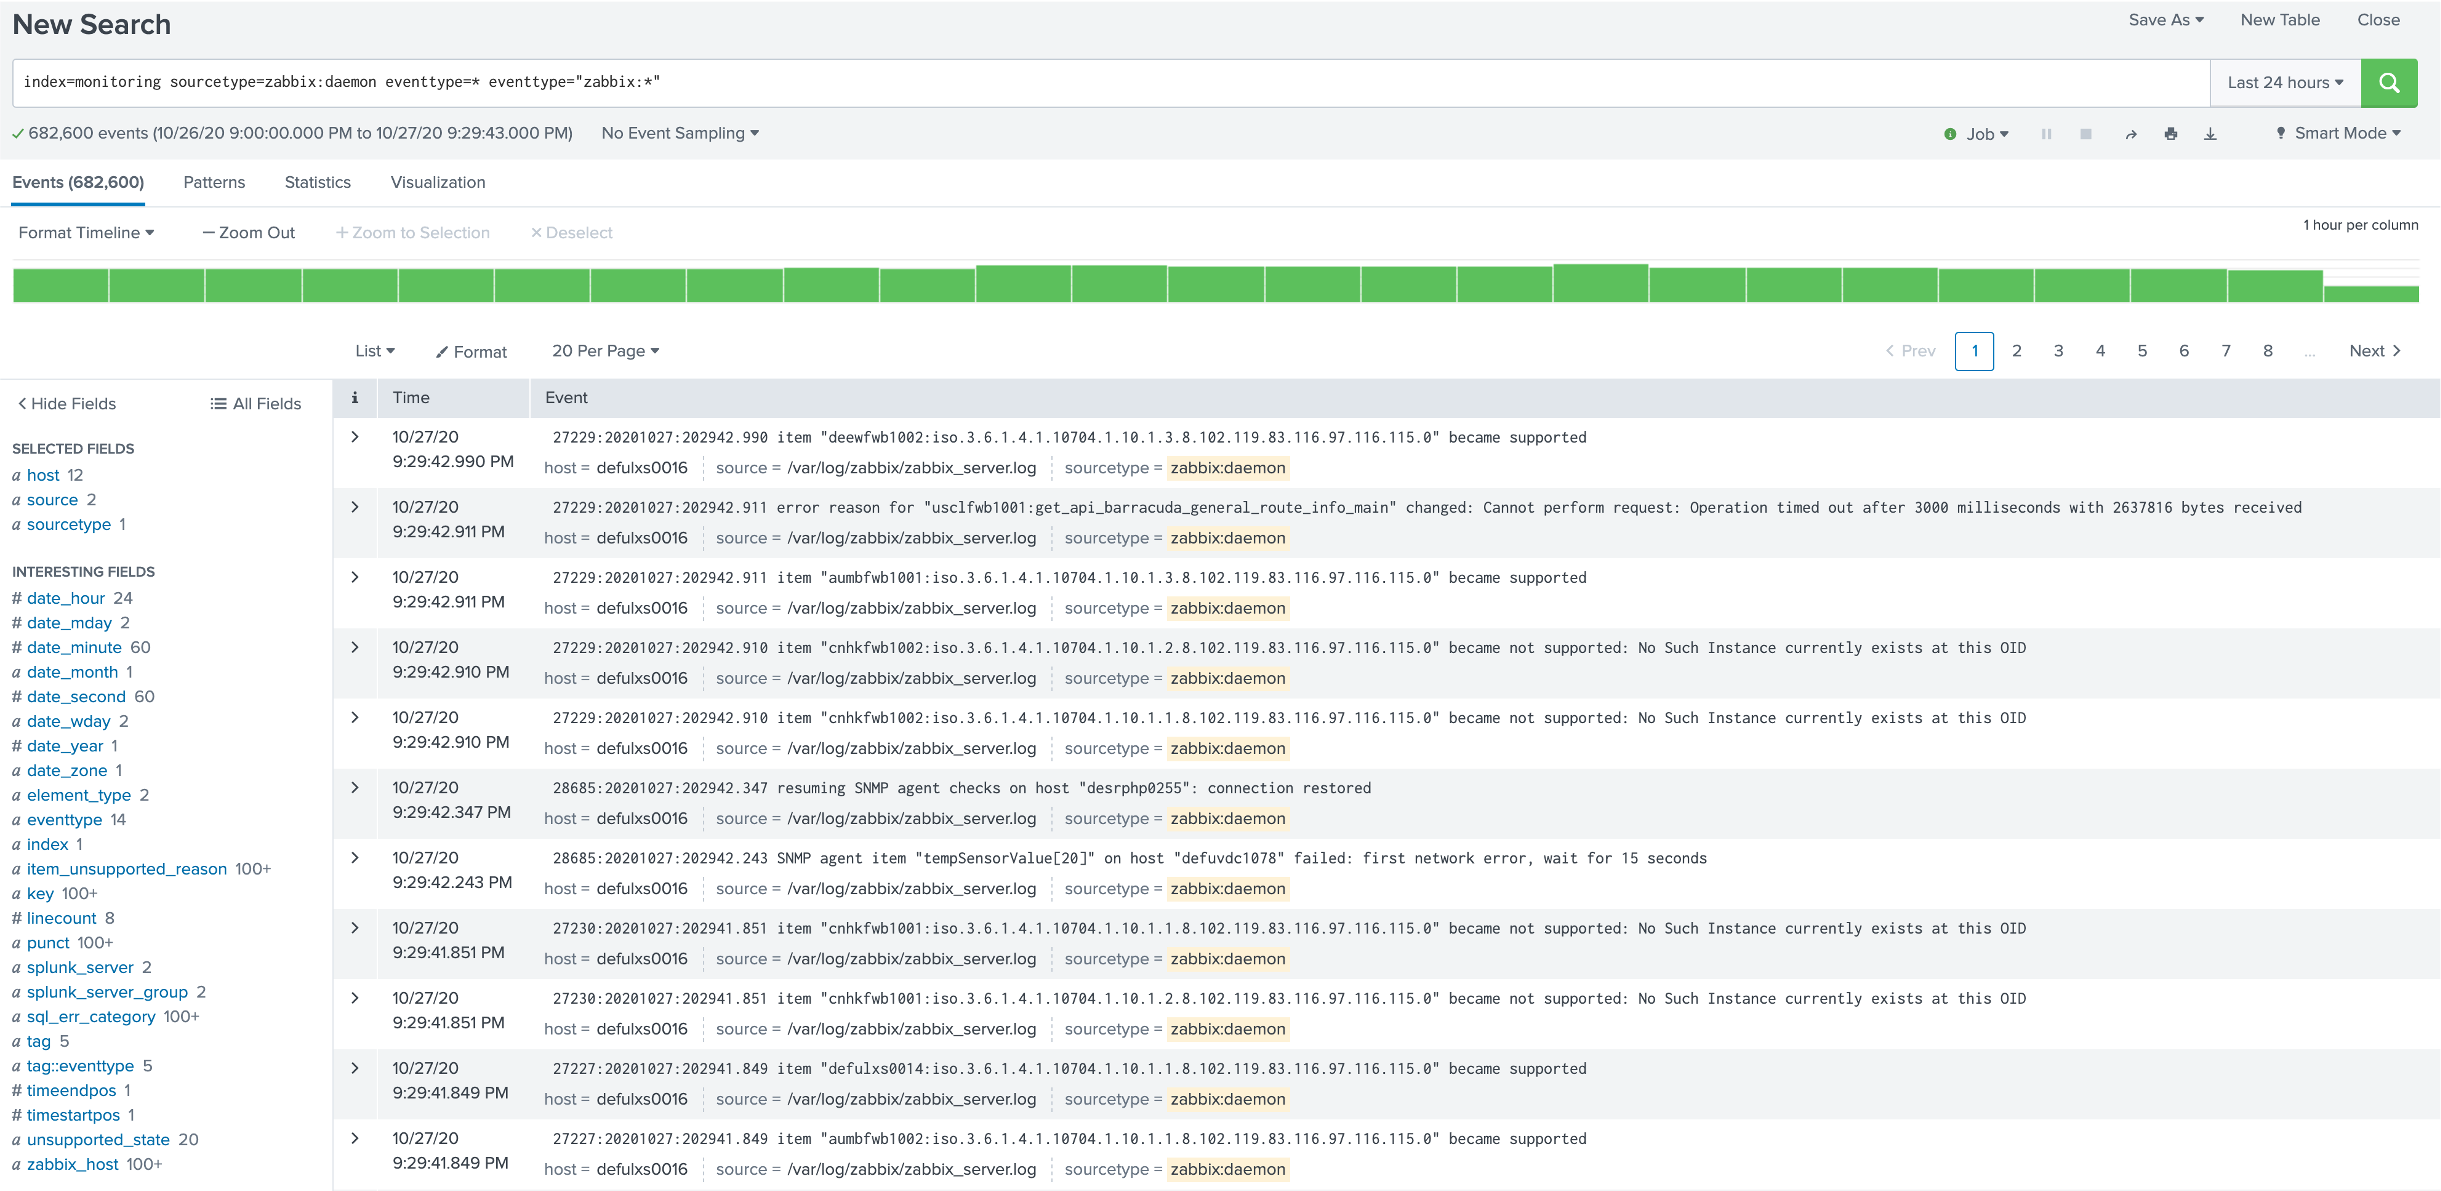
- Indexing the Zabbix Server / Proxy Logs logs, categorizing events to identify availability issues, item problems, preprocessing problems, housekeepers statistics, etc.
- A module to fetch information from Zabbix (item, host, trigger) in real-time.

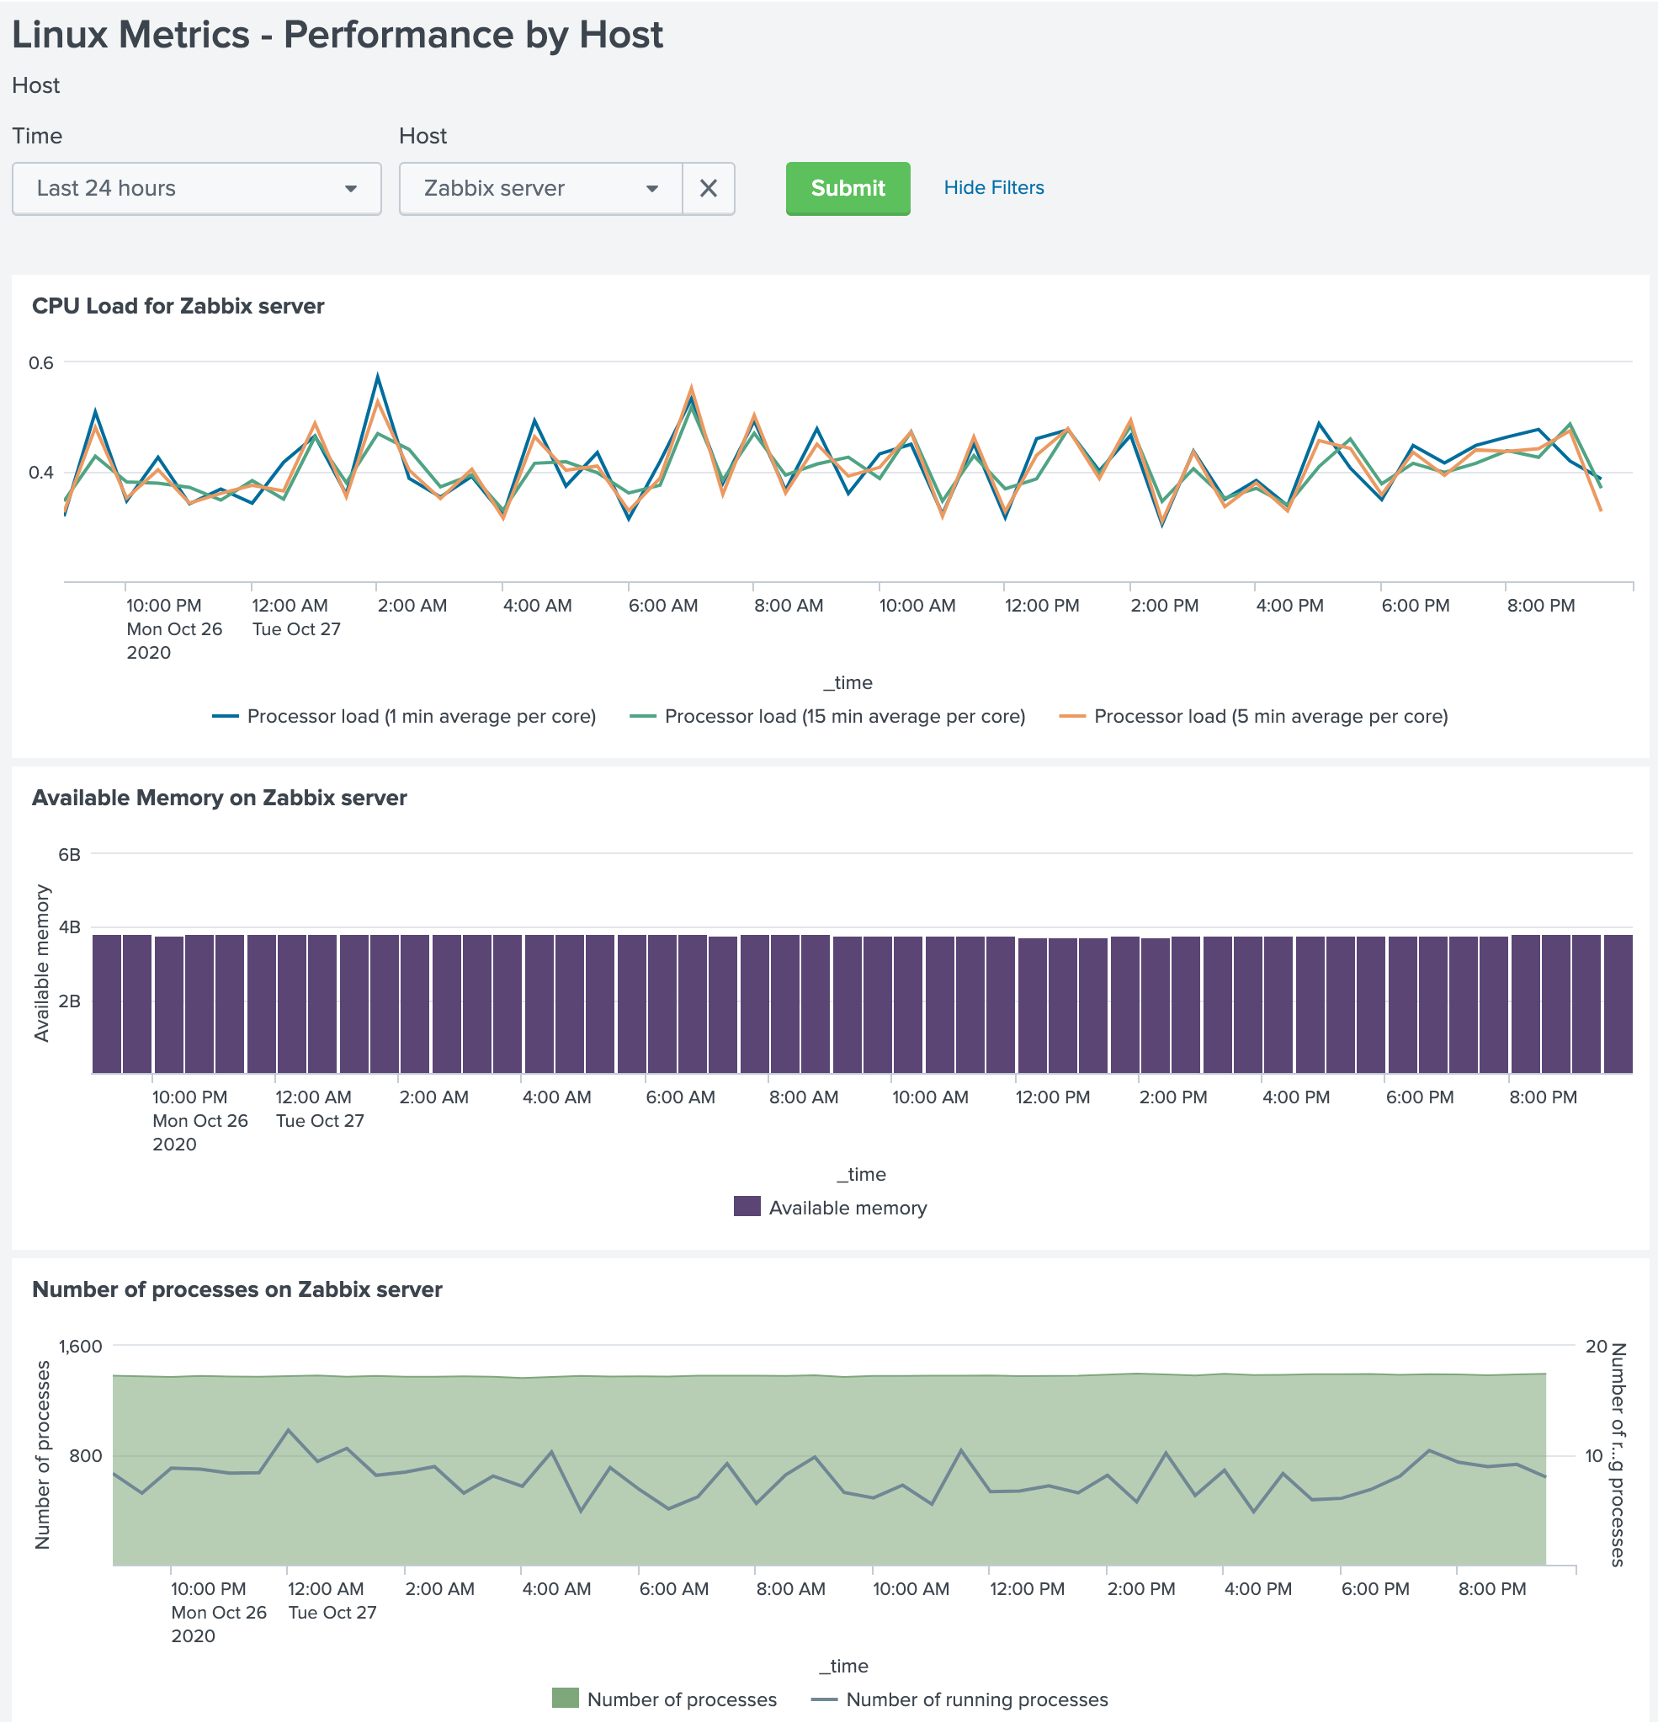
- Gathering metrics (History / Trends data) directly from Zabbix in real-time without the need to store these metrics in any place other than the Zabbix database. We can still use the data for graphing, correlations, calculations, etc.
- Onboarding the Zabbix problems into Splunk by using the new custom Media types — Webhook.
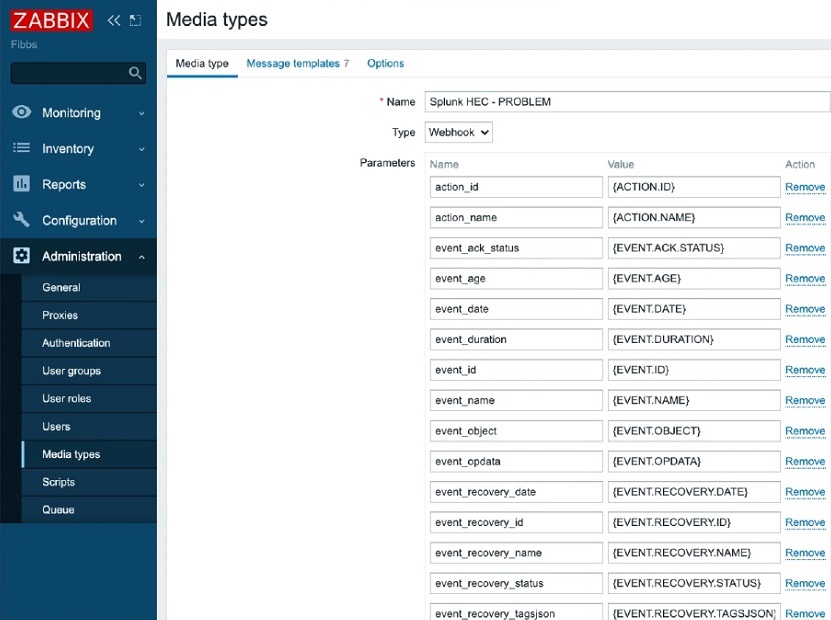
Custom Media type
- Correlation of the alert logs, which are new and available through the API since Zabbix 5.0.
- Working on the queue items to solve these questions.
Use cases
Zabbix queue
Zabbix queue may be a real headache as you can wait for a Zabbix installation with 20,000-50,000 items for 5 or 10 minutes or even longer.


In this dashboard, the same view is displayed in Zabbix: items are categorized by overtime, item type, proxy, etc. Splunk here offers what Zabbix fails — the history so that you can see the spikes when things have changed dramatically. For instance, when more significant network changes happen, the network slows down, and the queues grow dramatically. You can see whether these queues have gone back down or remained up. This information is complicated to analyze in Zabbix.
You can also drill down to see the items correlated with their actual status and the host’s status inside Zabbix. So, you can clearly see, for instance, that an item is on the host that is down or in the queue as it’s not supported and doesn’t get any data.
Here, there is also an Ignore list. So you can get statistics for the remaining items and group them, for instance, by Item type. You can go further and analyze and fix the problems.
Zabbix problems analytics
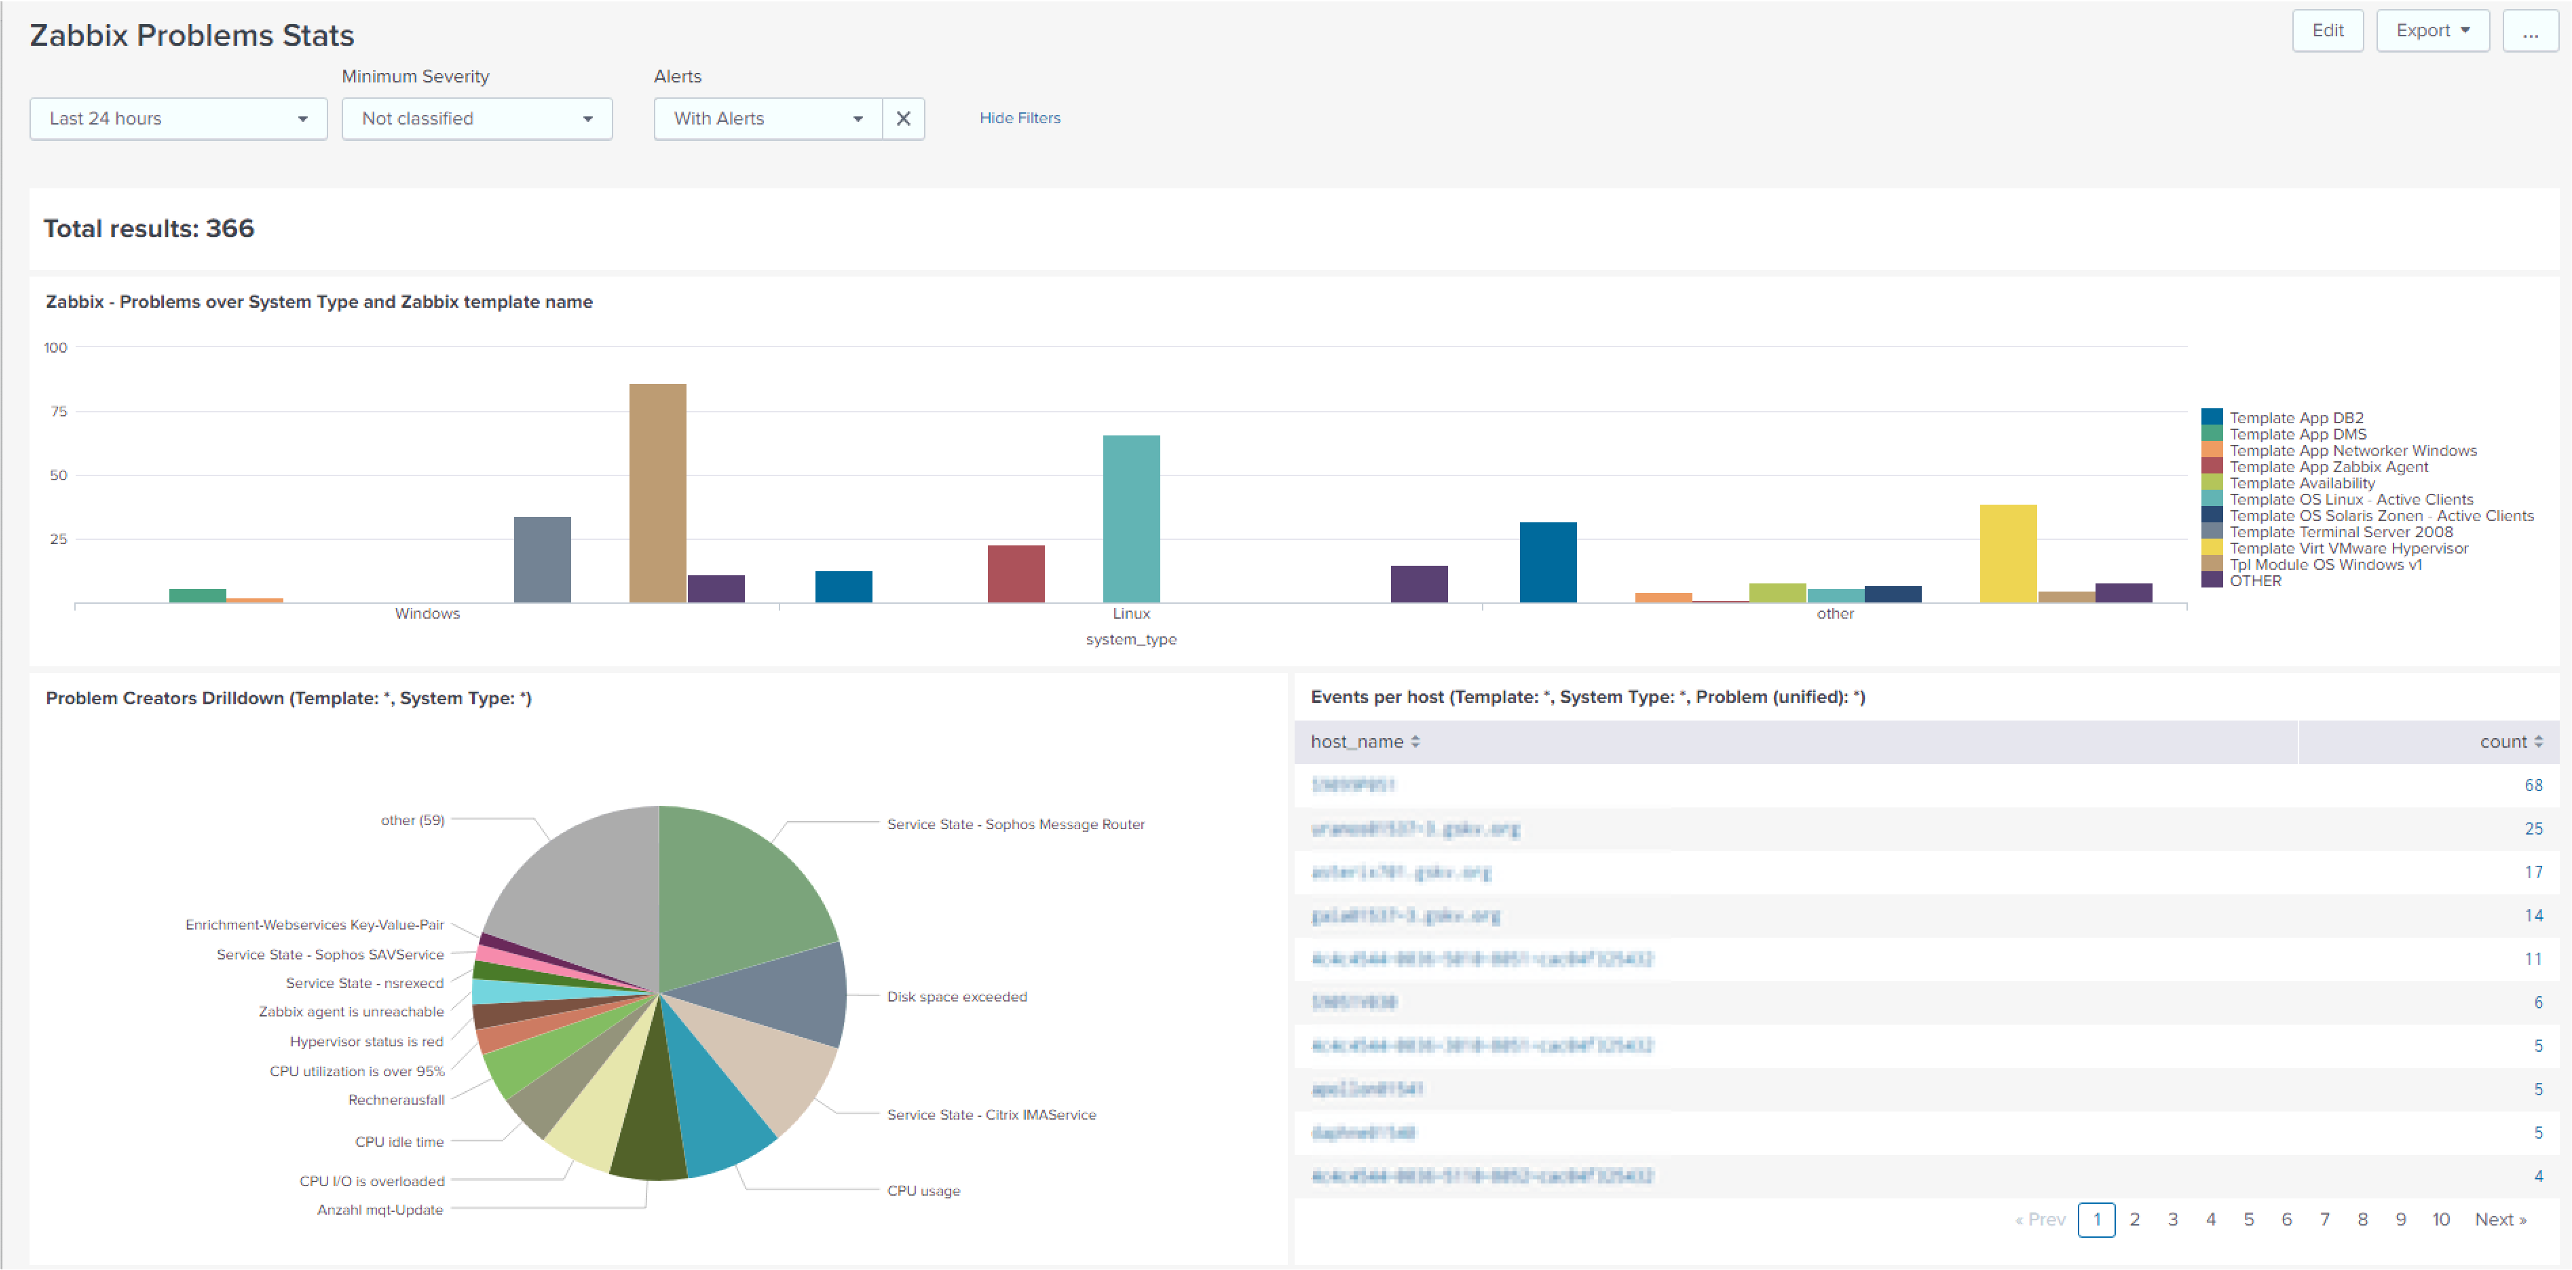
Zabbix problems dashboard
In this dashboard, Zabbix problems are displayed by system categories. For instance, we can see that over the last 24 hours, Windows caused most of the problems.
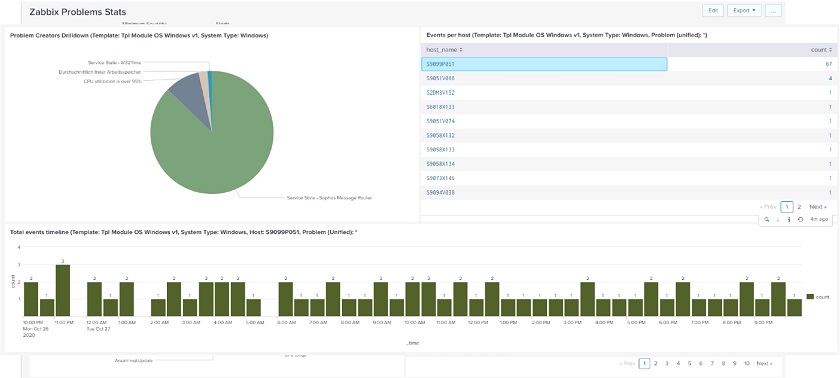
Here, we can also drill down to see, for instance, if there are many similar problems. You can go further to identify a single issue that has caused many alerts or problems. You can see that one host is creating almost all of the problems. So, if you switch this one host off, you would have fewer problems.
Zabbix data for management visibility

We can use Zabbix data for greater management visibility, such as:
- Correlation of data to generate meaningful dashboards:
— Zabbix (metrics, status, problems, etc.),
— application logs,
— other data sources,
— inventory (CMDB, …)
- Business-level visualization.
Conclusion
Splunk is open-source software and is distributed for free. We are currently in the process of integrating Splunk with Zabbix.
If you are interested in Splunk, you can send a request to [email protected] or look for Christian Anton on LinkedIn or Instagram.
Questions & Answers
Question. If we use this kind of integration, are there any performance issues caused by Splunk or some misconfiguration?
Answer. We have been using Splunk for installations with several tens of thousands of monitored hosts and from hundreds of thousands up to millions of items and have not seen any performance implications.
Question. How does this connector work under the hood? Does it use the API or direct queries to the database?
Answer. We rely on the API. Besides, we can fetch the data directly from the database.


Hi Christian,
There is an interest coming from community – where we can follow with the project, may be a GitHub repository? Can you share template (media type including JavaScript) within the blog post?
Hi Christian,
I’m interested in Splunk getting data from Zabbix to analyze agent issues.
I don’t know if you can show me in detail how to configure and set up the connection for Splunk to receive data from Zabbix?
Thanks