


For a few years, I’ve been monitoring 3 Digital Ocean servers with Datadog and using Datadog DogStatsD to submit custom metrics to Datadog. I am a big fan of Datadog and will continue recommending them. However, it became a bit too expensive for my needs, so I started looking for alternative options.
I decided to go down the self-hosted route as that was the least expensive option. I decided to go with Zabbix.
If you don’t know, Zabbix is a completely free, open source, and enterprise-ready monitoring service with a vast range of integrations for all of your monitoring needs. You can choose to install it on-premises or in the cloud.
I went with a $24 Basic Droplet in Digital Ocean with Regular SSD, which is actually below the minimum requirements that Zabbix specifies. It has been working fine and resource usage is minimal (around 40% RAM and 4% CPU use).
When you create a host to monitor, you assign templates. The templates are integrations you want to monitor, such as Apache, MySQL, and general Zabbix agent metrics like server performance (CPU, RAM, IO, etc.).
There were some things I had to create manually (including process monitoring) as I couldn’t find a built-in way of doing it. Datadog, had live process monitoring, so you could create a monitor which looks for a particular process, and then alert if that process wasn’t running.
Zabbix didn’t seem to have anything like this (that I could find) so I created custom templates and a custom shell script to look for the process name using the ps command (on Linux).
Another important function I needed was custom metric submission. This was originally done via the Datadog DogStatsD libraries available in pretty much any language, either as official libraries or via community versions. This would submit UDP data to the agent running locally on the server, and the agent would submit it to your Datadog account.
I didn’t want to rewrite all my apps to be able to send data to Zabbix, so I built a conversion tool. Its a small app I built in C# that listens on the same UDP socket as the Datadog agent (obviously, you’ll need to have the Datadog agent turned off). It receives the data from the Datadog DogStatsD libraries as normal, and the C# app converts the Datadog UDP data and submits an HTTP request to the Zabbix server via its API.
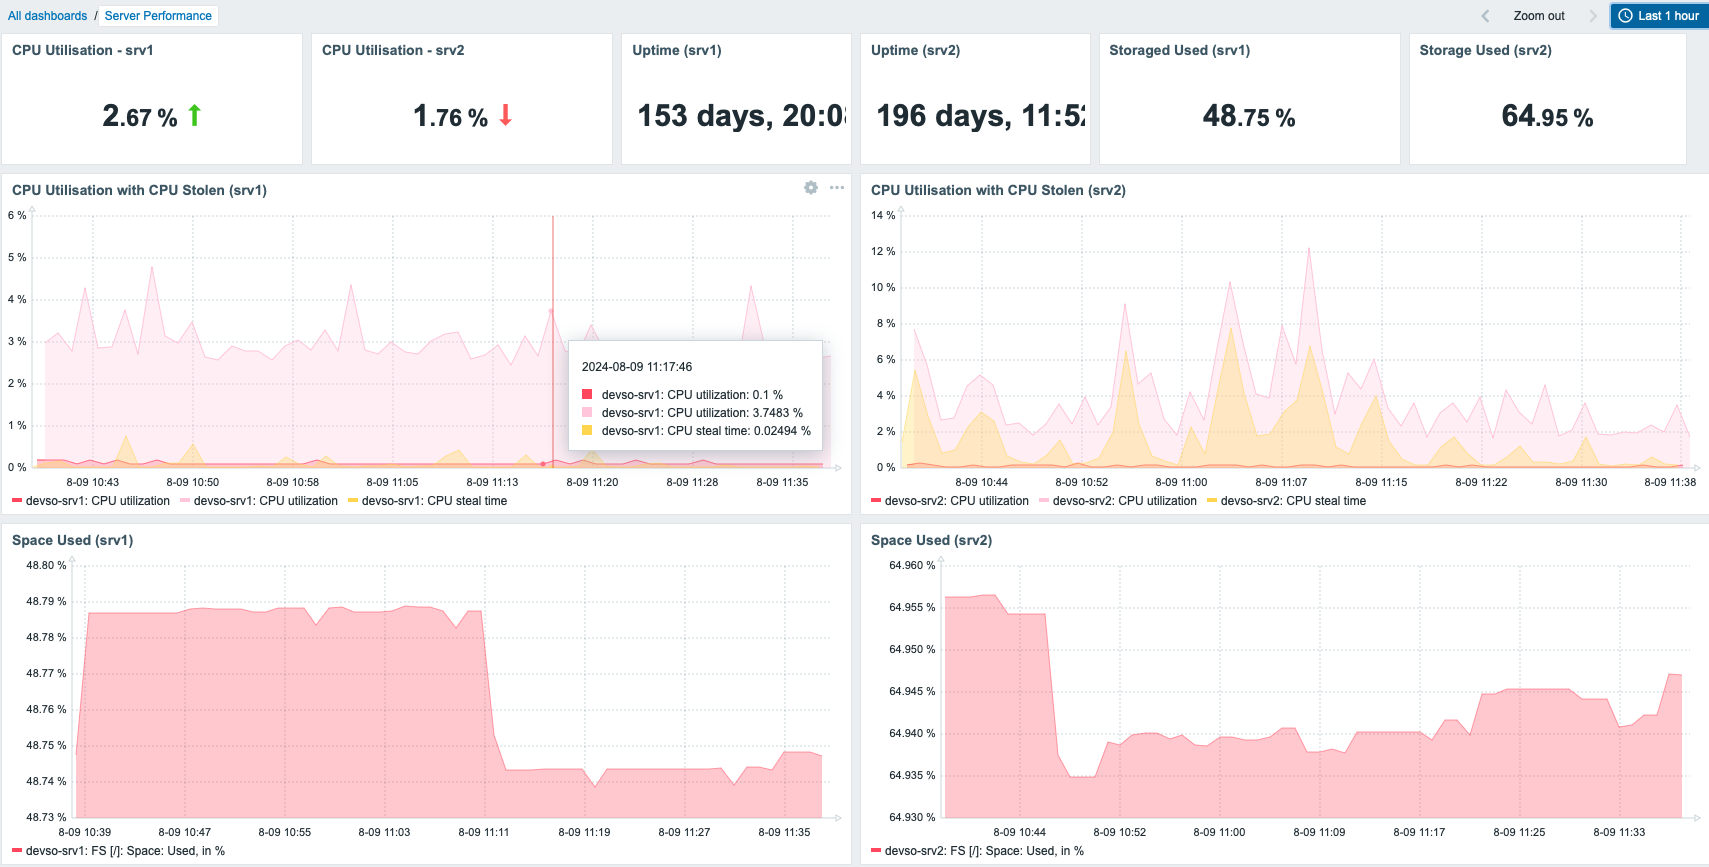
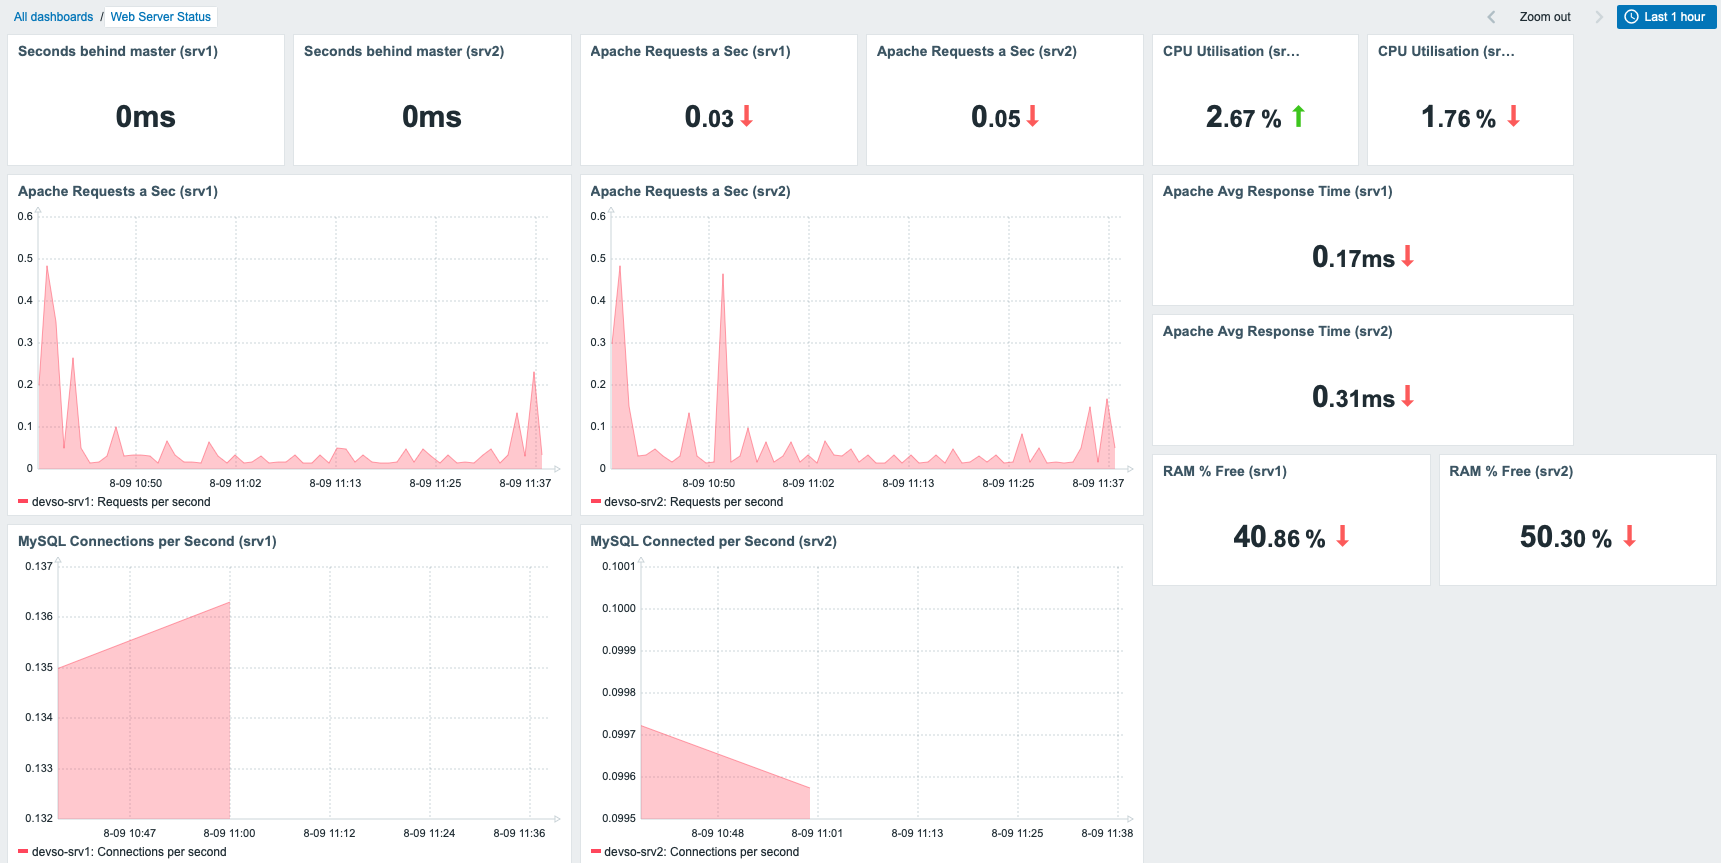
After everything was installed, I then re-created the various dashboards that I had from Datadog in Zabbix. A couple of examples are below:
In terms of access and configuration, all of the metrics are sent over the private interfaces of each droplet. Nothing is available via the public interface.
Logging into the Zabbix web portal is done via a Cloudflare Tunnel that allows me to connect to the web portal over the private interface via the Cloudflare tunnels running on each of the servers for fault tolerance. This provides multiple levels of authentication, as you have to authenticate to Cloudflare and authenticate with Zabbix.
This post was designed as an overview to show that it is possible to migrate from Datadog to Zabbix fairly easily, with a small amount of development involved to convert Datadog custom metrics to Zabbix via the C# app.
The C# app isn’t publicly available, but if there is some demand for it I can look at open sourcing it. If you want a full rundown of how I migrated and set up the Zabbix server and the servers being monitored, please let me know and I can do a more in-depth blog post!


Great post, I’d be interested in the C# app if you decide to open source it.
Thanks Vartan, it does have some limitations as it only works with increment (with my own implementation) and gauge methods as that’s all I used in my own apps.