This week’s blog entry comes to us from Nyein Chan Zaw, who is based in Bangkok, Thailand and works as an Infrastructure Specialist for Green Will Solution. Read on to see how he uses his integrating a Modbus protocol with Zabbix to monitor data from temperature, humidity, and smoke sensors — and display their metrics on a Zabbix dashboard.
Step 1: Collecting Sensor Data via Modbus Protocol
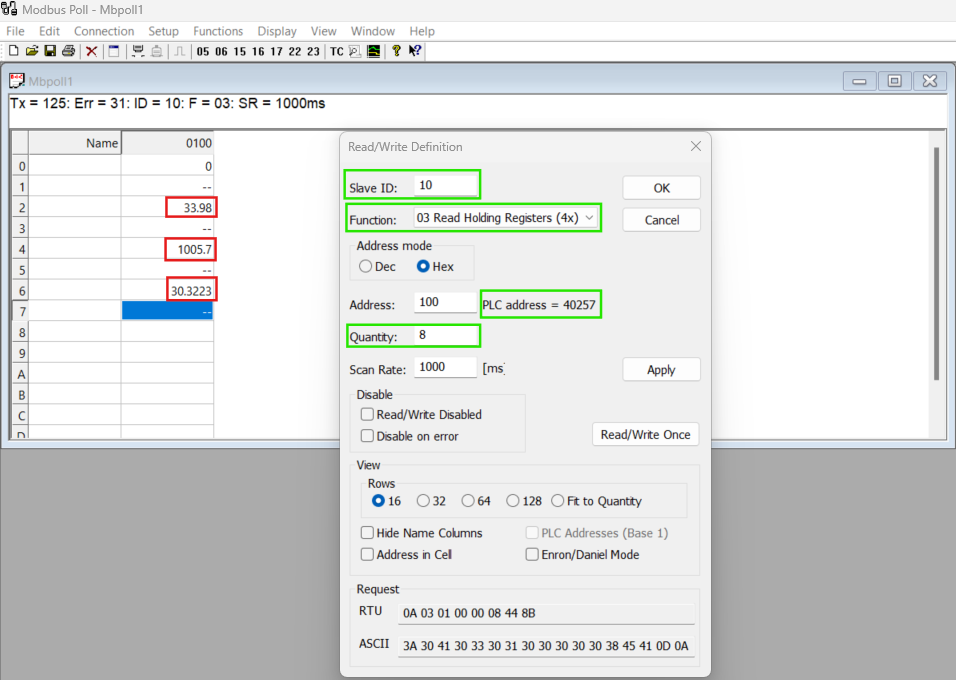
In the initial setup, the temperature, humidity, and smoke sensors transmit their data to the Modbus protocol. This data synchronization can be visualized using Modbus polling software, where the values from each sensor are displayed in real-time.
Step 2: Configuring Modbus Files on Zabbix Agent

To enable Zabbix to communicate with Modbus, the Modbus configuration (MB) files must be set up in the Zabbix Agent configuration file on the Zabbix server. Each sensor requires an individual MB configuration entry, specifying the Modbus parameters such as function code, register address, and data type.
Step 3: Creating a Host for Modbus Protocol in Zabbix
Next, a Zabbix host must be created to represent the Modbus protocol device.
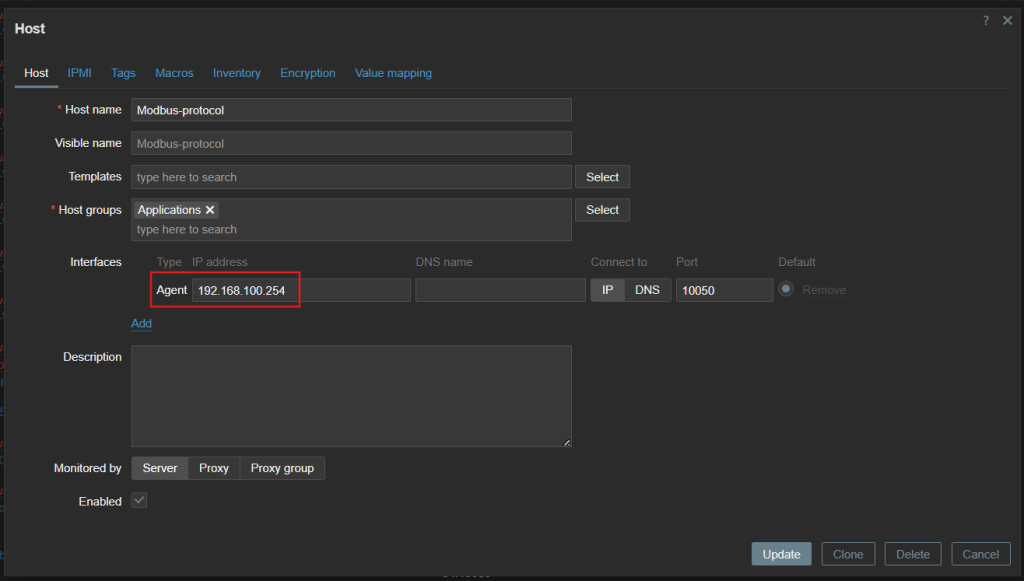
During this process, assign the Modbus protocol’s IP address as the host’s interface. Configure the interface to communicate with the Zabbix server using the Zabbix agent.
Step 4: Configuring Items for Each Sensor
Each sensor requires an item in Zabbix to capture its data.
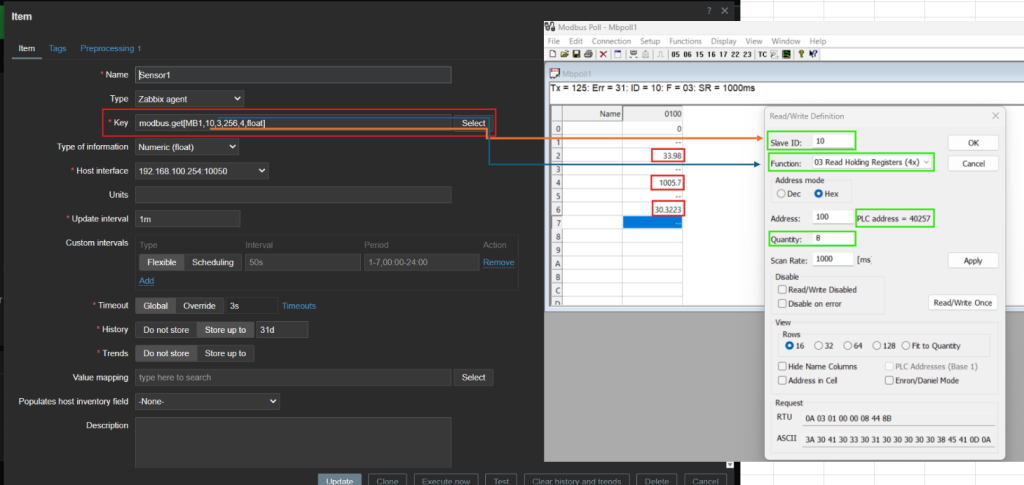
For every item, specify the Name for identification (e.g., Temperature Sensor). Define the Key, which includes the Modbus protocol function and register settings, to ensure accurate data retrieval.
Step 5: Viewing and Utilizing Sensor Data in Zabbix

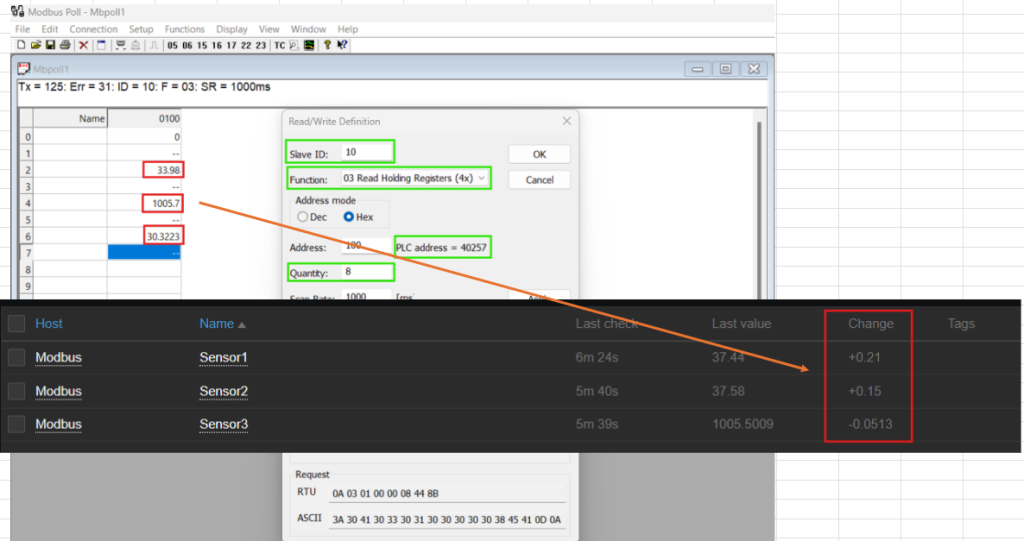
Once the host and items are configured, Zabbix starts collecting data from the Modbus protocol. This data is displayed in the Zabbix interface, where metrics for temperature, humidity, and smoke are updated in real-time. Additionally, a custom dashboard can be created to visualize all three sensors’ data at a glance, providing actionable insights for monitoring and decision-making.
Conclusion
Integrating Modbus with Zabbix streamlines the monitoring of sensor data, making it easy to collect, visualize, and act upon critical metrics. This process demonstrates Zabbix’s flexibility and scalability in managing industrial protocols and data sources, ensuring robust monitoring for diverse applications.
If you’re looking to implement similar solutions or need help integrating Modbus with Zabbix, feel free to reach out in the comments below!


 Prev Post

