


Multi-tenant architecture quite often is a primary requirement. When we think not only about monitoring our own infrastructure, but also about providing monitoring as a service for our customers, many questions come up in terms of design and required software functionality.
For example, how to split all customer setups in one single monitoring server installation, and even more – how to maintain and manage all this configuration. We can achieve this using the enterprise-level, open-source monitoring system called Zabbix, and we don’t need much customization as built-in functionality provides all the necessary things.
Contents
I. Multi-tenant monitoring problems (0:28)
1. Remote locations (1:29)
2. Same IP address (5:24)
3. Permissions (9:16)
4. Advanced visualization — Grafana (19:14)
II. Conclusion (21:01)
Multi-tenant monitoring
Zabbix is capable of monitoring a multi-tenant environment, including our own infrastructure, data centers, remote offices, and all our services, as well as multiple customers that could be located in different cities or countries with their own specifical environments and setups that might include services that are entirely different one from other. Even multiple teams within one organization could be separated and managed independently with their own permission settings and monitoring configuration.
The main fears with multi-tenant monitoring are:
Remote locations
The monitoring of your company or your clients’ remote offices in other countries or other cities is often performed out of the headquarters or some central office where the Zabbix server is installed. In that case, it is absolutely understandable to question – how we will connect to remote locations not only from a monitoring software perspective but also from networking and security concerns.
Zabbix may establish a connection to the remote office via Zabbix proxy. Generally, no customer would allow a direct Internet connection to their services or devices. So, Zabbix proxy is installed inside the remote environment, and Zabbix Server is communicating with the Zabbix proxy. Zabbix Proxy allows for choosing a direction of the connection (outgoing or incoming), and usually, an active Zabbix proxy is used, which assures that all connections will be only outgoing from the Zabbix proxy to the Zabbix server. In simple words, Zabbix proxy is responsible for connecting to the Zabbix server and requests all configuration, which will contain data about all devices and metrics Proxy has to collect. After data is already acquired in a remote location, the Proxy will send this data to the Zabbix server for analyzing. Since we are talking about remote locations, and the link between endpoints might not be the fastest or most stable. It is also possible to configure simple parameters on a Proxy side to back-log collected data for a selected period of time in case if because of some reasons it is not possible to send this data to Server.
The number of proxies connecting with a single server is unlimited. To make monitoring even more secure, the connection may be encrypted using, for instance, TLS 1.3 encryption with Certificates or pre-shared keys.
Same IP address
If we monitor multiple private environments, which most likely will have some sort of services and devices that will share an identical private IP address. A simple question would be – how will this work in our Zabbix server perspective if we have multiple customers who will have similar IP addresses.
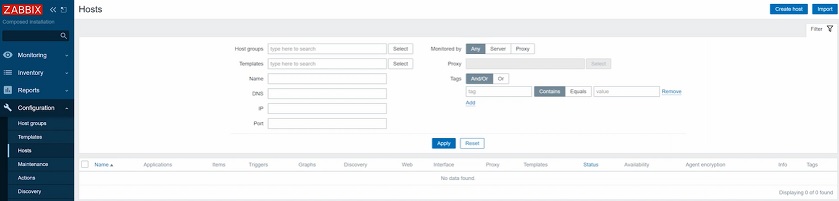
First, we create a new host, the data source, in the Configuration > Hosts > Create a new host.
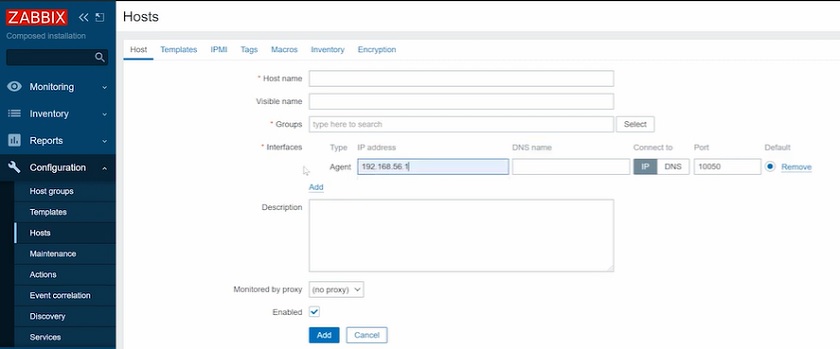
Host IP address
NOTE. Here the data in the Interfaces field will determine the connection — the IP address or the DNS name.
The uniqueness criteria will be the Zabbix proxy with a unique name, not the IP address. Zabbix Proxy is created in the frontend, and its parameters are defined in the configuration file.
The Proxy is created in the Administration > Proxies > Create Proxy.
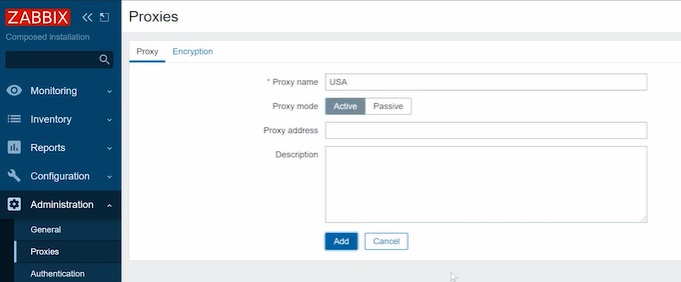
Adding new Proxy
NOTE. The proxy name in the proxy configuration file must be the same as defined in the frontend.
Then we must choose which host will be monitored by which Proxy.
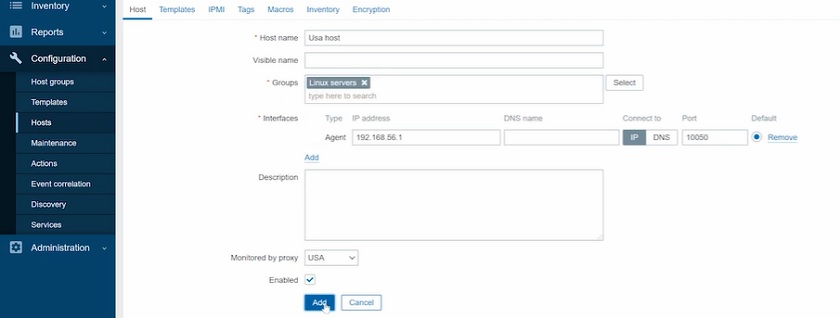
Selecting Proxy for the host
So, the Zabbix Server will send the configuration to the selected Zabbix proxy, which collects the data from the specified IP address and has no access to another remote location. This allows us to monitor identical IP addresses that are split by multiple Zabbix proxy installations.
Permissions
Customers who are receiving monitoring as a service usually want to see some visualization graphs and reports about their environment. To do that, we can provide credentials — give the customers the passwords to log into the frontend through VPN, but keep in mind that this frontend most likely will be installed in our headquarters, and then our own security concerns might not allow such a setup.
An important point is that Customers should not see any information about each other. This includes both – collected history data and potential problem history and also any configuration data from Configuration > Hosts, which could contain sensitive data such as passwords and other credentials.
To solve this problem, we can define permissions in the Permissions tab when creating a new user in the frontend in Administration > Users > Create user.
The permission system in the current Zabbix version is quite simple and is based on two parameters: host groups and user groups. We have three user types: Zabbix User, Zabbix Admin, and Zabbix Super Admin.
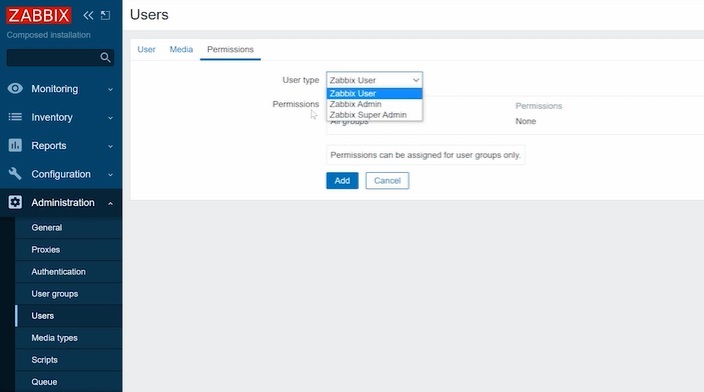
Defining permissions
NOTE. Permissions in case of multi-tenant monitoring services should be configured at the stage of the Zabbix instance deployment as it will be much more time consuming to do that after everything is configured.
- Zabbix User will see only the Monitoring, Inventory, and Reports tabs and won’t have access to any configuration data and won’t be able to create new hosts, change the configuration of items, triggers, etc.
- Zabbix Admin has access to the Configuration tab in addition to the specified three tabs. Zabbix Admin can change items, see passwords and items specified as plain text, change the triggers, templates, host interfaces, etc. Still, their permissions might be limited. By default, Zabbix Admin doesn’t have access to host data, while Super Admin will see all the data displayed.
Zabbix Admin no access by default
Permissions can be granted to the Zabbix Admin in Administration > User groups > Permissions. Here you need to select the group to which to grant permissions, then select permissions for the group, press Add, and Update.
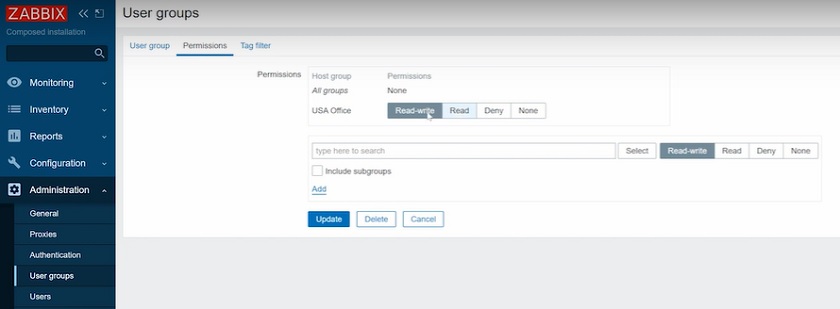
Zabbix Admin permissions
NOTE. If your hosts are in the same single group, it might be complicated to set up a granular permission system. You can change the host group in Configuration > Hosts.
NOTE. Make sure, every group of people has their own user group which you can use to assign permissions.
Permissions are the easiest way to split the data displayed in the frontend. The permission system in Zabbix allows for defining what we want our specific users and user groups to see.
If the host group and user group permission system are not enough, it is also possible to define permissions based on tags in Administration > User groups > Tag filter. That is, we can split a single host into multiple user groups. So, for instance, with the ‘Database‘ tag, the user will have access only to the database services.
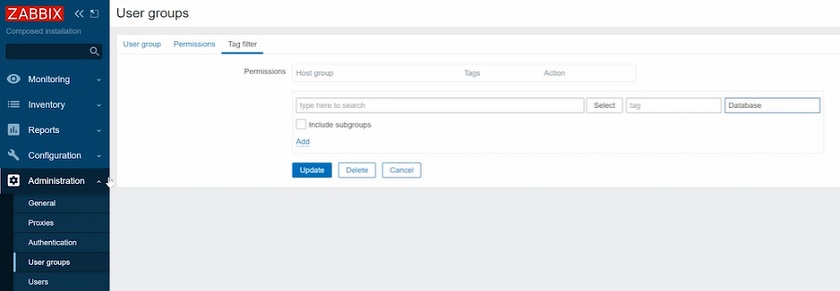
Tag filter
Advanced visualization — Grafana
It would be very complicated and not convenient to deploy multiple Zabbix frontends in each remote location connected to the same database in our headquarters. So, if you don’t want to give your customers access to your Zabbix frontend, another option is to install third-party software Grafana for these visualization tasks. First of all, Grafana will communicate with your Zabbix frontend and gather all the requested data. Grafana also has its own permission system, which will allow you to limit any data from unwanted eyes. Dashboards, however, can be created and shared with involved teams independently. Dashboards can be shared as a simple screenshot or HTTP snapshot that will allow end-user to dynamically work with graphs and widget in a period of time for which snapshot was created.
Conclusion
So, Zabbix can be used as a multi-tenant monitoring software. There is no limitation as to the number of proxies, expenses, and capacity of the proxies that will depend on the size of the environment you plan to monitor.
For your remote office with several computers, you can quickly deploy the Raspberry Pi and install Zabbix proxy from official packages, for instance, with the SQLite database with a modest memory. For bigger environments, you can deploy a more powerful physical or virtual machine with Proxy, for instance, with eight cores and 16GB of memory, and that Proxy will be easily processing thousands of new values per second and pushing all this data to your Zabbix server.
Remember that the Proxy is only collecting the data doing the pre-processing of the items, and then passing the data to the Zabbix Server, which is responsible for alerts and visualization.
—
Watch the video.


Hi, thank you for your explanations, I have a question regarding permissions. It looks like Admins are not allowed to create host groups (even nested in a group they own). So I can’t figure how a tenant can do to organize his tons of hosts ?