Learn more about Zabbix business service monitoring features and check out our real-life use cases. The article is based on a Zabbix Summit 2022 speech by Aleksandrs Petrovs-Gavrilovs.
Table of Contents
Business service monitoring with Zabbix
Hello everyone, my name is Alex and today I am going to write about Advanced business service and SLA monitoring and the related use cases.
Some of you may already be familiar with business services and the core idea behind them. In the vast majority of organizations, we have services that we provide to our customers or/and for internal use. The availability of those services is usually based either on hardware, software or people’s presence and availability.
But no matter how well our monitoring is configured, there are times when we can miss how each specific device affects our business and that is where business service monitoring can help us.
With the help of business service monitoring it is possible to see what exactly is going on with your business depending on the state of every single part of your infrastructure. This allows us, the admins and service owners, to understand what it really means when a piece of hardware breaks or a device becomes unreachable. With business service monitoring, we see what exactly impacts our business and how severe the situation is, including calculating SLA (Service Level Agreement) and evaluating it against the defined SLO (Service Level Objective).
Business service hierarchy example
So let’s check out some examples of what business real-life business services may look like.
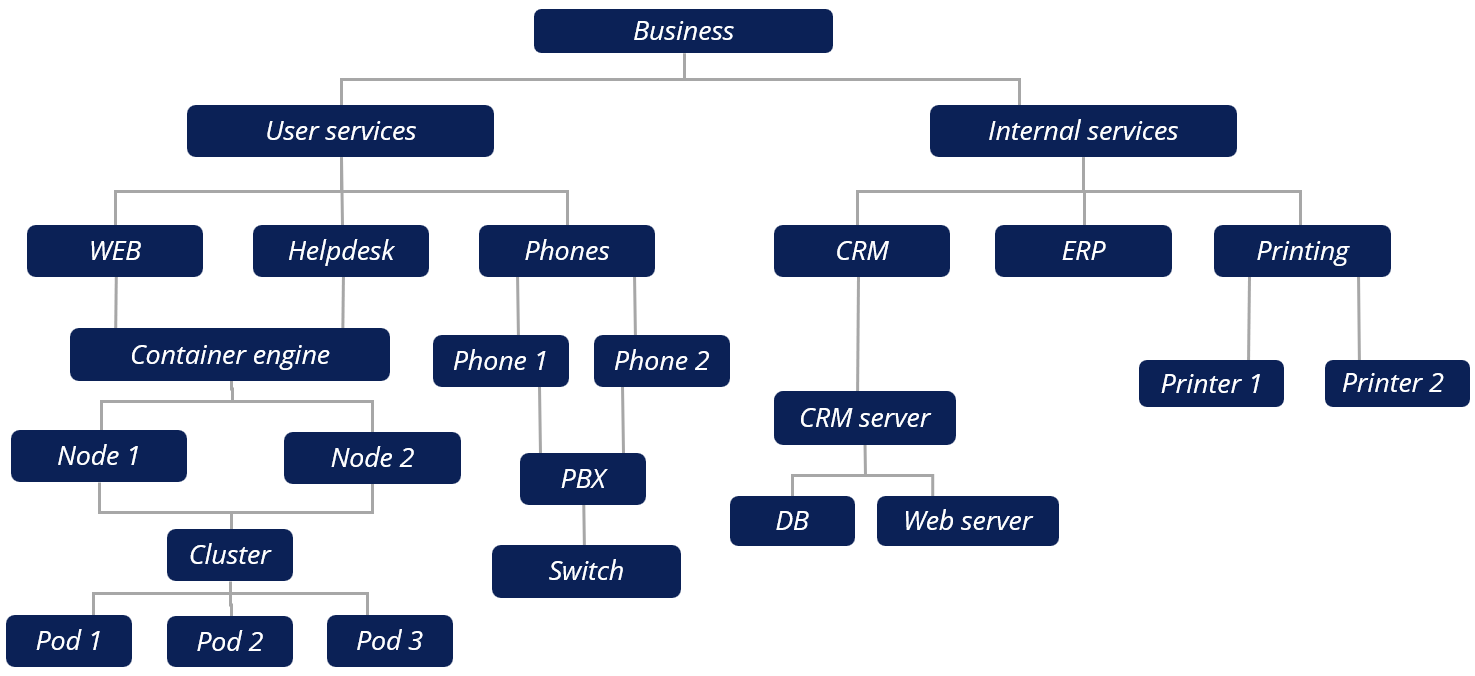
In this example, we have a service tree that is based on support services. It has phones and phones are plugged into PBX, while PBX is plugged into the switch. And this is just one example, in reality, we could have a more complex infrastructure consisting of containers, CRM services and so on. And we of course monitor all of them, but what if we are interested in the business perspective as well?
To see the business perspective we need to go to the new service section in the main menu, where we can create and view the service tree itself. In addition, in the same section, we can configure the actions, which enable us to react in cases when something happens with one of the services.
We can also specify the SLO we strive to achieve and see SLA reports on the current situation.
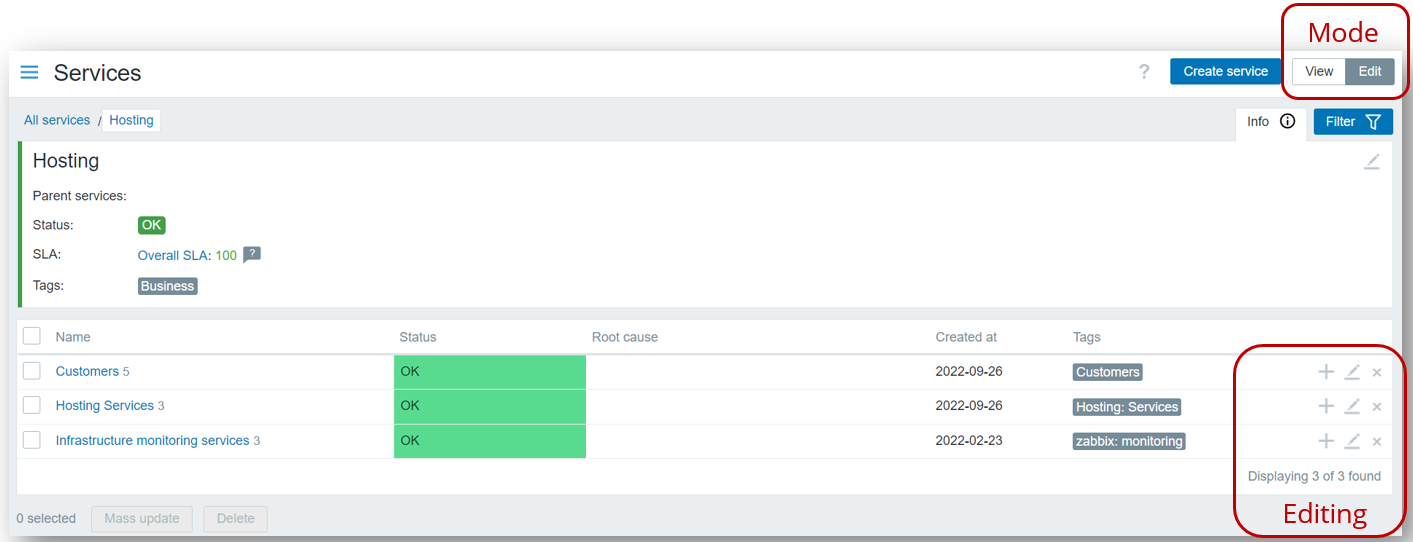
The service view also lets us see if we have problems affecting our services and track their root cause.
Defining which service is affected by what problem is done by utilizing problem tags, which essentially link them together. Services can also have their own tags, which we use to group services and understand how one service relates to another. We can also use service tags to build an SLA report or execute actions in case a service is affected by a problem. Permissions too are based on service tags, allowing to creation of different views for different users.
But those are just the basics – what’s more interesting are the actual use cases. Let’s take a look at how Zabbix users actually use business service monitoring to their advantage based on real business examples.
Business service tree for a financial institution
Real business service use cases can be helpful examples that can help you design your own Zabbix business service trees. Maybe you already have a similar business of your own and you need that starting point for everything to “click” – that starting point can be a real-life example.
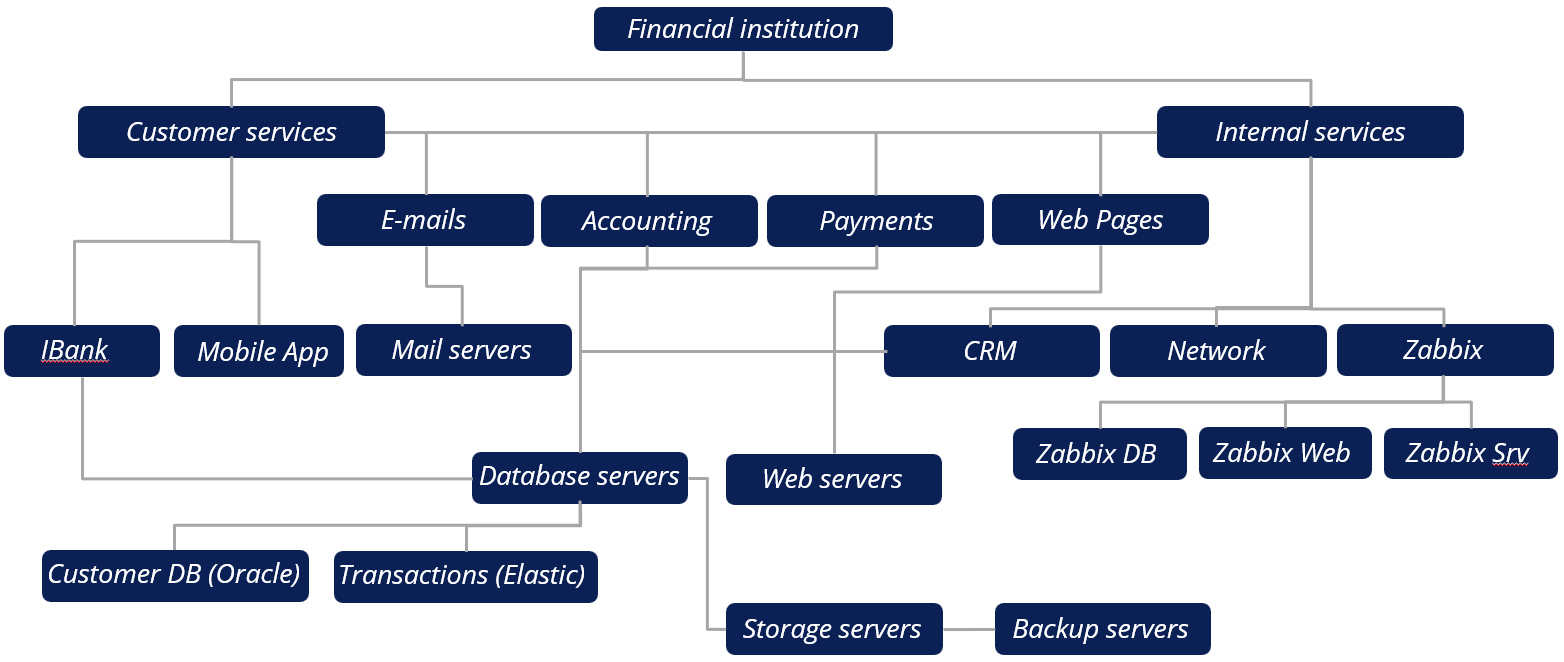
The first example will seem a bit convoluted while actually being very straightforward. Here we can see an actual financial institution business service tree. You can see they have quite a lot of different interconnected services. First look at the service tree raw schema may be a bit confusing, but in Zabbix it’s pretty straightforward.
The internal service is connected to emails and emails are related to customer services at the same since we do need to communicate with the customers, not only internally! In addition, we also have to define services representing the underlying systems and applications which support our email services. That is easy to do with Zabbix services.
Imagine now, if you don’t have the services functionality at all, how fast can you check the status of the email service when all you have is only a list of problems for multiple devices? How can you check the service statistics for an entire year? That was the question that the service owners and administrators had in this use case and they solved it by defining Zabbix business service trees.

We start by defining the root business service – Financial institution. It is linked to 15 main services. The 15 services are grouped into internal or external ones. The lower-level services also contain the sub-services that the main services are based on. I.e., we have an Accounting service based on specific VM availability, where the accounting software resides on.
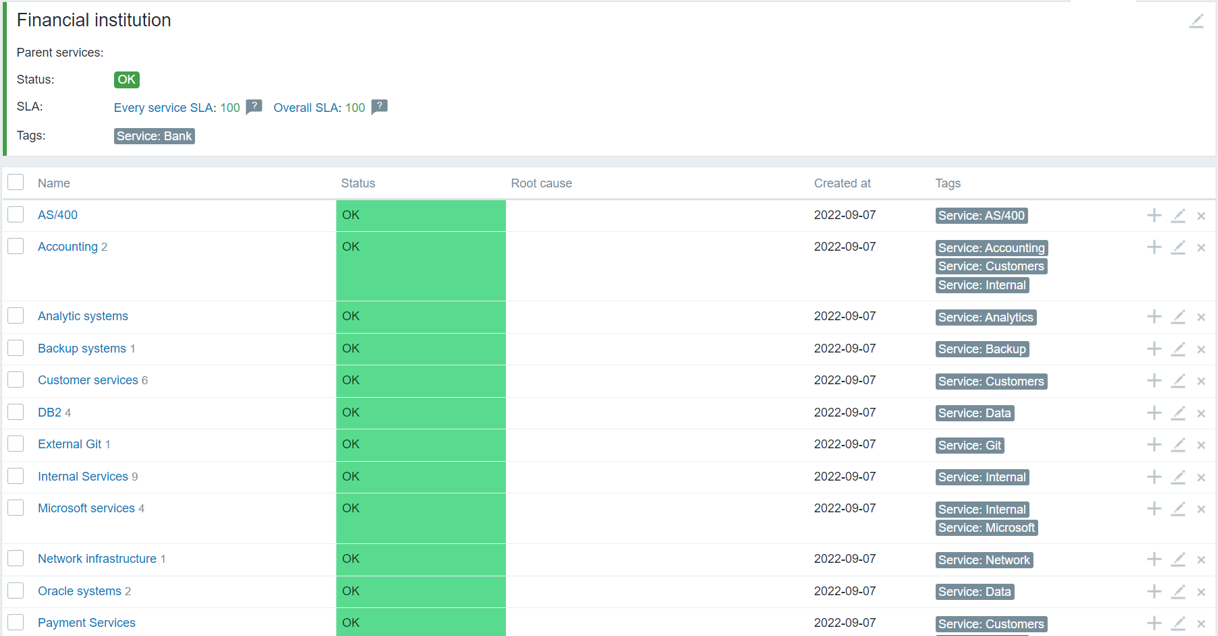
The services are divided into specific categories so the service owners can read the situation a lot easier without spending a lot of time figuring out which problem causes which situation. With a single click, the service owners can immediately see which components or child services each service is based on and the actual service SLA. This also gives the benefit of displaying the root cause problem and being able to quickly identify which child services are causing issues with a particular business service.
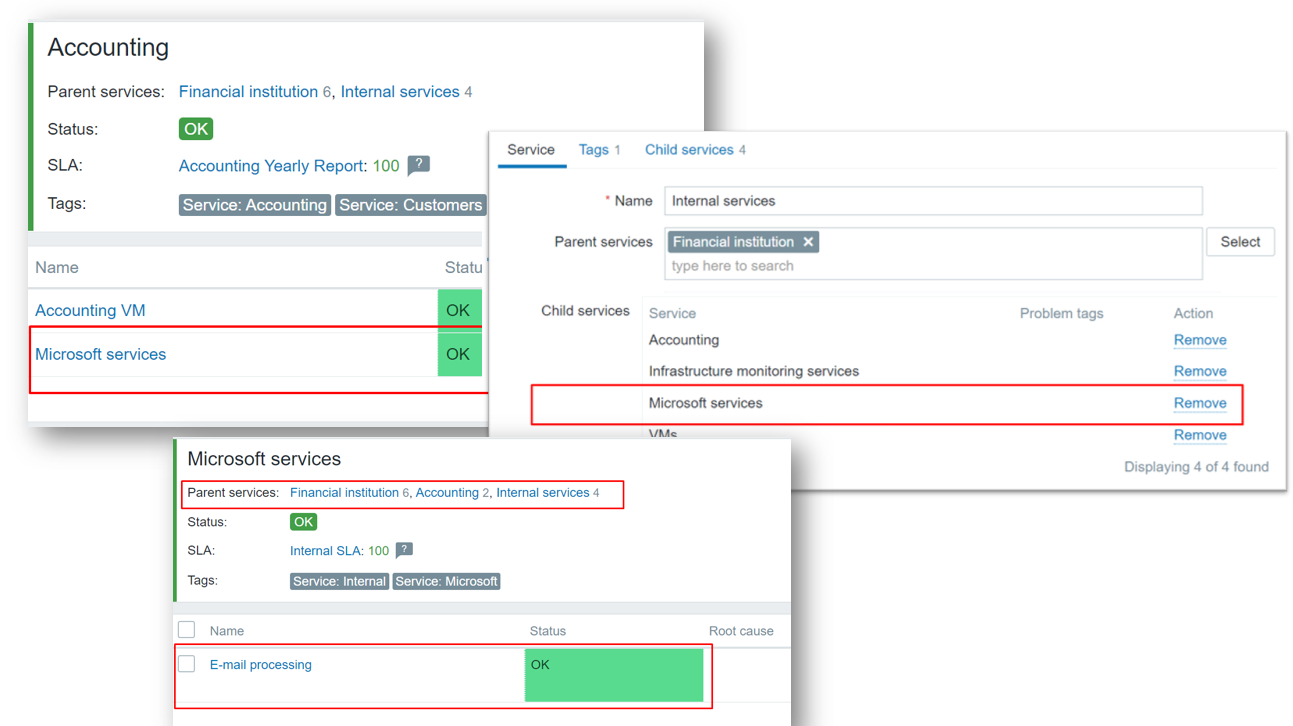
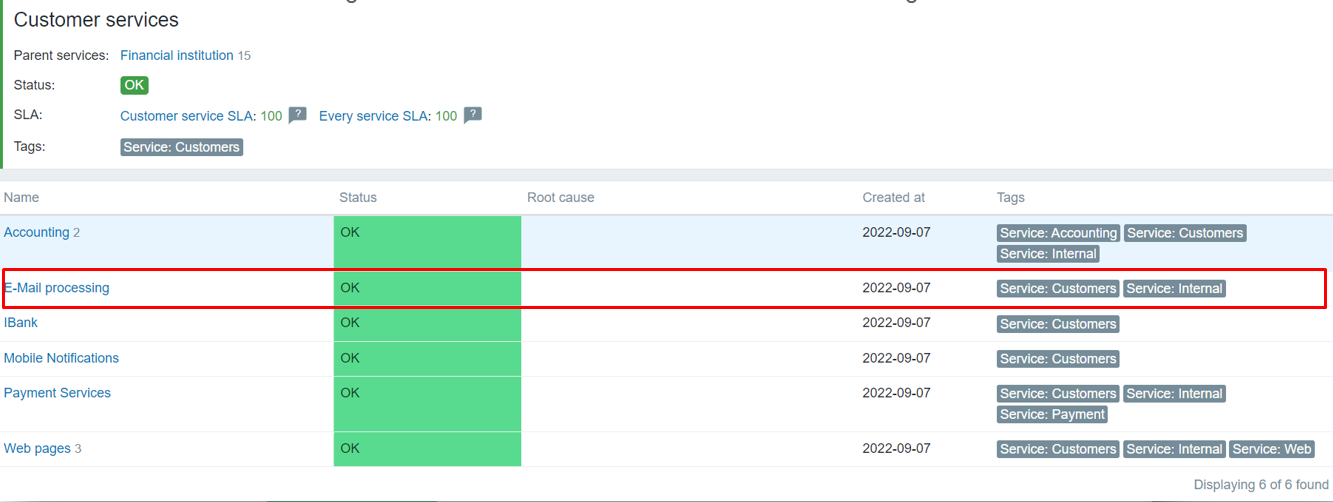
Don’t forget, that the business service trees can be multi-level – child services can have their own child services and services can also be interconnected with each other. For example – in the Parent-Child service relationship screenshot, we can see that we have an Accounting service. Accounting uses Microsoft services. Microsoft services are also used internally. So what happens when Microsoft services stop working? We will know that accounting will be affected, the internal services will be affected and we will see the exact chain of events – what and how exactly went wrong in the organization and which components need fixing.
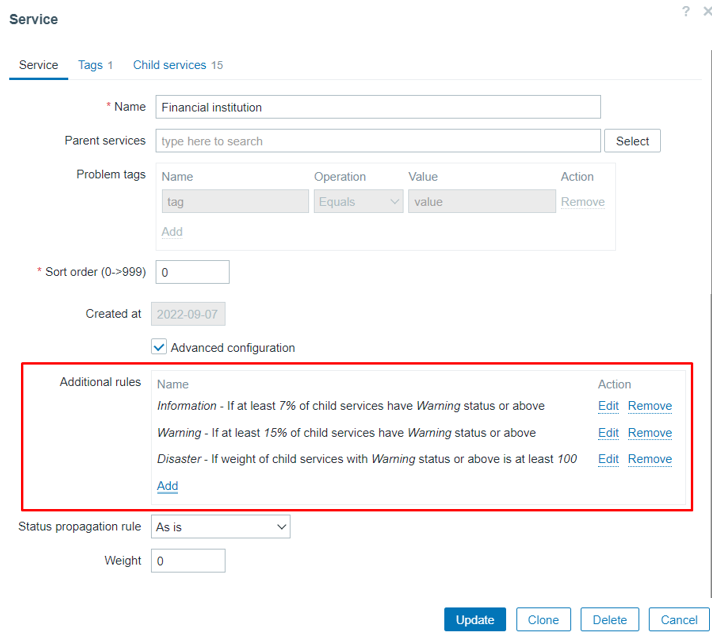
Services can have a varying impact on your business. Some services are more critical than others. Additional rules enable Zabbix to take the potential service impact into account. The first two additional rules analyze the percentage of affected child services and set the severity of the service problem accordingly.
But if the two most critical services are affected, that will immediately become a disaster. For example, online banking – you can imagine that any bank now has an online banking service and if it goes down – all the customers will be affected; it could even hit the news, not only monitoring. So of course they want to immediately know about that kind of a disaster, and with Zabbix services – they will. By defining additional rules and service weights, you can react to problems preemptively and fix the issues before they cause downtime for your end users.
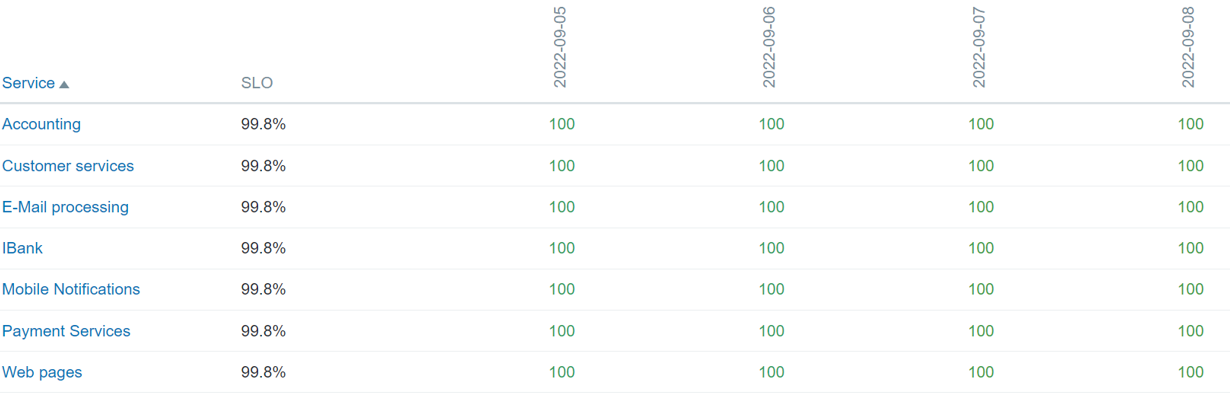
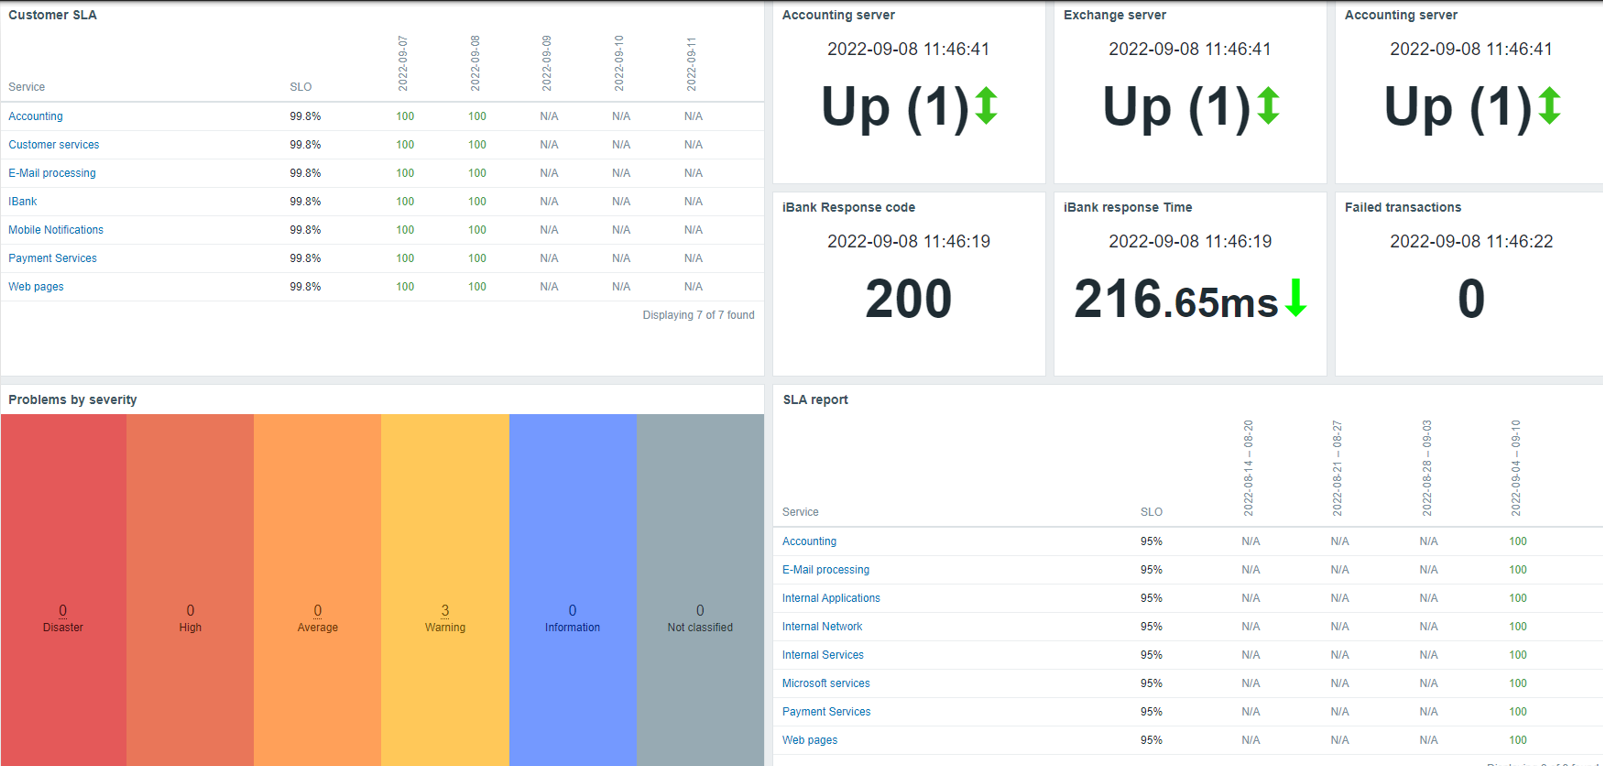
In Zabbix, we can choose for what periods SLA should be calculated – daily, weekly, monthly, yearly, or a mixed selection of those. Based on our selection, we can see real-time reports for services and as an example, by the end of the year or a day, understand what needs the most attention and review the service performance. Or to put in a closer-to-reality example – find out by accounting reports if the licenses were renewed in time so that the software which is used by accounting is always available. We can also build a dashboard that will contain the reports, showing what is the current summary for the service so they can plan, buy new software, buy a new license and get new hardware and always be ahead again of whatever might happen.
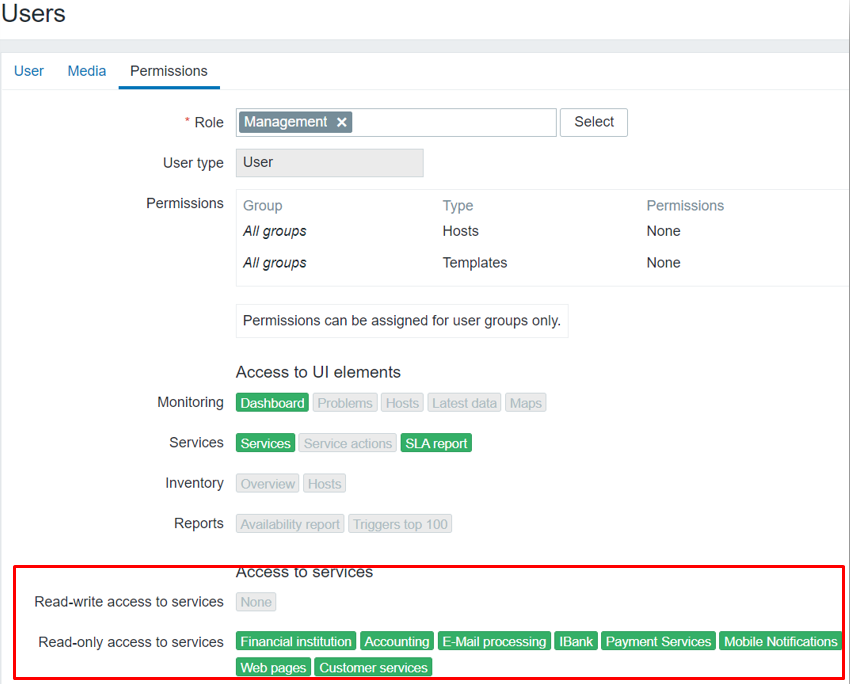
Service permissions in user roles can be used to create different service views. This can be used to hide sensitive service information or simply display the services at the required level of detail. For example, a more detailed view can be provided for internal support users since they will need as much information as possible to fix any service-related issues. Separate views can be provided for Accounting and Management teams, showing only the relevant data to ensure a quick and reliable decision-making process.
What if we want to make things even more simple for our Accounting and Management teams? We can use actions and scheduled report functionality to deliver the required information to the user’s mailbox without having them periodically log into Zabbix.
Business service tree for an MSP
Another example is an MSP (managed service provider) service tree. This use case is encountered pretty frequently and the tree is always easy to read even in the raw schema view as this:
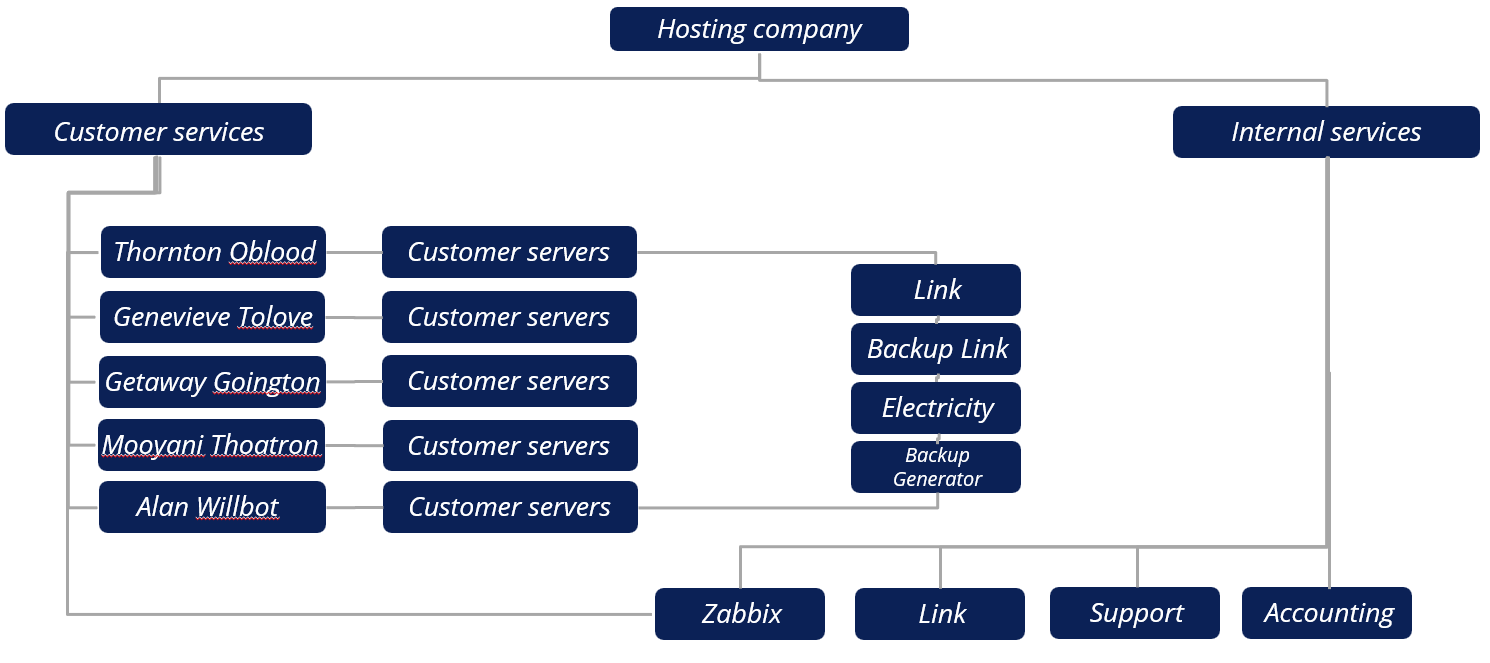
We use a hosting company for our example. The company provides a particular set of services for its users. There are also some internal services that can also be used by the customers – for example, Zabbix itself.
Zabbix can be a great tool in MSP scenarios since it’s straightforward to provide customers with access to Zabbix and build a dashboard view with the latest statistics related to a particular user.
In this example, we can see the main service which is hosting, divided across customers, where each customer is a branch of that tree, using the hosting services the company provides. We also see that monitoring is a service itself because in this case customers also have the advantage of using Zabbix to get detailed information about the services they use and their current state. Seeing the current level of SLA for the servers they use and does it match the expectations.
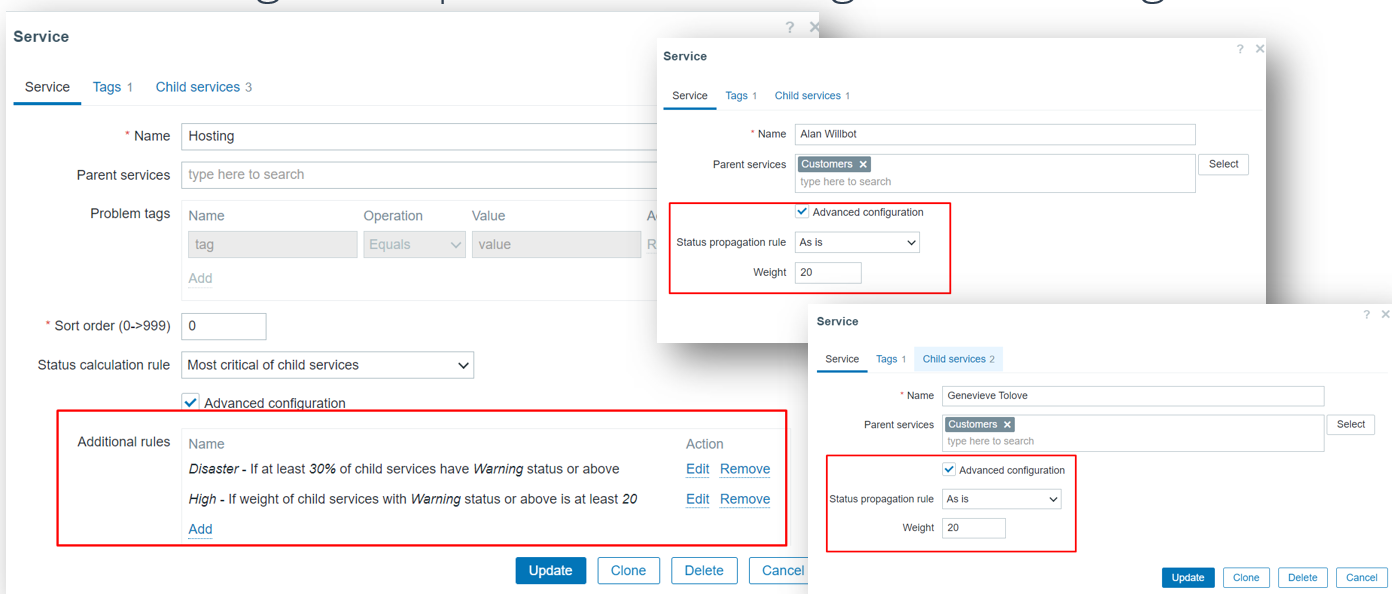
The MSP, of course, retains the full view of the customers and all customers are equally important and deserve a proper quality of service so of course each customer will have an equal weight assigned to them. As soon as any customer has a problem, the related service will be marked with a high-level severity on the service tree. This way, the MSP will immediately see which customer is affected, making it possible to assist them as quickly as possible.
If you have a bigger environment – maybe you have hundreds of customers, you may opt out of defining service weights in your configuration since the number of services changes very rapidly. How can we react to global issues then?
We can use percentage rules instead of reacting to just the static weight number. This way, we can check is the problem related to a single customer or is it something global and everyone is now affected.
Root cause view in the services will allow you to start fixing everything immediately. Meanwhile, each customer can be informed individually using the service actions and conditions. This should be easy to do if we have properly named or tagged the services.
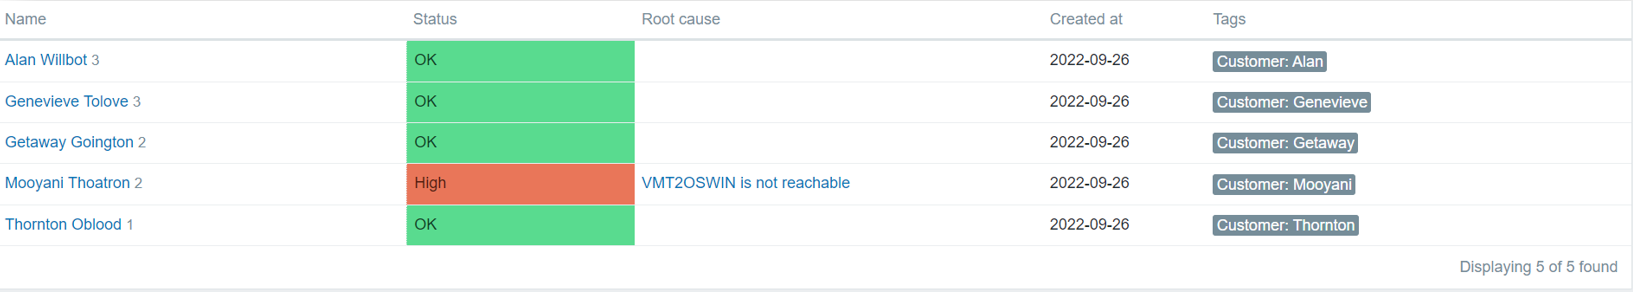
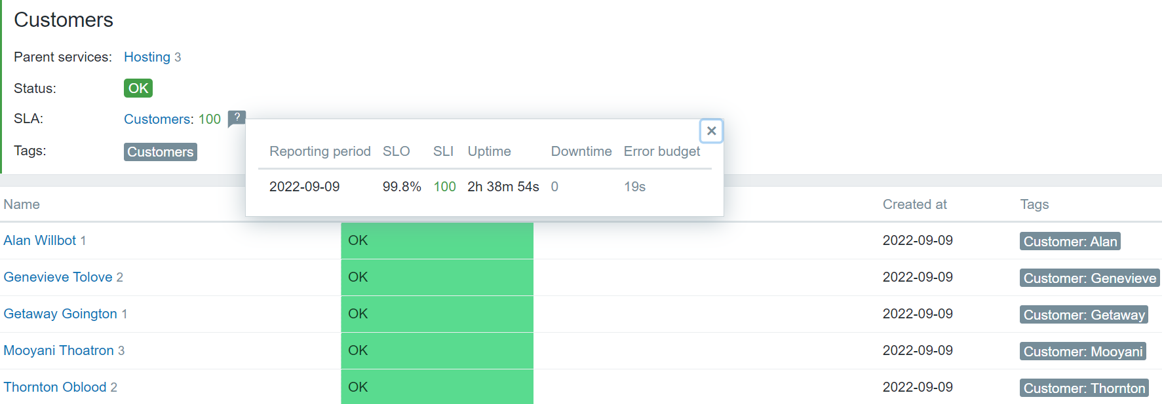
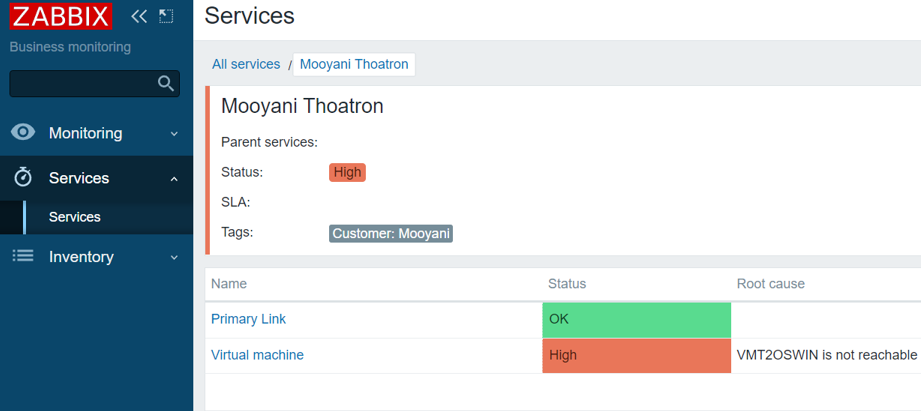
Don’t forget to define the permissions so that any customer, as Mooyani here, can have access to their Services immediately after login, ensuring that information not only remains private but also relevant for the current user.
All information for Customers can be placed on their personal dashboards where they can see all the details whenever they need to. Monitoring the traffic going through their VMs, resource usage, application statuses and any other monitored entities. Don’t forget that service SLA reports can also be placed on Zabbix dashboards. This way your customers can see that the MSP meets the terms defined in the agreement and everything is performing as expected.
To summarize – monitoring your infrastructure is great from any perspective, including business monitoring. it’s always a good idea to provide this view as an MSP to your customers, so they can see we meet the standards we define for ourselves and course promise for our users.