SEB Bank is a major financial services group based in Stockholm, Sweden. It serves northern Europe, particularly the Nordic and Baltic regions. Known for its digital innovation and commitment to sustainability, SEB offers banking, investment, and financial advisory services to individuals, businesses, and institutions, focusing on long-term relationships and financial stability. This case study, which shows how Zabbix helped SEB solve its log monitoring challenges, discusses aspects specific to SEB’s operations in the Baltics, where distinct systems and structures are in place but are aligned with the group’s overall approach.
The challenge
Between 2016 and 2020, SEB launched a unified IT platform for all three Baltic countries. They encountered a wide variety of challenges, including a distinct need to unify the monitoring area. Different countries had different tools and different attitudes regarding the way monitoring should operate. After numerous discussions and weighing the pros and cons of different monitoring tools, SEB concluded that the most effective way to achieve unification would be to (re)implement everything necessary with Zabbix.
It turned out that a great deal of valuable data for monitoring resides in logs. The logs varied in update frequency and structure, as did the requirements for data extraction. Some monitoring items were simple regex patterns to count matching entities or catch errors, while others had more complex logic, such as joining multiple lines for evaluation or dynamically detecting specific patterns to observe.
At the start of SEB’s journey with Zabbix, they were using version 3.0, which came with some now long-forgotten limitations:
- No
log.count[*]item yet - No PCRE regular expressions – only ERE was available
- Very limited dashboard and visualization capabilities
The solution
To address all the log-related challenges, SEB chose to leverage Zabbix’s “UserParameter” capabilities. This feature is invaluable for extending Zabbix functionality.
log.discovery
This custom approach relies on the ability to effectively convert regex capturing groups into LLD (Low-Level Discovery) objects. When new elements that need monitoring appear in the logs, corresponding monitoring objects can be automatically created in Zabbix. This process was covered in more detail at Zabbix Summit 2023.
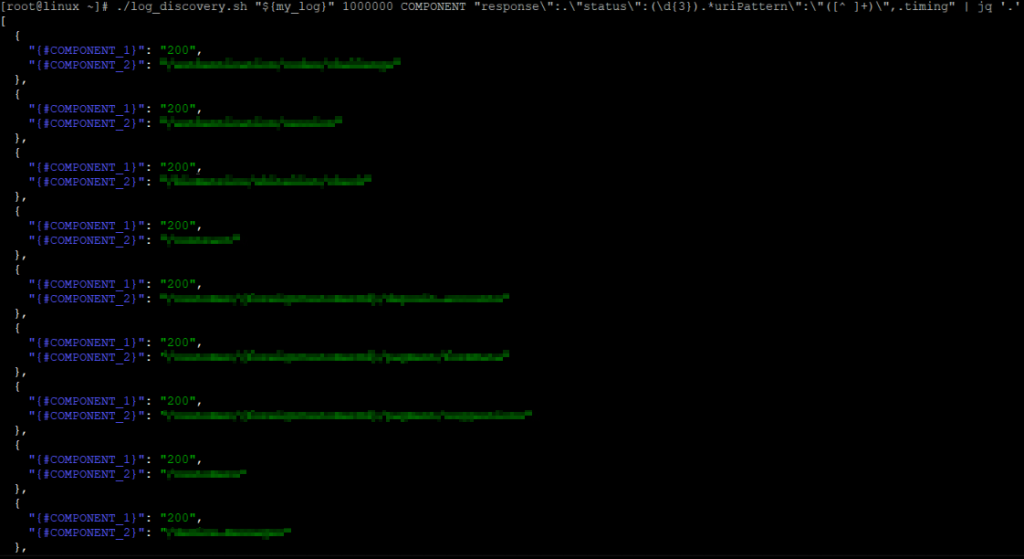
For instance, an effective set of metrics is extracted from logs to monitor the SEB mobile app. Request processing durations are logged alongside other parameters, enabling efficient grouping, such as by endpoint name and HTTP status code. This approach accommodates a wide range of potential combinations for “endpoint + HTTP status code”:
[root@linux ~]# ./log_discovery.sh "${my_log}" 1000000 COMPONENT "response\":.\"status\":(\d{3}).*uriPattern\":\"([^ ]+)\",.timing" | jq '.' | grep -c COMPONENT_1
205
[root@linux ~]#
LLD is able to gather them all:

For each discovered couple, monitoring of request processing durations is added, both for individual durations and 1 minute averages:

Certain significant combinations are enhanced with triggers, efficiently managed using the “Override” section in the LLD configuration to ensure they are created only for specific cases. So with this approach, some unexpected slowness can be nicely caught:

log.reader
For complex data collection scenarios, there was a need to implement a solution that allows data to be extracted from logs with minimal limitations. The approach was to create a log reading mechanism that could support any required data extraction logic on top of it. This was covered in more detail at Zabbix Summit 2024.
Zabbix agent 2
In addition to the mentioned custom log processing techniques, SEB had a good reason to use “Zabbix agent 2”. Both log[*] and log.count[*] are of the “Active” item type. These items are not processed in parallel by the Zabbix agent. In places with a large number of log-based items, “Zabbix Agent 2” was used, because it supports the concurrent processing of active checks.
The results
The ability to use LLD on logs was a game-changer and a lifesaver for SEB. Imagine hundreds of different items discovered from a single rule, along with the requirement to monitor any new entity matching a specific pattern as soon as it appears. Without LLD, meeting such a requirement would have been simply impossible. This approach covers many different areas, including mission-critical metrics such as counts of various requests and processing durations.
The ability to slice logs themselves and create any needed logic on top makes almost any custom log monitoring requirement possible. It gives the ability to analyze data in ways that wouldn’t be possible otherwise (e.g. average duration monitoring for large set of data).
In conclusion
SEB Bank in the Baltics relies heavily on data collection from logs. Zabbix is flexible enough to meet most of their needs when it comes to log monitoring, and – most importantly – it allows for custom implementations where required. This flexibility is highly appreciated, as it removes many barriers when monitoring the various components of SEB’s IT ecosystem and business functions.


 Prev Post


