In this article, we’ll explore how to use Zabbix to monitor a MikroTik device via SNMP, using specific templates that allow you to visualize the status of interfaces and their performance. Read on to understand how to use network monitoring to ensure the correct operation and performance of devices in an infrastructure employing the SNMP protocol.
Table of Contents
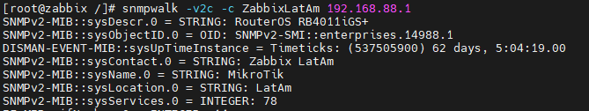
Verifying SNMP communication
Before you begin, make sure that SNMP communication is configured correctly on your MikroTik device. Also, set up an appropriate SNMP community for your equipment.
Create a host in Zabbix
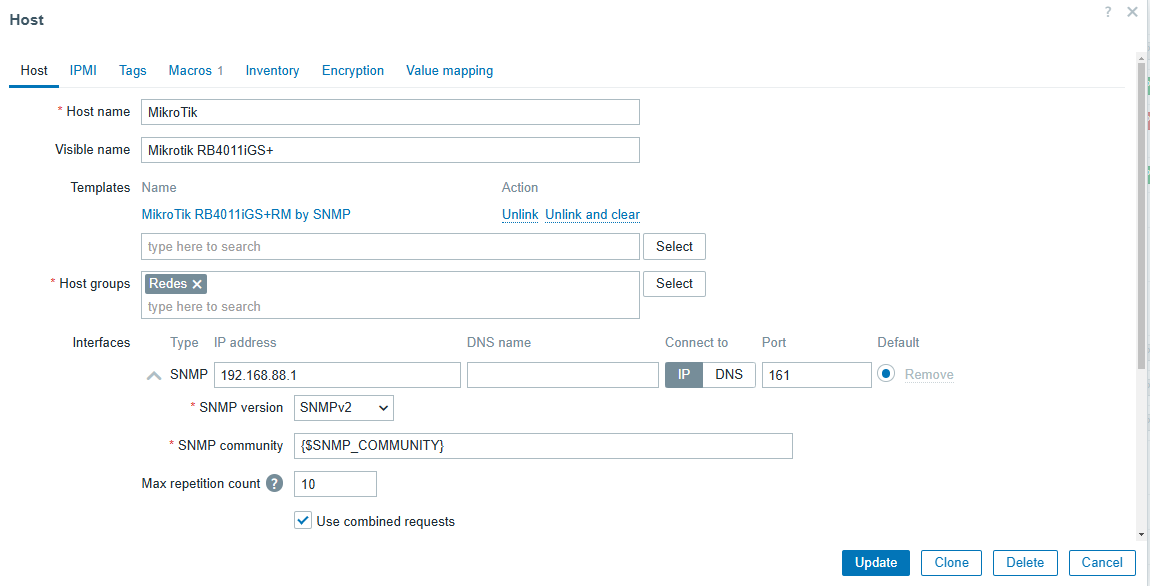
Once SNMP is configured, go to Data Collection > Hosts > Create Host.
Here you will need to enter the basic details of the device, such as the name, IP, and the group it belongs to. If you are working with multiple MikroTik devices, organize the hosts into groups according to their characteristics.
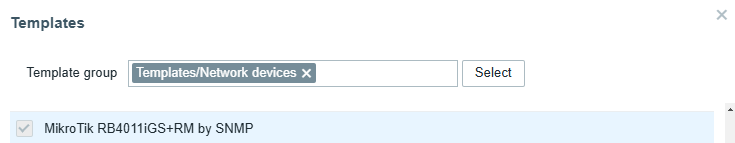
Apply a template
Zabbix offers a wide variety of default templates that fit different device models. By selecting the appropriate template for your MikroTik device, you will be able to view all its resources efficiently.
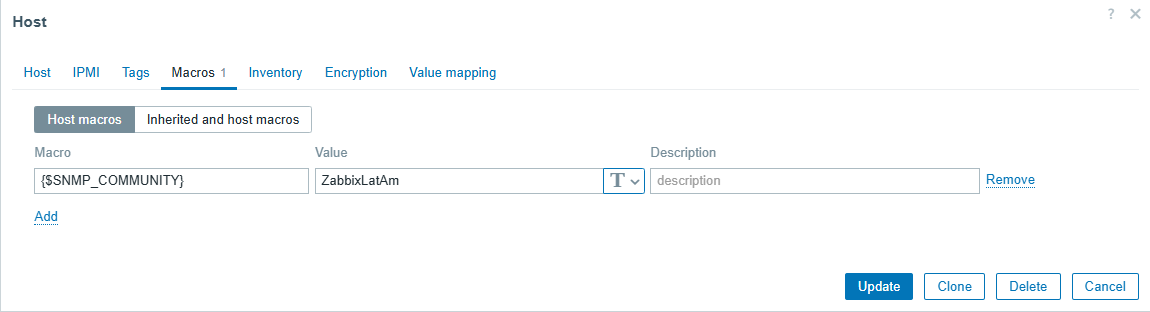
Configure SNMP macros
In the Macros section, specify the SNMP community you previously configured on your MikroTik.
Then, click “Update” to save the changes. This configuration will allow Zabbix to access the device data.
If you are monitoring multiple devices using the same SNMP community, it is best to configure a global macro in the path Administration > Macros.
This will allow you to efficiently manage a network of devices without having to configure them individually.

Visualization and monitoring
After completing the above steps, you will be able to start viewing device information directly in Zabbix, including:
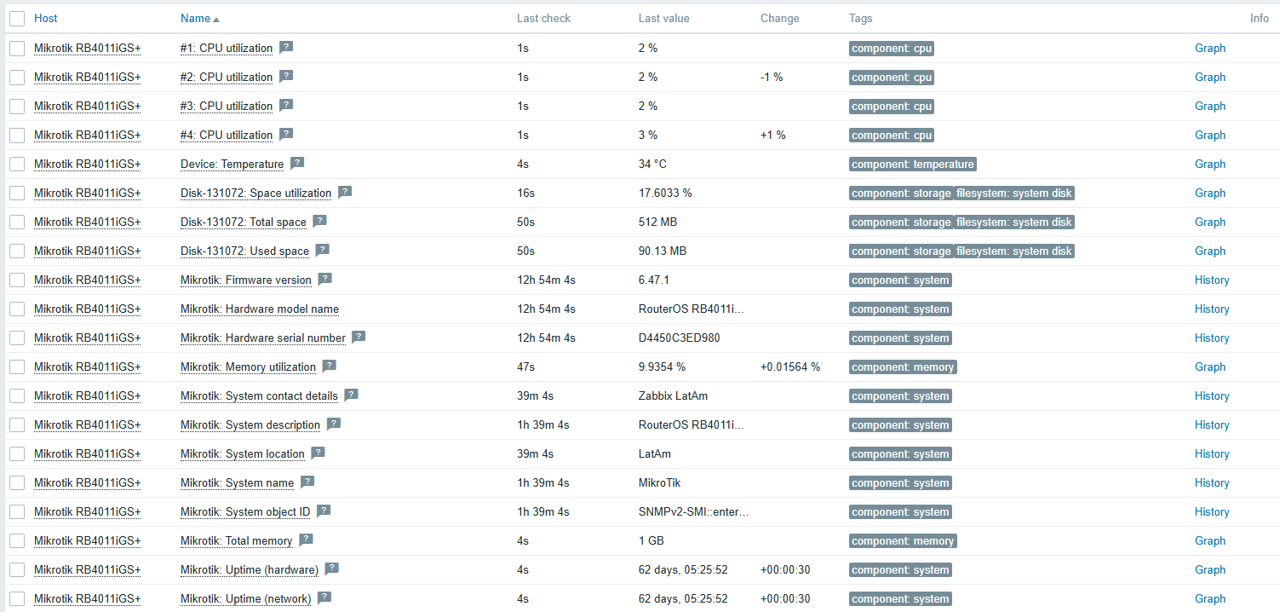
Overall device performance:
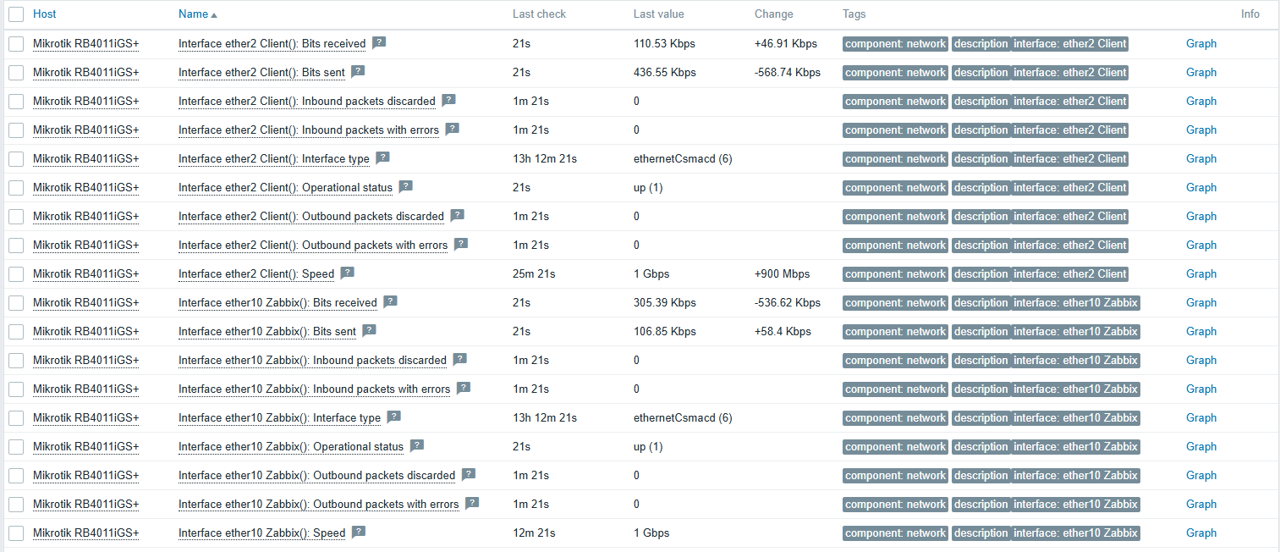
Connected interfaces:
Items
Zabbix can capture a new interface automatically at defined intervals. This makes it easy to monitor a new interface without the need to include it manually, thanks to the Network Interfaces Discovery functionality.
To analyze the status, we can go to Data Collection > Hosts, find our MikroTik device, and select Items.
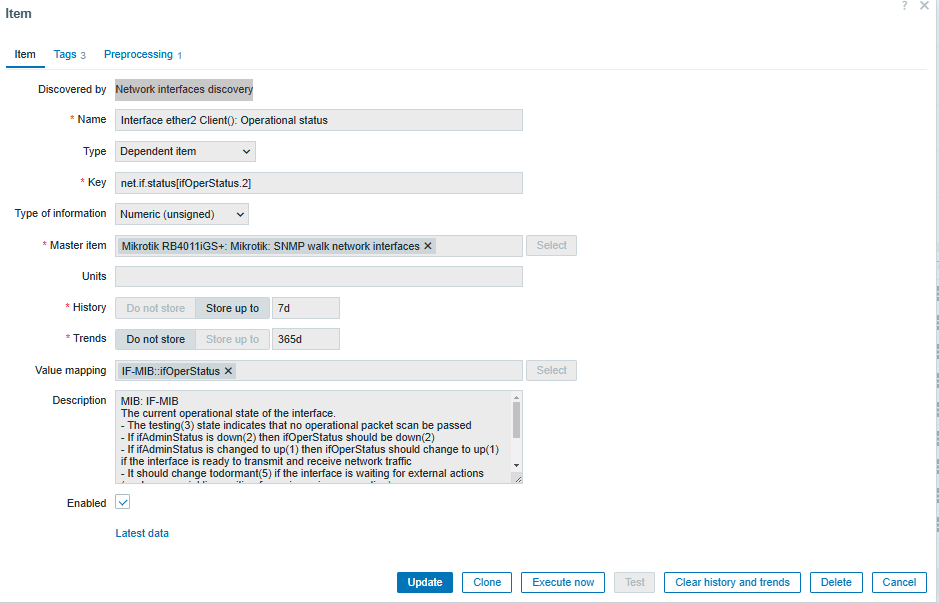
In this section, we can observe interface 2 of our client, which appears as a dependent item. This means that there is a master item that collects data through MIBs, which are network information databases. These items in the description section provide much more detailed and technical information about their functionality.
Configuration of specific items for interfaces
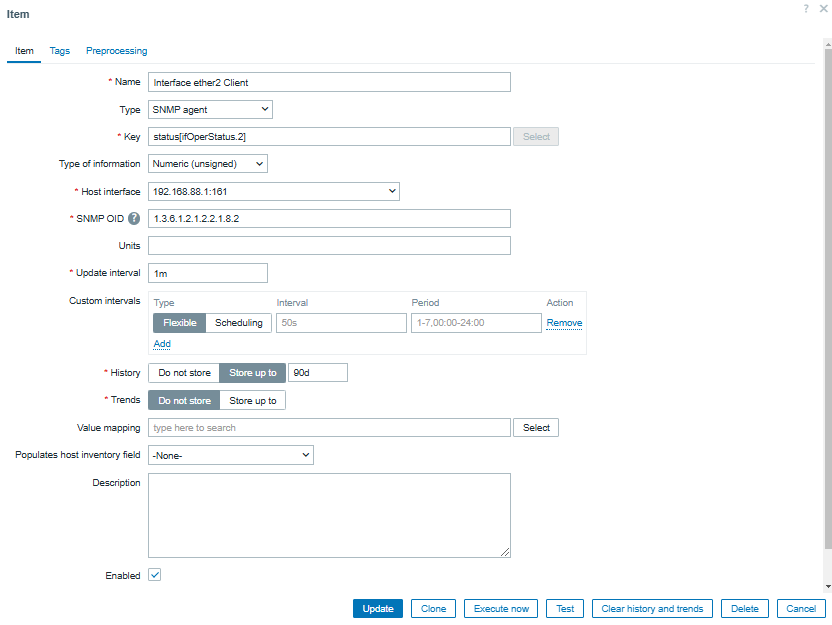
If we want to create a specific item, we must access Data Collection > Hosts > Create Item.
We must also assign a name that identifies SNMP Agent, specify the key that identifies the parameter to be monitored, analyze the corresponding MIB to capture the OID, and define the metrics capture interval according to our monitoring needs.
To validate the OID using snmpwalk, it returns the information of the MIB IF-MIB::ifOperStatus.2, which represents the interface status.

Configuration of custom triggers
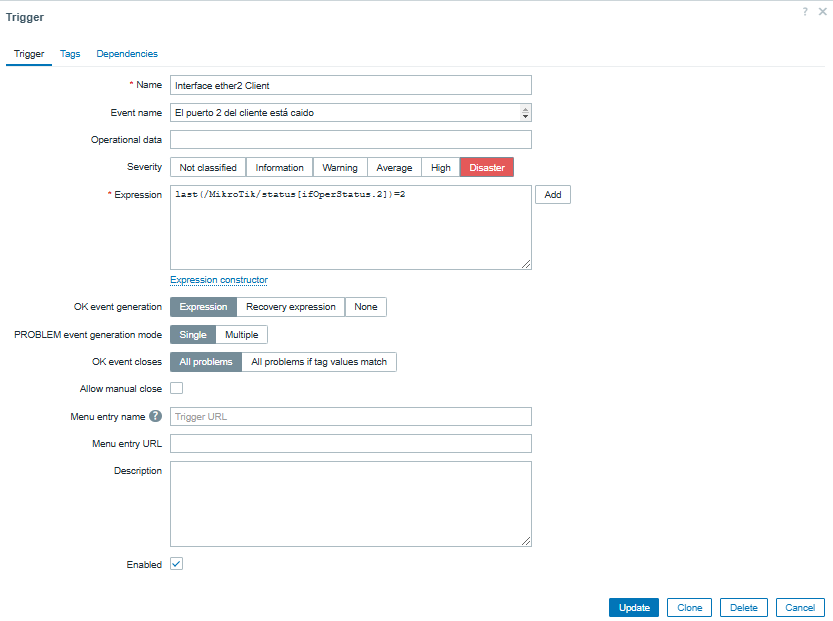
To configure a trigger to alert us about the status of the interface, we go to Data Collection > Hosts > Triggers > Create Trigger.
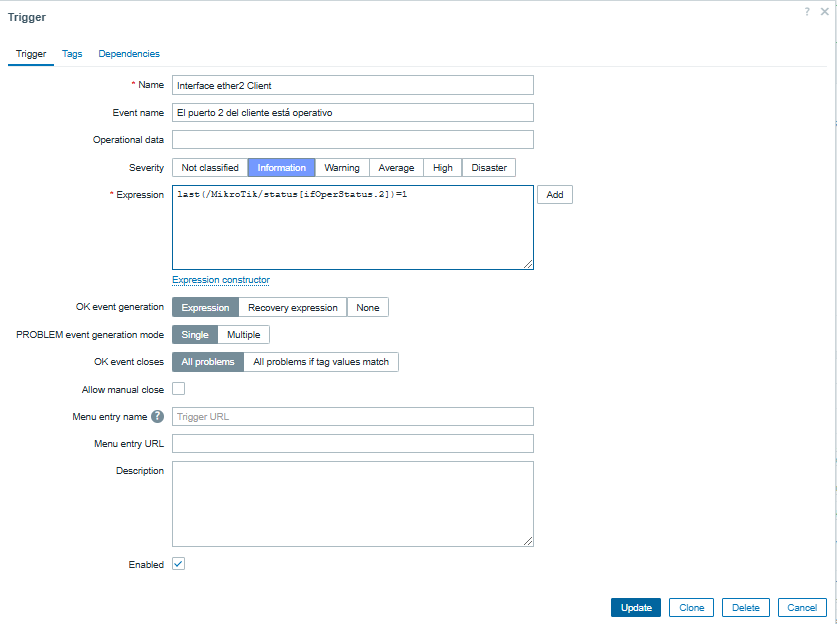
Then, we assign a descriptive name to the trigger (either manually or by using macros), define the event that will trigger the alert, set the appropriate severity, and create a logical expression that determines the status.
State 2 → The interface is down.
Status 1 → The interface is operational.
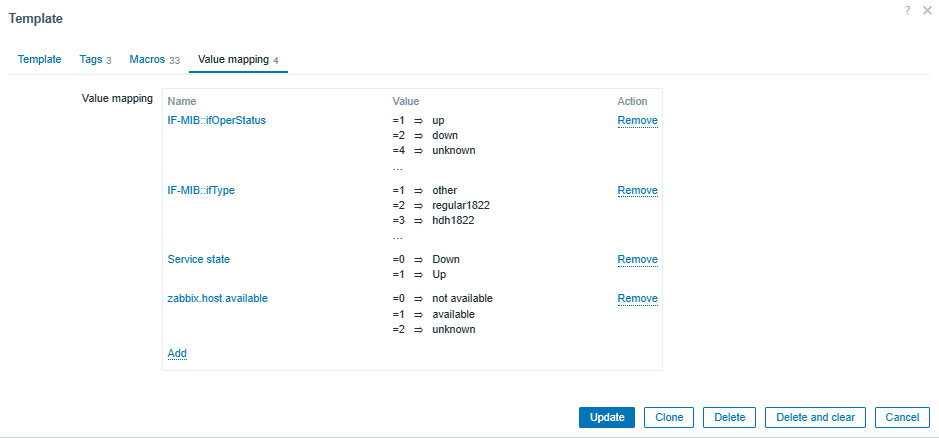
To correctly interpret SNMP values in Zabbix, we go to Data Collection > Templates > MikroTik RB4011iGS+RM by SNMP > Value Mapping.
From here, we can observe the values returned by SNMP and configure our triggers based on them.
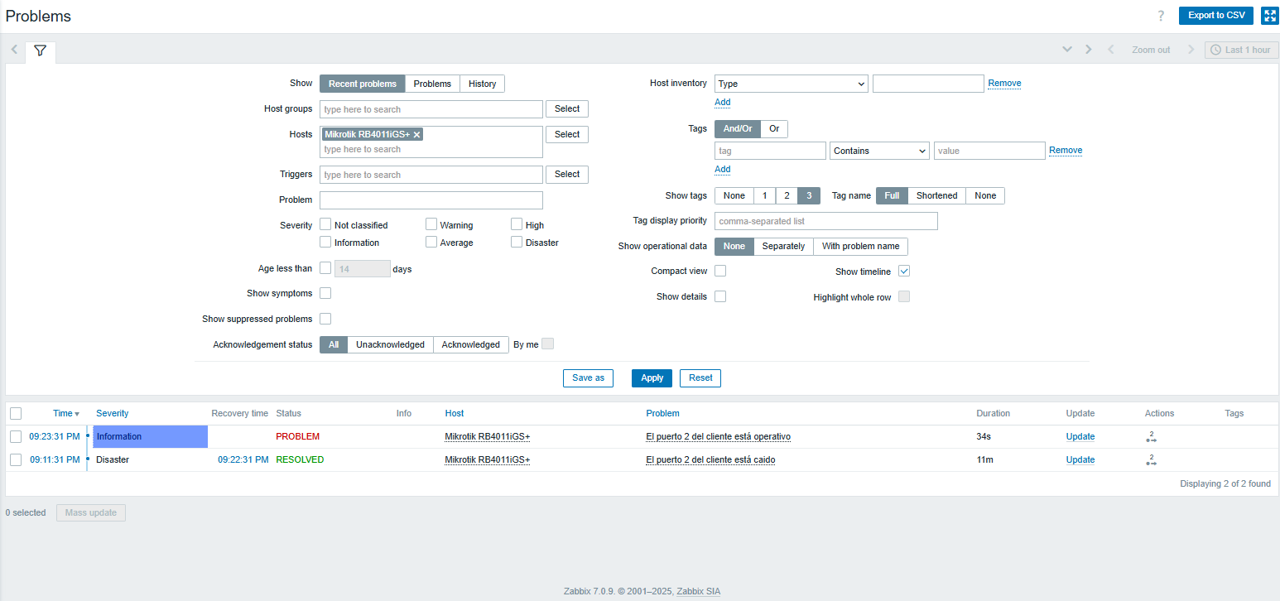
Finally, we can test our configuration in Monitoring > Problems, where we can see the triggers running.
Advantages of using SNMP with Zabbix
Using Zabbix as a monitoring tool not only facilitates network management, but also allows you to monitor third-party applications that use the SNMP protocol.
Its flexibility, together with the wide range of templates and configurations, make it the best choice for optimizing resources and ensuring stable performance in your infrastructure.