


Zabbix is a universal open-source enterprise-level monitoring solution, therefore Zabbix has all the enterprise-grade features included: SSO, distributed monitoring, Zabbix Insights, advanced security, no data storage limits, and much more. Zabbix 5.2 offers over 35 new features and functional improvements.
Contents
I.Introduction
II. New features and functional improvements
1. Synthetic monitoring
2. Keep secrets in the external vault
3. Zabbix insights
4. User roles
5. IoT Monitoring
6. Load balancing
7. User Timezones
8. Yaml for import/export
9. Template improvements
10. Discovery and cloud monitoring
11. Usability improvements
12. Preprocessing improvements
13. Other improvements
III. Questions & Answers
Introduction
Zabbix gives you freedom, as it offers:
- no per-metric fees,
- no license fees,
- deployment anywhere, and
- easy migration from on-premise to the cloud and vice versa.
Zabbix also offers business benefits for the companies that need centralized monitoring and collecting data all over their IT infrastructure and other sources.
- Umbrella monitoring, as Zabbix is flexible to replace most of the monitoring solutions already in use.
- Free and open-source solution with 24×7 vendor support worldwide.
- Technical Support at fixed prices for unlimited monitoring regardless of the number of devices monitored and extremely low TCO.
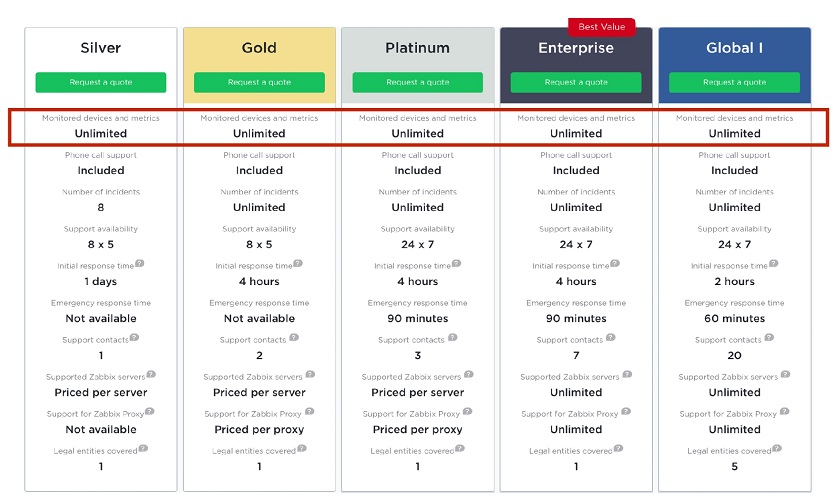 Business benefits
New features and functional improvements
Zabbix 5.2 offers over 35 new features and functional improvements.
Synthetic monitoring
1. Zabbix 5.2 supports complex multi-step scripted data collection, advanced availability checks, and complex interaction with different HTTP APIs.
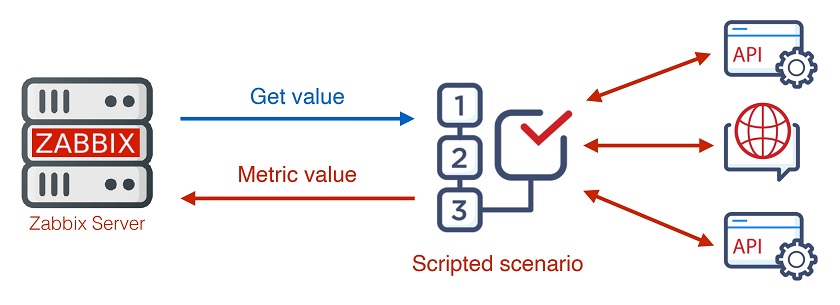
Multi-step data collection
- Multiple steps to get data.
Multi-step data collection is needed is, for instance, you need to authenticate and then to retrieve data from different APIs.

Authentification and retrieving data from different API.
- 2. Check if the whole service works: Zabbix API.

Advanced availability checks and APIs
- Calculate the sum of unknown parts.
For a list of customers retrieved from an API with URLs behind each customer, Zabbix allows for checking the availability of all URLs.

2. New item-type script
Now the process of data collection can be scripted. It’s no longer a one-step process, so we can take advantage of cycles, event statements, and all the power of JavaScript to retrieve the data.
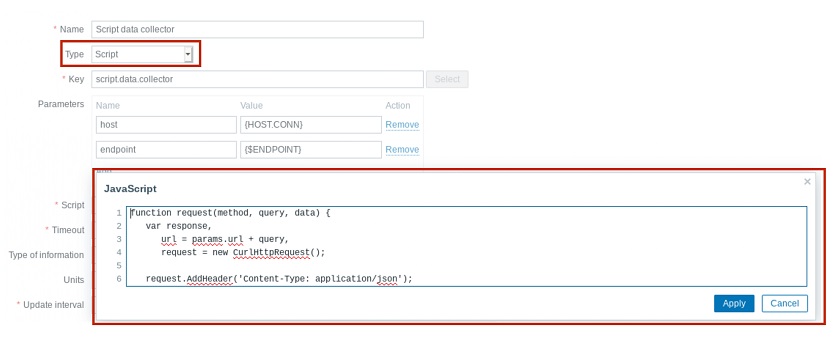
New item-type scripts
Keep secrets in the external vault
The ability to store secrets in the vault is valuable for using sensitive information, for instance, in financial, military, or government industries, as:
- all sensitive information is kept outside of Zabbix in a secure place: HashiCorp Vault,
- no secret data is stored in Zabbix DB, and
- all sensitive data, such as passwords, API tokens, user names, etc., shall be secured.
So, in Zabbix 5.2 a new user macro type is introduced — Vault secret. In Zabbix 5.0, the secret text was introduced, which is stored in the Zabbix DB, but is never exposed to end-users. With the Vault secret macro, the data is stored externally.

Vault secret macro
Now security measures in Zabbix comply with the best security standards possible:
- all communications with Zabbix Agent or Zabbix Proxy are encrypted using HTTPS, TLS, or PSK;
- Agent key restrictions can be used on the Zabbix Agent side;
- communication with the Zabbix Web Interface is encrypted using HTTPS; and
- integration with HashCorp Vault is now possible to keep secrets externally.

Security enhancements
NOTE. The one-day security training course is now held by Zabbix with no prerequisites and simple signup.

- Recommended for experienced Zabbix users.
- Does not require existing Zabbix certification.
- Will cover security options on an expert level.
- Secret macros and Vault.
- Securing connections using PSKor certificates.
- Restricting Agent keys.
- Granular user permissions
Zabbix insights
- Ability to analyze long term data efficiently using new trigger functions.
- Zabbix will provide you with information about anomalies.
- More value out of Zabbix trend data, which is kept longer.

This new feature allows Zabbix to generate alerts, for instance, “Average number of transactions increased by 24% in September”.
Zabbix 5.2 new functions
- The new functions allow for specifying, which trend data is needed, and then for comparing this data with the data for another period.
trendavg(period, period_shift)
trendcount(period, period_shift)
trenddelta(period, period_shift)
trendmax(period, period_shift)
trendmin(period, period_shift)
trendmin(period, period_shift)
- Trends tables instead of history. The time shift function is already available in Zabbix, but it has significant limitations, as it works only with history tables, that is, involves heavy processing, and doesn’t allow for specifying an absolute period of time.

- Use the Gregorian calendar for period and period_shift.
— h (hour), d (day), w (week), M (month), and y (year).
- Calculate upon the end of a period.
- Customized event name — a new field in the trigger definition, which is:
— optional, can use Trigger Name instead,
— displaying problem with a context,
— supports a new macro {? … } (“Expression macro”):
-
-
- fmtnum(digits)
-
— applicable to ITEM.VALUE, ITEM.LASTVALUE and expression macros;
— fmtnum(2) gives 14.85 instead of 14.8512345.
-
-
- fmttime(format, time_shift)
-
— applicable to {TIME};
— uses strftime format codes;
— {TIME}.fmttime(“%B,%Y”) gives October 2020.
For instance, to detect abnormal traffic, we can define the expression to compare traffic for different periods. If the difference exceeds the abnormality factor defined by the user macro, Zabbix will generate the event defined by the user.

Triggers
Then Zabbix will generate the following message:

Problems
Use cases
- Trend functions can be used to detect abnormal behavior of IT metrics and non-IT KPIs.
- Real-world applications:
— business performance,
— sales and marketing,
— warehousing,
— human resources,
— customer support.
User roles
Granular control of user permissions
- Customer portal, read-only users.
- Different parts of UI can be made accessible for different user roles.
- Control what user operations are accessible: maintenance, editing of dashboards, etc.
- Fine-grained control access to API and its methods for extra security.

In Zabbix 5.2, the ability to define user roles is introduced. It is possible to define as many user roles, as you need. Here, it’s necessary to specify:
- User type (User, Admin, Super Admin),
- Access to UI elements (what the user can do),
- Access to API (if enabled, we may filter by API methods),
- Access to actions (define, what user actions are available to different users).

User roles defined
IoT Monitoring
Zabbix is a universal solution used to support not only IT infrastructure, so the capacity to monitor factory equipment or sensors is really important. New Zabbix 5.2 now offers out-of-the-box support of Modbus and MQTT protocols — the most important IoT protocols. Now it is possible to monitor sensors and hardware equipment, and integration with built-in management systems, factory equipment, and IoT gateways is available without using external scripts.

Modbus
Modbus has become a de facto standard communication protocol — a commonly available means of connecting industrial electronic devices working on Agent and Agent 2 TCP or serial connections.

where:
modbus.get — new item key,
endpoint — endpoint defined as protocol://connection_string,
slave id — slave ID,
function — Modbus function,
address — address of first registry, coil or input,
count — number of records to read,
type — type of data,
endianness — endianness configuration offset – number of registers, starting from ‘address’, the results of which will be discarded.
modbus.get is made to get information out of Modbus and returns JSON:
modbus.get[“tcp://192.168.6.1:511”]
Modbus.get[“rtu://COM1:9600:8n”]
MQTT
- MQTT is a standard messaging protocol for the Internet of Things (IoT) among others.
- Native solution for monitoring messages published by MQTT brokers.
- Supported by Agent 2 Active Check only.

broker_url — MQTT broker URL (if empty, localhost with port 1883 is used),
topic — MQTT topic (mandatory). Wildcards (+,#) are supported,
username, password — authentication credentials (if required).
- MQTT subscribes to a specific topic or topics (with wildcards) of the provided broker and
waits for publications.
mqtt.get["tcp://host:1883","path/to/topic"]
mqtt.get["tcp://host:1883","path/to/topic"]
Load balancing
Starting from Zabbix 5.2, it has become easy to make horizontal scaling for Zabbix UI and API components. You just need to set up HAProxy or another load balancing solution, then some cluster nodes running as containers on physical or virtual machines or in the cloud, and you’ll get redundancy, high availability, and load balancing out of the box for Zabbix UI and API components.

Horizontal scaling for Zabbix UI and API
User Timezones
Zabbix 5.2 supports user timezones for each user. This is a feature appreciated by larger companies with users connecting to Zabbix UI from different countries or continents.
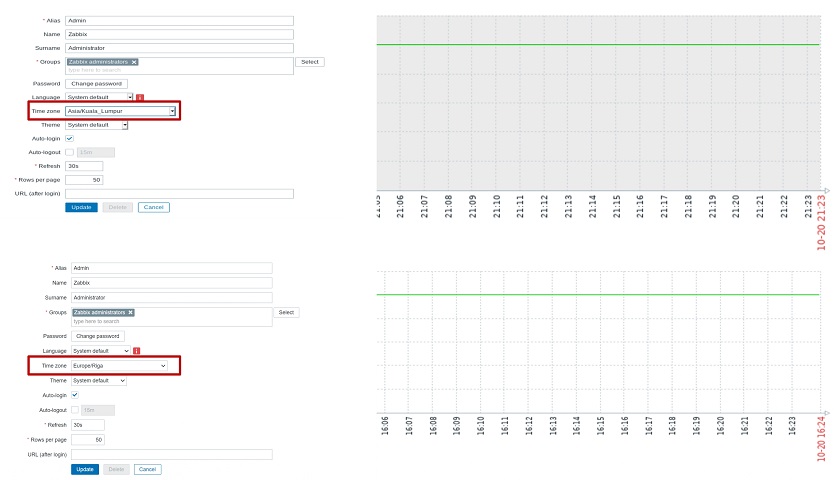
User timezones for each user
YAML for import/export
For import and export operations in Zabbix YAML is now used by default, though JSON and XML are still supported.
YAML is more user-friendly and easy to edit manually, while JSON and XML are excessive in the use of special characters. So if you keep your templates in a repository, you can modify them using a text editor. All official templates in Zabbix have been already converted to YAML.
 YAML for import/export
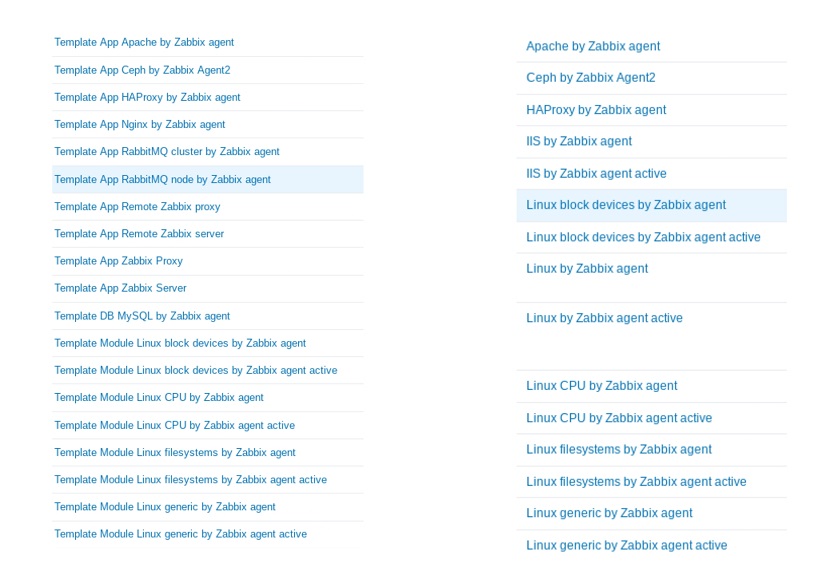
Template improvements
- Simpler template names, which are also easier to search for.
- Templated screens converted to template dashboards. When modifying dashboards now you are dealing with dashboard widgets, not screen elements anymore.

- See all hosts linked to a specific template.

- The number of templates in System information.
 Discovery and cloud monitoring
- Host interfaces can be discovered from LLD. Now it is possible to define ways to discover host interfaces when a host prototype is created. This feature is especially useful to discover cloud resources.
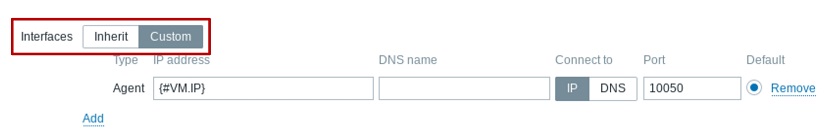
- Hosts without interfaces. We can create virtual hosts or hosts with no interface for service checks, for instance.
- Tags on host prototypes from any discovery macro. Tags play an increasingly important role in Zabbix, and now in addition to tags on the template level, on the host level, and on the trigger level, it is possible to define tags on the host prototype level as well.
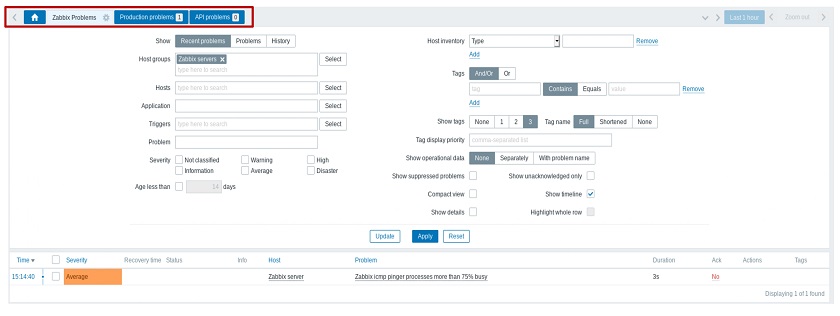
Usability improvements
- Save filters. This feature is implemented to monitor problems and hosts. In Zabbix 5.2, you can basically name filters. This functionality is similar to that used in modern browsers, such as Firefox or Safari. We have different tabs, and every tab displays a number of problems in real time, and you can easily switch from one filter to another.

Filter tabs
- Show clearly that any tab in Zabbix UI contains a non-empty list, for instance, the number of preprocessing rules. This functionality is implemented for all tabs in Zabbix UI.
Number of lists displayed in the tabs
- The default language can now be defined for the system.

Defining system default language
- Essential configuration parameters moved from defines.inc.php to Zabbix UI, which allows for finer tuning.

Finer tuning
- SNMP settings in the test item window, for instance, before adding an item to a template.

Testing SNMP parameters
- Filters and additional details in the list of dashboards.

Additional information in dashboards
Preprocessing improvements
- Macros in JavaScript preprocessing (also backported to 5.0).
- Check for not supported value and override items unsupported for any reason, which is useful for advanced availability checks: any problem -> service is down.
Other improvements
- In larger environments, there may be performance issues, and understanding what’s happening inside Zabbix is vitally important. Now it is possible to specify diagnostic information to be retrieved from Zabbix. We can also retrieve this information from the Zabbix API.

Retrieving diagnostic information from the value cache log file
- UI protected from checking the existence of a user.
- Simpler schedule for unsupported items.
- Ability to mass-update item Timeout.
- Ability to retrieve HTTP response headers in Webhooks.
- Ability to specify the default search path for user parameters.
- Max length of user macro values increased to 2048 characters.
- Active Agent can work as multiple hosts (Hostname=host1,host2,host3), which might be useful if you run different services on one host and need to split them.
- Official support of Docker images.
- Eventlog-related macros in operational data.
- Support of user macros in the item description.
Out of the box monitoring and alerting
We have increased the number of integrations supported in Zabbix out-of-the-box and the number of officially supported monitoring templates and plugins for Zabbix Agent 2.
- Ticketing.
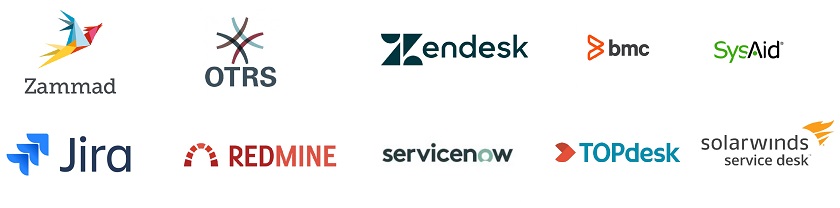
- Alerting.
- Monitoring.

Deployment
You can deploy Zabbix anywhere: on-premise or in the cloud.

Deploy on-premise

Deploy in the cloud
How to upgrade
Procedure for upgrading from Zabbix 5.0 is as for any other Zabbix release:
- Backup DB.
- Upgrade packages (Zabbix Server, Frontend)
- Restart zabbix_server.
- Watch the log file, Zabbix will start DB schema upgrade automatically.
- Upgrade all proxies.
- Update agents (optional).
Otherwise, contact Zabbix engineers, order an upgrade to the new release, and enjoy the new features effortlessly.
Questions & Answers
Question. Does Zabbix plan to support other scripting languages?
Answer. No, we don’t have such plans. We analyzed other languages but selected JavaScript as Zabbix embedded language. However, now you can use any scripting language in Zabbix in external scripts, including PowerShell, Python, etc.
Question. Does Zabbix plan to support other vaults besides HashCorp?
Answer. We might support other solutions. This new Zabbix functionality allows for implementing other vaults. If you need some other vault to be supported, you need to register the respective Zabbix feature request.
Question. Does Zabbix plan to improve the existing graphs and provide official Grafana integration?
Answer. We do plan to provide more advanced visualization options for dashboards. Now we are merging the screens and dashboard functionality, and we plan to release new widgets for more advanced visualization in Zabbix 5.4.
The existing Zabbix plugin for Grafana works smoothly, and we don’t plan to introduce another solution.
Question. Does Zabbix plan to support another database backend, for instance, time-series databases?
Answer. According to Zabbix Roadmap, in Zabbix 5.4 we plan to introduce generic API allowing to connect to any storage for time-series data, that is, to create some official connectors to storage solutions.
Question. Does Zabbix plan to natively support integration with LDAP? At the moment Zabbix provides LDAP support, but we still have to manually create users and so on. Does Zabbix plan to automate it in some way?
Answer. We created this functionality a couple of years ago, but we designed it in a complex way and decided not to implement it yet. It’s not on our shortlist, but we plan to implement it, as it is one of the top-voted features.
Question. Can Agent secrets be stored in the vault?
Answer. At this moment we don’t support this feature. In a highly-distributed environment, where agents are distributed all across your IT infrastructure, you’ll have to maintain a connection between Zabbix Agents and the vault. Still, if you feel the feature should be in Zabbix, feel free to register the respective Zabbix feature request.
Question. Does Zabbix have a Kubernetes operator?
Answer. We don’t have the Kubernetes operator officially supported yet, but there are a few operators available from our community.
Question. Do we plan to improve our report functionality?
Answer. Absolutely. This is the primary focus of Zabbix 5.4 and Zabbix 6.0. We are exploring two directions: improving the widgets to enrich visualization in Zabbix and supporting schedule report generation so that Zabbix would generate PDF reports and send them out on a regular basis.
Question. Do we plan to enable changing server configuration parameters without the need to restart the server?
Answer. That depends on the configuration parameters. It can be implemented for some configuration parameters. What is really needed is the ability to change parameters related to performance in real-time, the ability to change the number of pollers, trappers, escalators, etc. I think this functionality will be implemented soon.
Question. Can we create a Zabbix instance as a code via JSON, XML, or some other way?
Answer. We are moving in this direction. For instance, the transition to YAML format is a step in this way. So, you will be able to keep your templates in the git repository. The missing step is versioning for templates in order to manage templates, as well as the ability to export the whole Zabbix configuration to YAML format. Versioning is on the roadmap to Zabbix 5.4.
Question. Do we plan to support metric gathering from Spring Actuator and Spring Boot? As at the moment, Prometheus is to be used to gather metrics.
Answer. If Prometheus can be used to gather metrics from these systems, Zabbix can do it as well as Zabbix support data collection from Prometheus out-of-the-box.
Question. How can someone become a partner of Zabbix?
Answer. The best way to become a partner is to contact Zabbix by email at [email protected].
Question. How does Zabbix see interaction with Grafana? As that of competitors or friendly entities?
Answer. Grafana focuses on the visualization of data coming from different sources. Though Grafana provides some monitoring options, I see Grafana as an add-on to Zabbix. If you need a better visualization from Zabbix or Zabbix doesn’t deliver the visualization you expect, you are free to use Grafana.


It is very useful open source. You have written the article very well. Always keep giving new information in this way. I also use a lot of open source on my blog.
blog.