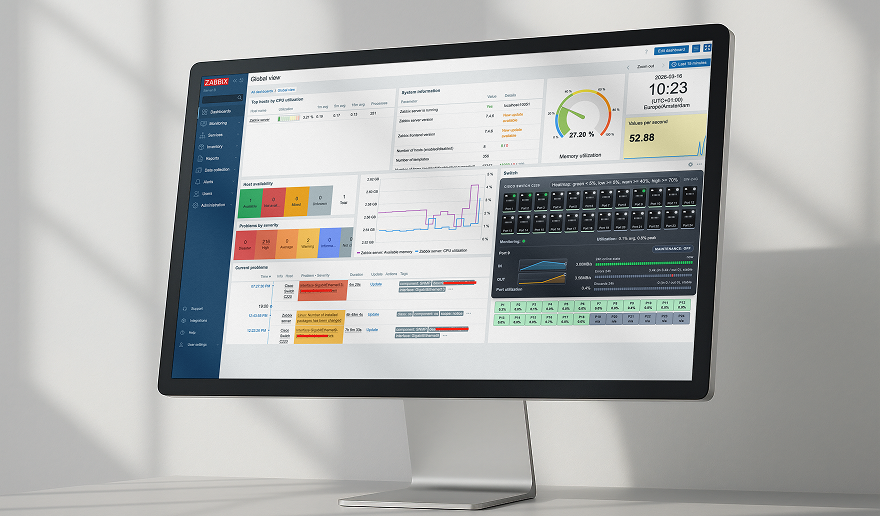
Zabbix 6.0 LTS comes packed with many new enterprise-level features and improvements. Join Artūrs Lontons and take a look at some of the major features that will be available with the release of Zabbix 6.0 LTS.
The full recording of the speech is available on the official Zabbix Youtube channel.
If we look at the Zabbix roadmap and Zabbix 6.0 LTS release in particular, we can see that one of the main focuses of Zabbix development is releasing features that solve many complex enterprise-grade problems and use cases. Zabbix 6.0 LTS aims to:
- Solve enterprise-level security and redundancy requirements
- Improve performance for large Zabbix instances
- Provide additional value to different types of Zabbix users – DevOPS and ITOps teams, Business process owner, Managers
- Continue to extend Zabbix monitoring and data collection capabilities
- Provide continued delivery of official integrations with 3rd party systems
Let’s take a look at the specific Zabbix 6.0 LTS features that can guide us towards achieving these goals.
Table of Contents
Zabbix server High Availability cluster
With the release of Zabbix 6.0 LTS, Zabbix administrators will now have the ability to deploy Zabbix server HA cluster out-of-the-box. No additional tools are required to achieve this.
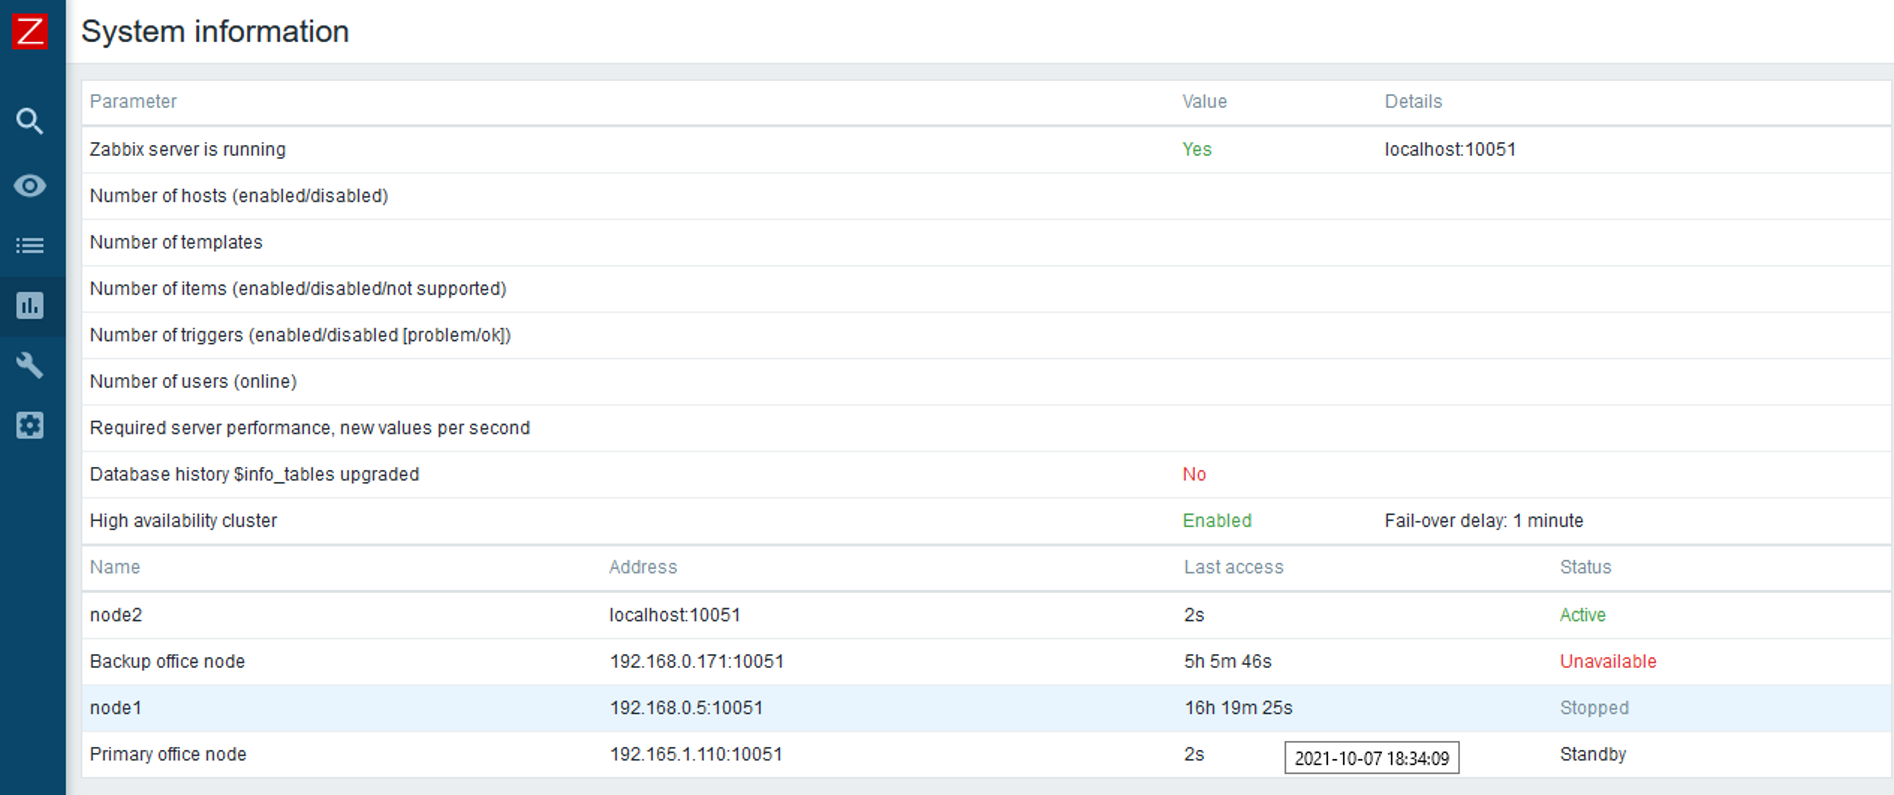
Zabbix server HA cluster supports an unlimited number of Zabbix server nodes. All nodes will use the same database backend – this is where the status of all nodes will be stored in the ha_node table. Nodes will report their status every 5 seconds by updating the corresponding record in the ha_node table.
To enable High availability, you will first have to define a new parameter in the Zabbix server configuration file: HANodeName
- Empty by default
- This parameter should contain an arbitrary name of the HA node
- Providing value to this parameter will enable Zabbix server cluster mode
Standby nodes monitor the last access time of the active node from the ha_node table.
- If the difference between last access time and current time reaches the failover delay, the cluster fails over to the standby node
- Failover operation is logged in the Zabbix server log
It is possible to define a custom failover delay – a time window after which an unreachable active node is considered lost and failover to one of the standby nodes takes place.
As for the Zabbix proxies, the Server parameter in the Zabbix proxy configuration file now supports multiple addresses separated by a semicolon. The proxy will attempt to connect to each of the nodes until it succeeds.
Other HA cluster related features:
- New command-line options to check HA cluster status
- hanode.get API method to obtain the list of HA nodes
- The new internal check provides LLD information to discover Zabbix server HA nodes
- HA Failover event logged in the Zabbix Audit log
- Zabbix Frontend will automatically switch to the active Zabbix server node
You can find a more detailed look at the Zabbix Server HA cluster feature in the Zabbix Summit Online 2021 speech dedicated to the topic.
Business service monitoring
The Services section has received a complete redesign in Zabbix 6.0 LTS. Business Service Monitoring (BSM) enables Zabbix administrators to define services of varying complexity and monitor their status.
BSM provides added value in a multitude of use cases, where we wish to define and monitor services based on:
- Server clusters
- Services that utilize load balancing
- Services that consist of a complex IT stack
- Systems with redundant components in place
- And more
Business Service monitoring has been designed with scalability in mind. Zabbix is capable of monitoring over 100k services on a single Zabbix instance.
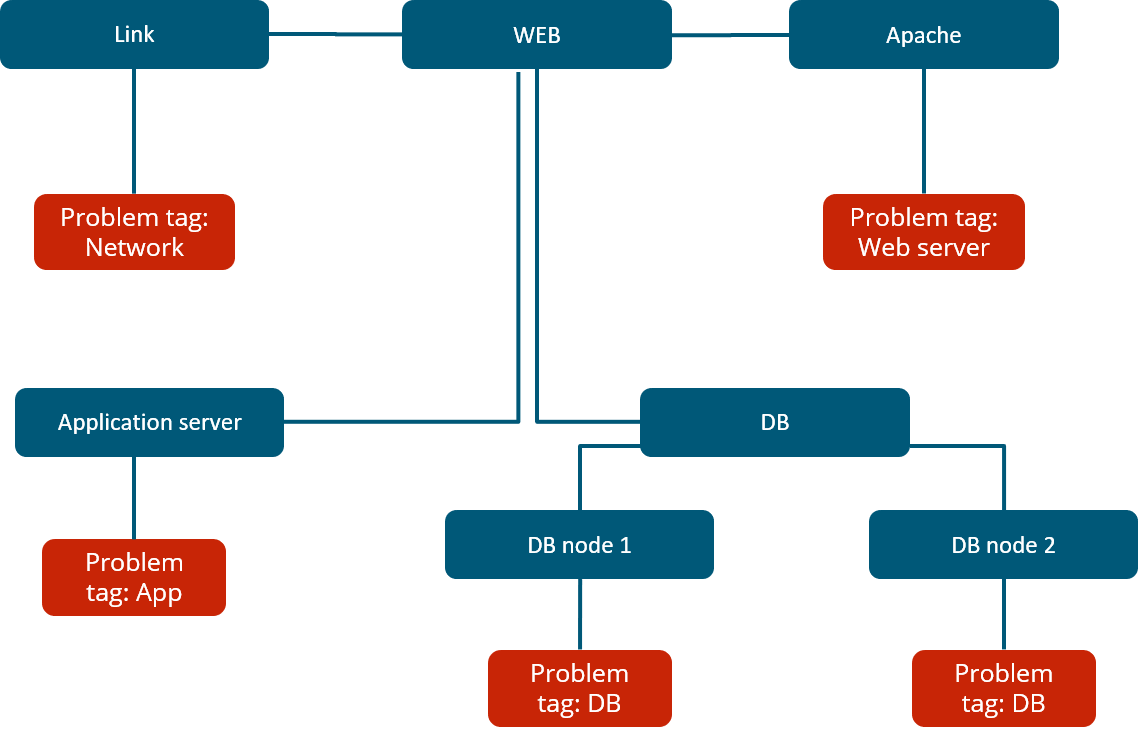
For our Business Service example, we used a website, which depends on multiple components such as the network connection, DB backend, Application server, and more. We can see that the service status calculation is done by utilizing tags and deciding if the existing problems will affect the service based on the problem tags.
In Zabbix 6.0 LTS there are many ways how service status calculations can be performed. In case of a problem, the service state can be changed to:
- The most critical problem severity, based on the child service problem severities
- The most critical problem severity, based on the child service problem severities, only if all child services are in a problem state
- The service is set to constantly be in an OK state
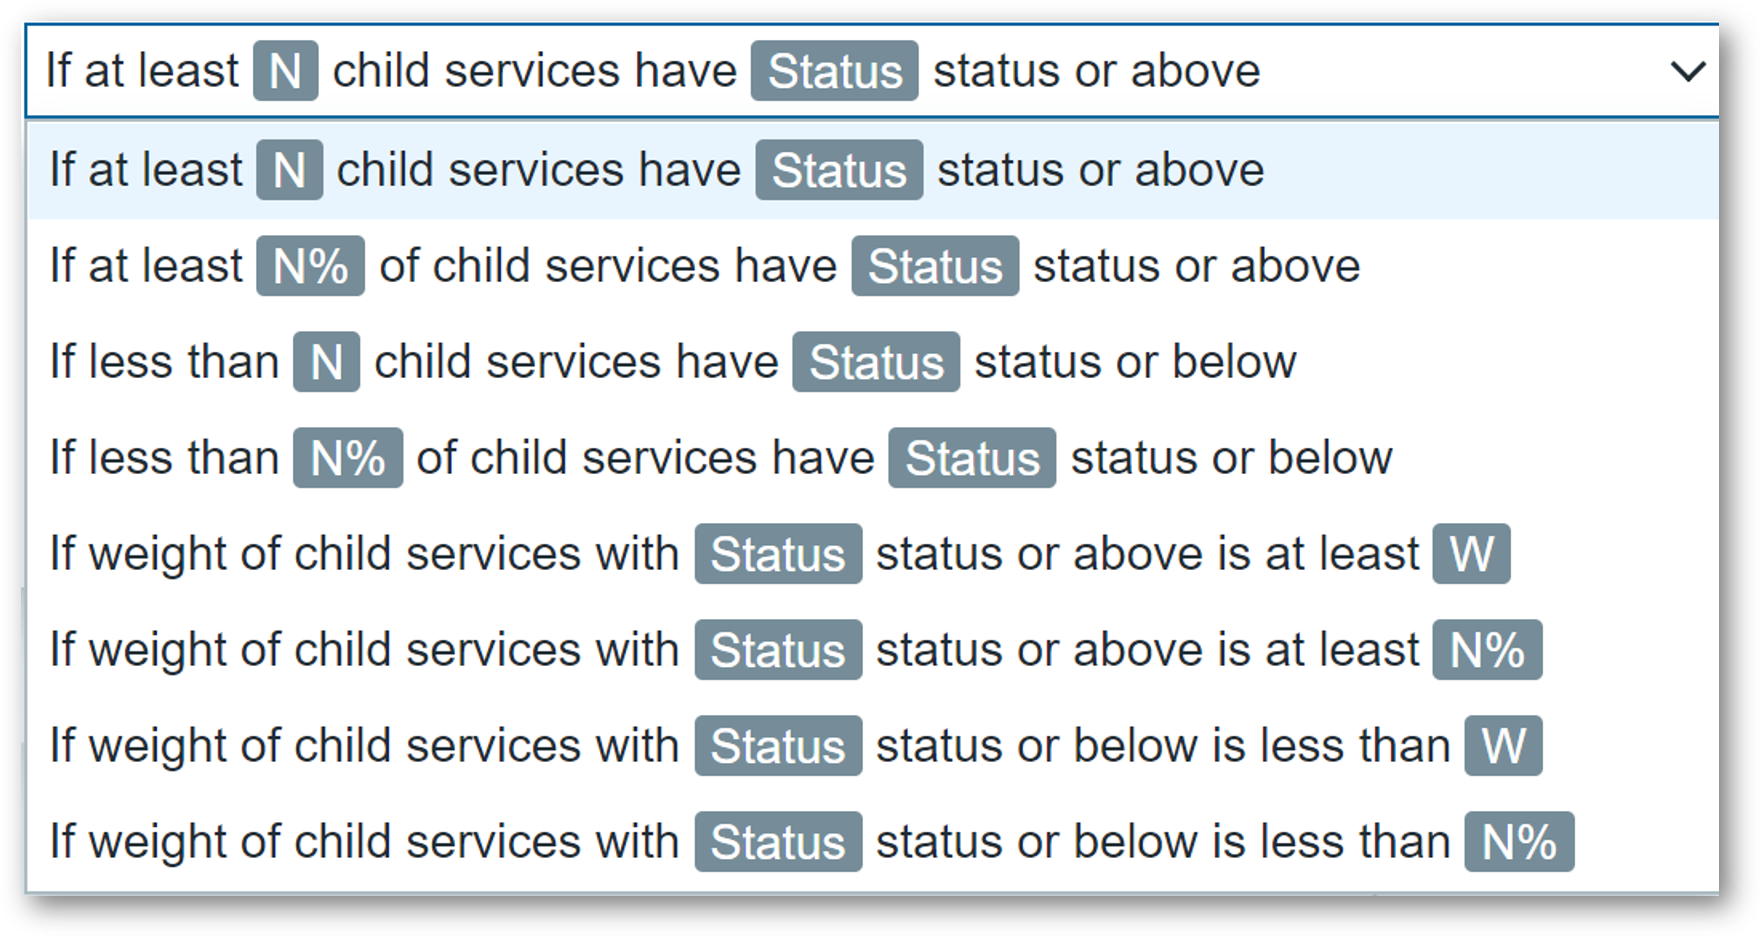
Changing the service status to a specific problem severity if:
- At least N or N% of child services have a specific status
- Define service weights and calculate the service status based on the service weights
There are many other additional features, all of which are covered in our Zabbix Summit Online 2021 speech dedicated to Business Service monitoring:
- Ability to define permissions on specific services
- SLA monitoring
- Business Service root cause analysis
- Receive alerts and react on Business Service status change
- Define Business Service permissions for multi-tenant environments
New Audit log schema
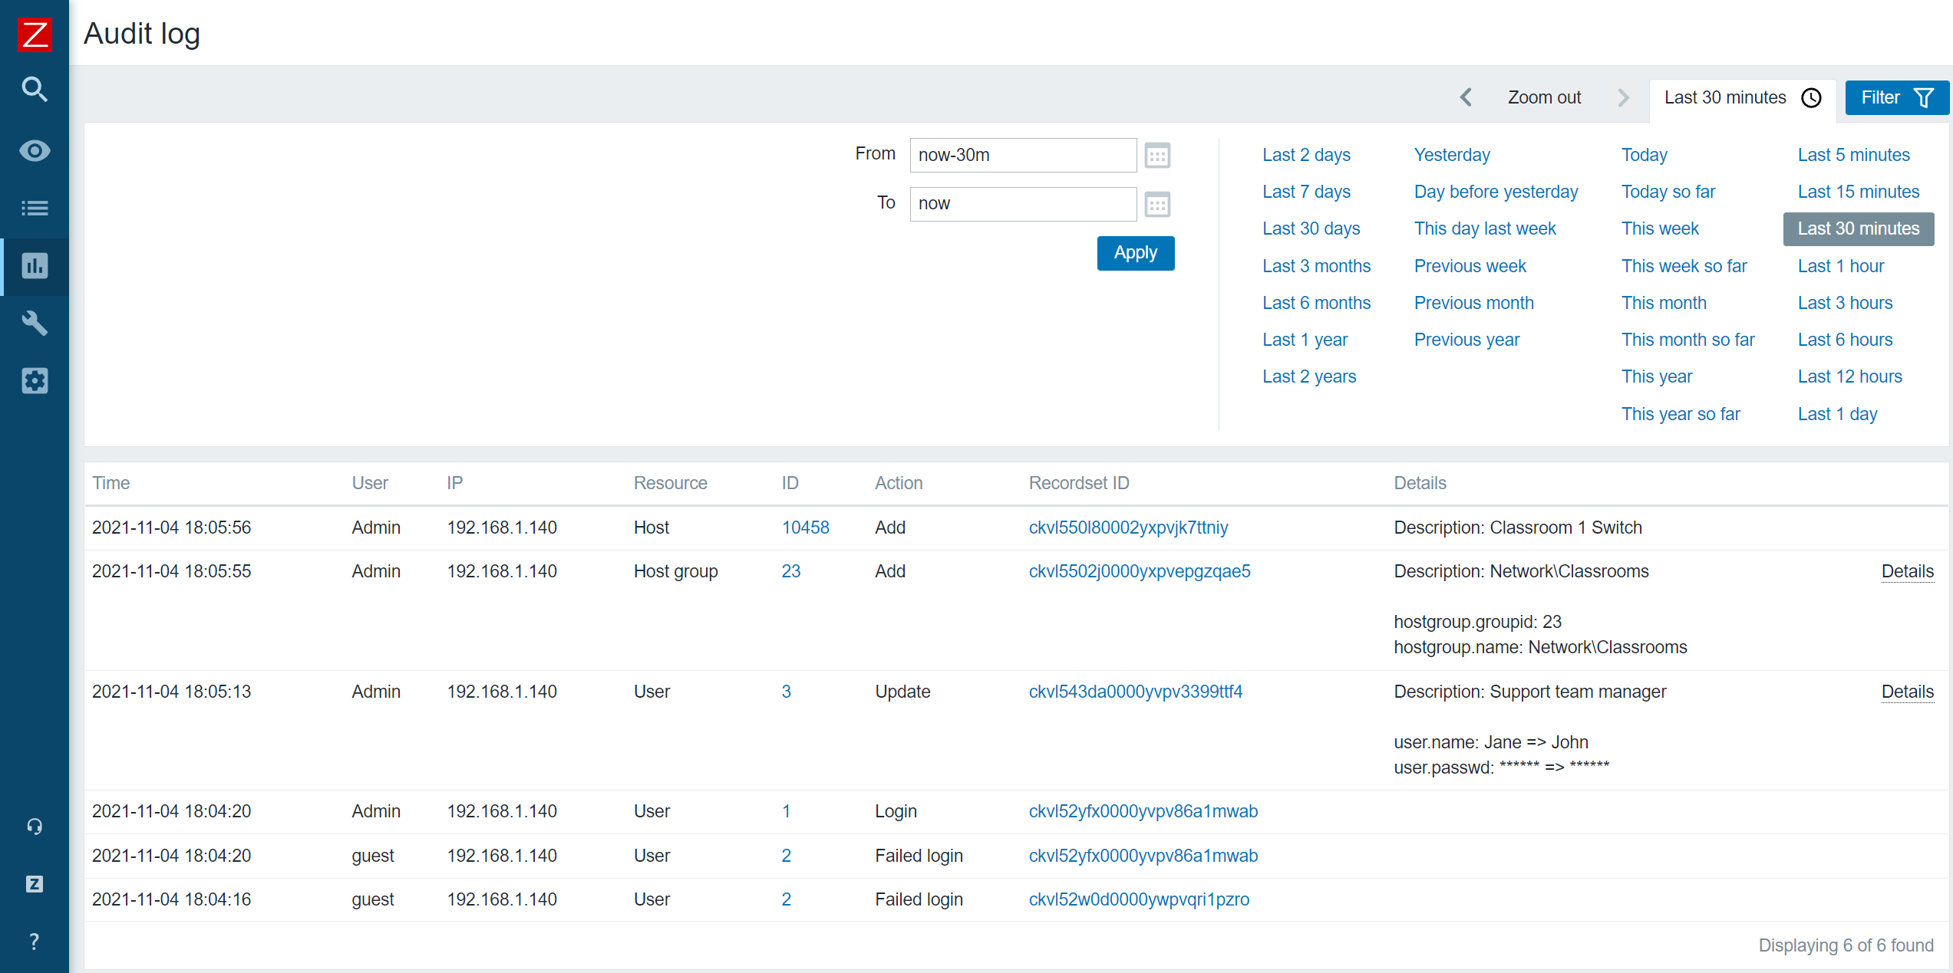
The existing audit log has been redesigned from scratch and now supports detailed logging for both Zabbix server and Zabbix frontend operations:
- Zabbix 6.0 LTS introduces a new database structure for the Audit log
- Collision resistant IDs (CUID) will be used for ID generation to prevent audit log row locks
- Audit log records will be added in bulk SQL requests
- Introducing Recordset ID column. This will help users recognize which changes have been made in a particular operation
The goal of the Zabbix 6.0 LTS audit log redesign is to provide reliable and detailed audit logging while minimizing the potential performance impact on large Zabbix instances:
- Detailed logging of both Zabbix frontend and Zabbix server records
- Designed with minimal performance impact in mind
- Accessible via Zabbix API
Implementing the new audit log schema is an ongoing effort – further improvements will be done throughout the Zabbix update life cycle.
Machine learning
New trend functions have been added which utilize machine learning to perform anomaly detection and baseline monitoring:
- New trend function – trendstl, allows you to detect anomalous metric behavior
- New trend function – baselinewma, returns baseline by averaging data periods in seasons
- New trend function – baselinedev, returns the number of standard deviations
An in-depth look into Machine learning in Zabbix 6.0 LTS is covered in our Zabbix Summit Online 2021 speech dedicated to machine learning, anomaly detection, and baseline monitoring.
New ways to visualize your data
Collecting and processing metrics is just a part of the monitoring equation. Visualization and the ability to display our infrastructure status in a single pane of glass are also vital to large environments. Zabbix 6.0 LTS adds multiple new visualization options while also improving the existing features.
- The data table widget allows you to create a summary view for the related metric status on your hosts
- The Top N and Bottom N functions of the data table widget allow you to have an overview of your highest or lowest item values
- The single item widget allows you to display values for a single metric
- Improvements to the existing vector graphs such as the ability to reference individual items and more
- The SLA report widget displays the current SLA for services filtered by service tags
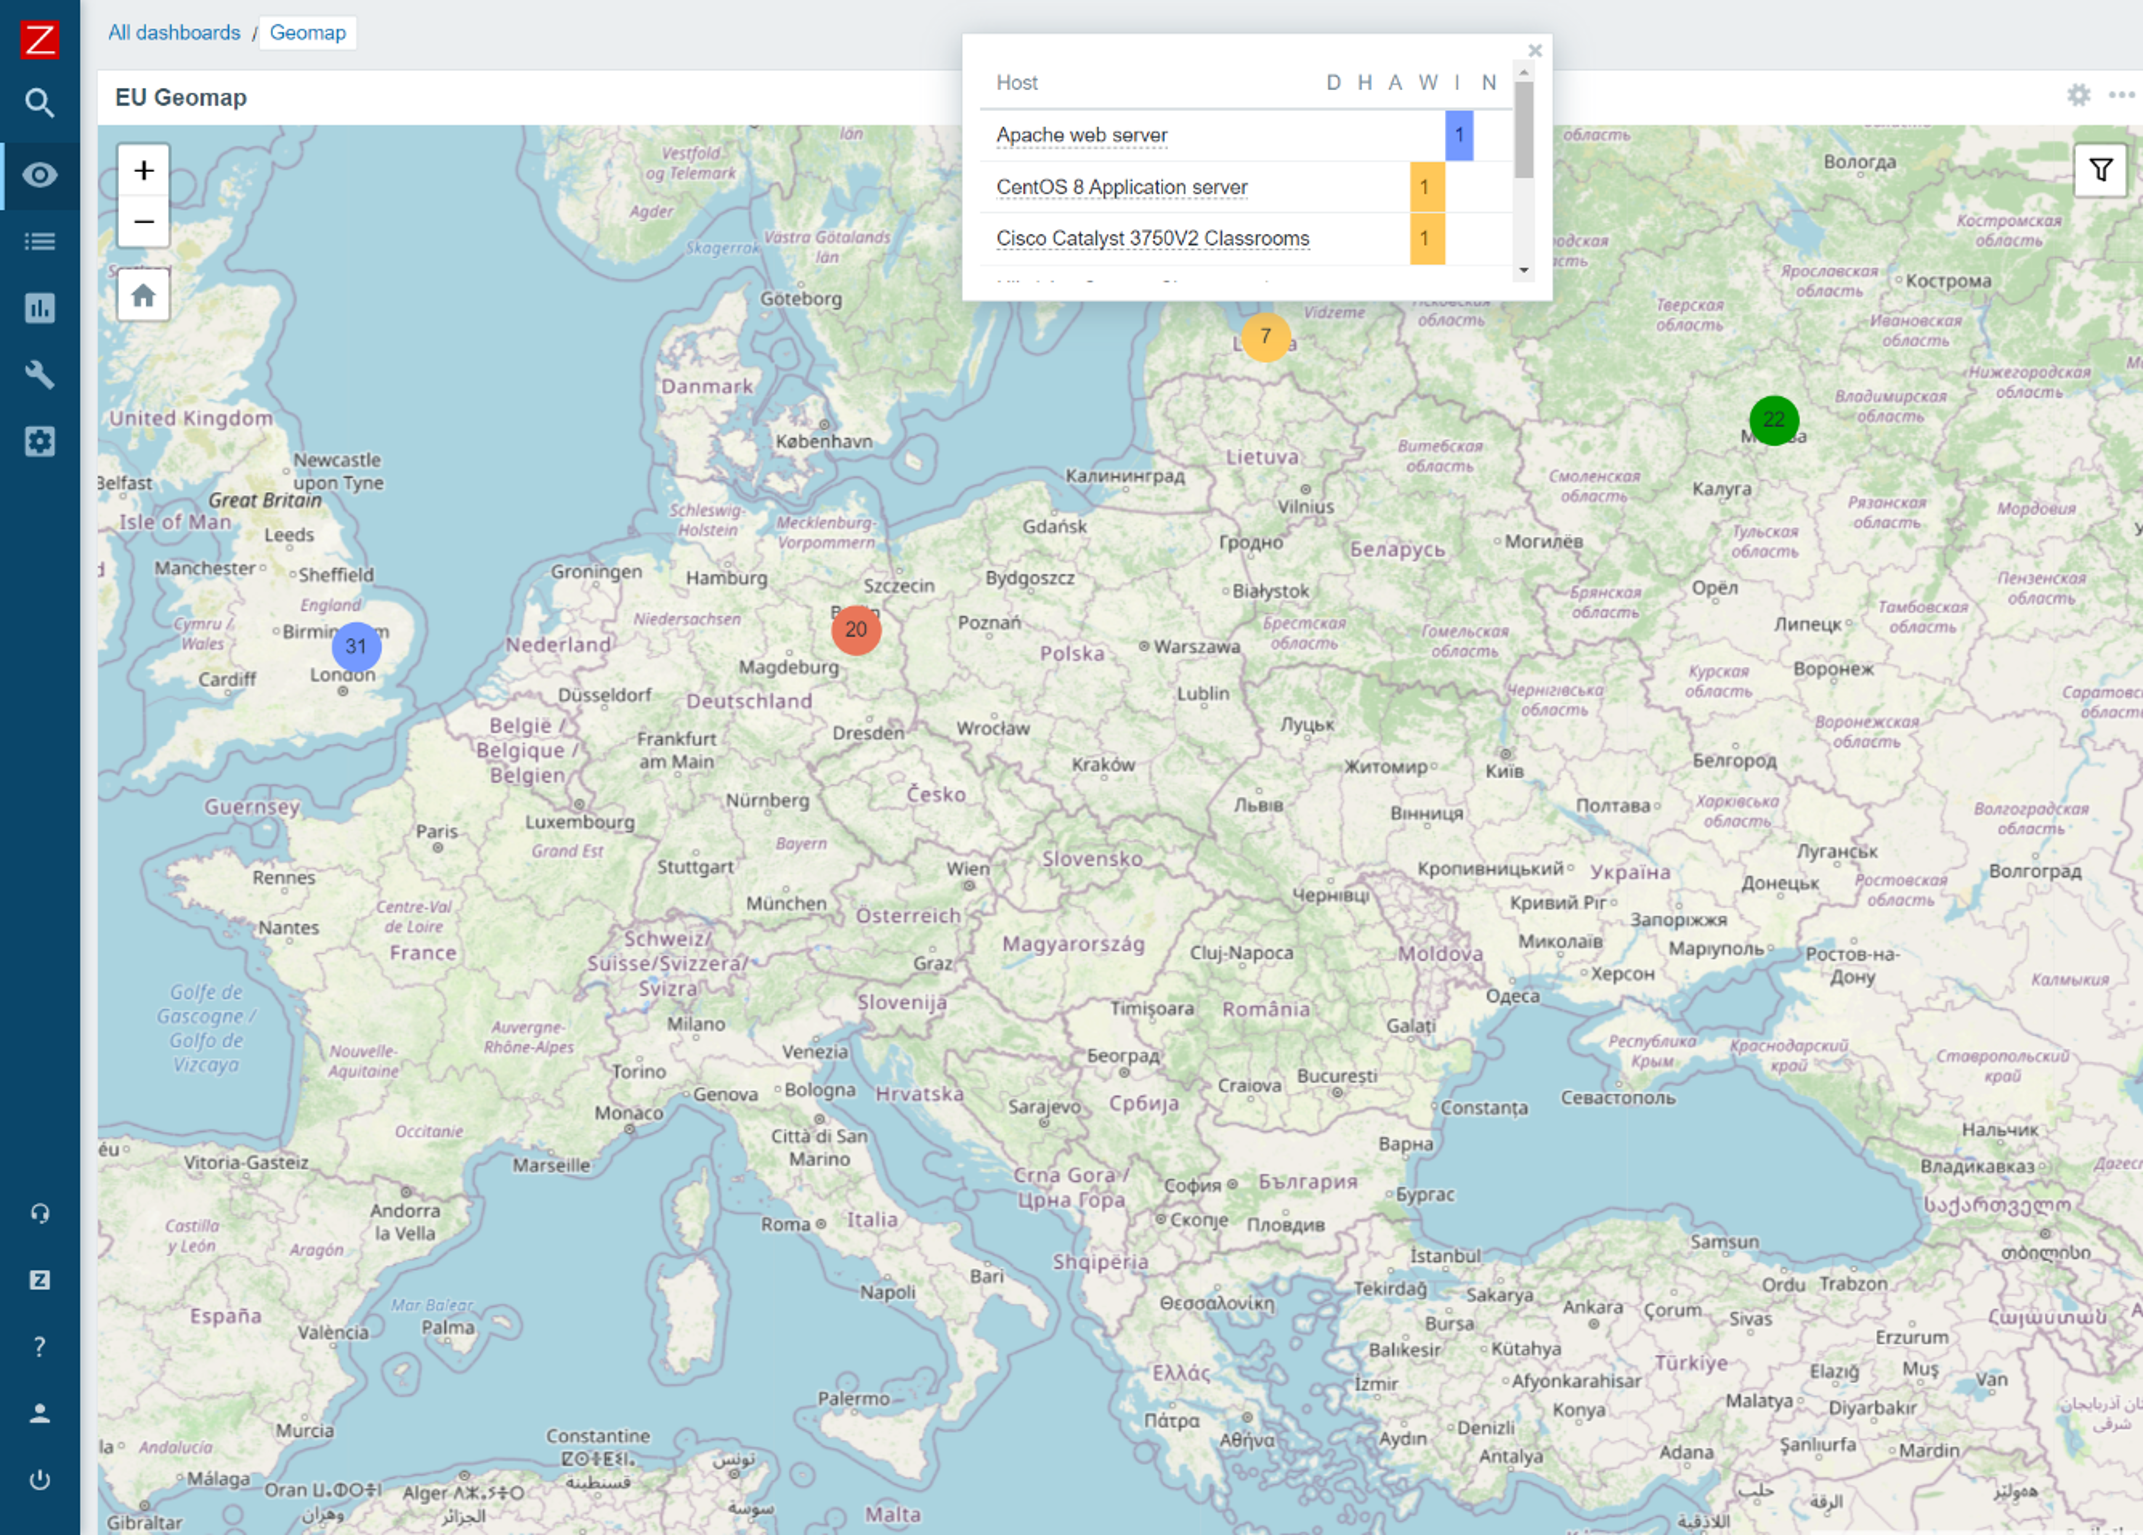
We are proud to announce that Zabbix 6.0 LTS will provide a native Geomap widget. Now you can take a look at the current status of your IT infrastructure on a geographic map:
- The host coordinates are provided in the host inventory fields
- Users will be able to filter the map by host groups and tags
- Depending on the map zoom level – the hosts will be grouped into a single object
- Support of multiple Geomap providers, such as OpenStreetMap, OpenTopoMap, Stamen Terrain, USGS US Topo, and others
Zabbix agent – improvements and new items
Zabbix agent and Zabbix agent 2 have also received some improvements. From new items to improved usability – both Zabbix agents are now more flexible than ever. The improvements include such features as:
- New items to obtain additional file information such as file owner and file permissions
- New item which can collect agent host metadata as a metric
- New item with which you can count matching TCP/UDP sockets
- It is now possible to natively monitor your SSL/TLS certificates with a new Zabbix agent2 item. The item can be used to validate a TLS/SSL certificate and provide you additional certificate details
- User parameters can now be reloaded without having to restart the Zabbix agent
In addition, a major improvement to introducing new Zabbix agent 2 plugins has been made. Zabbix agent 2 now supports loading stand-alone plugins without having to recompile the Zabbix agent 2.
Custom Zabbix password complexity requirements
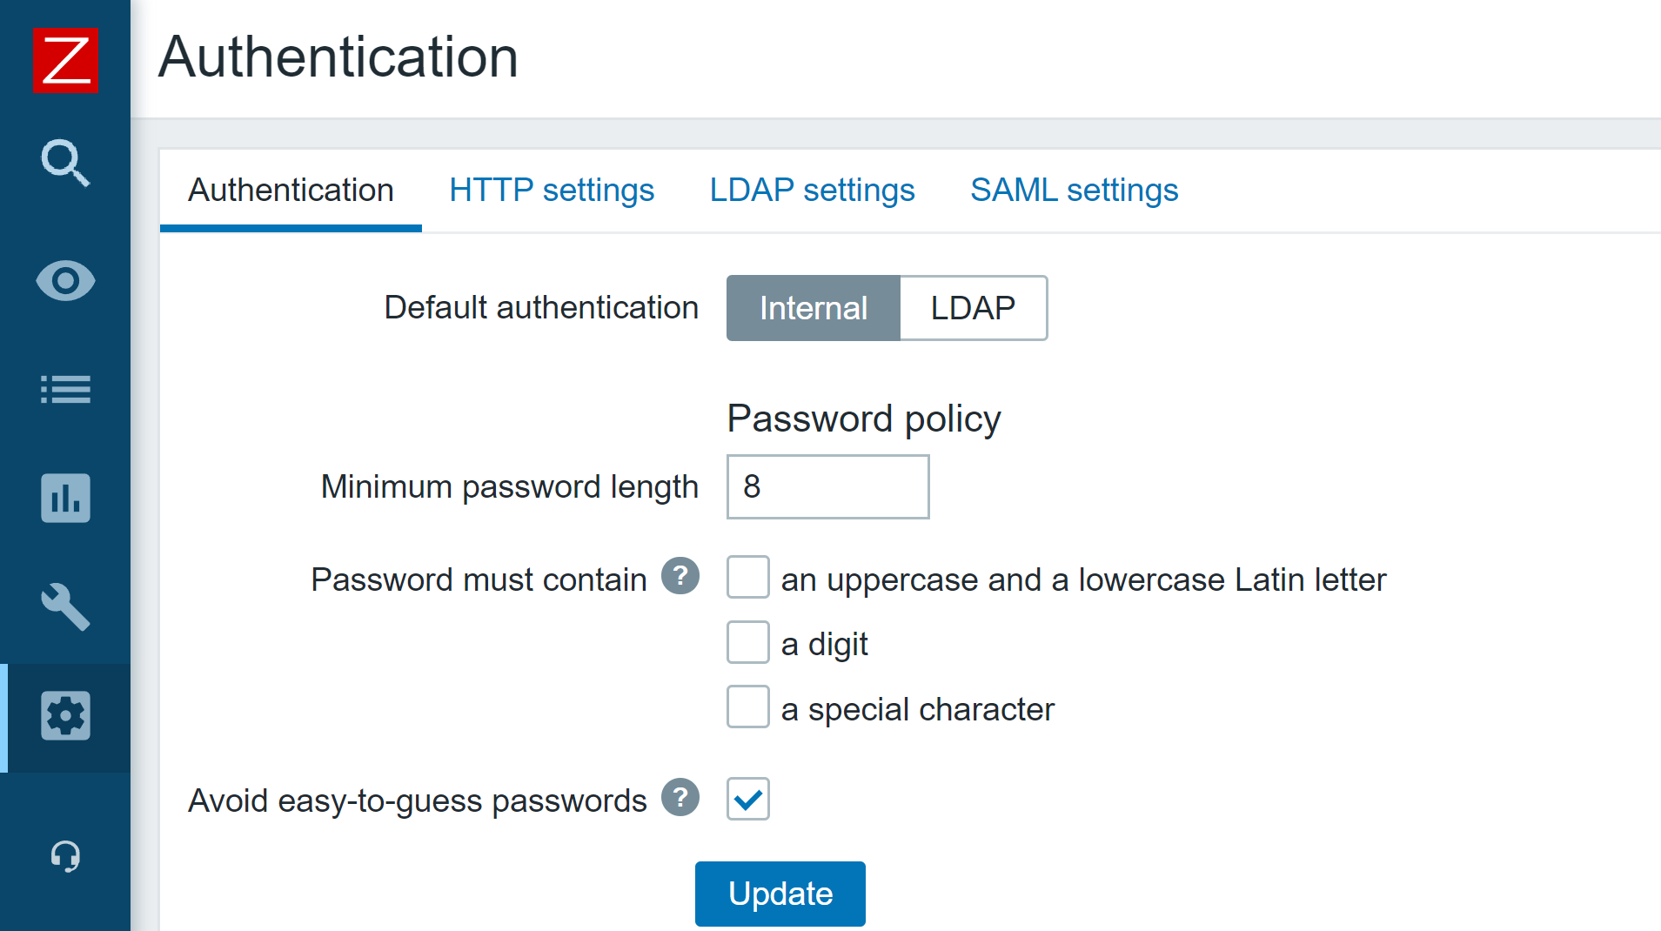
One of the main improvements to Zabbix security is the ability to define flexible password complexity requirements. Zabbix Super admins can now define the following password complexity requirements:
- Set the minimum password length
- Define password character requirements
- Mitigate the risk of a dictionary attack by prohibiting the usage of the most common password strings
UI/UX improvements
Improving and simplifying the existing workflows is always a priority for every major Zabbix release. In Zabbix 6.0 LTS we’ve added many seemingly simple improvements, that have major impacts related to the “feel” of the product and can make your day-to-day workflows even smoother:
- It is now possible to create hosts directly from Monitoring – Hosts
- Removed Monitoring – Overview section. For improved user experience, the trigger and data overview functionality can now be accessed only via dashboard widgets.
- The default type of information for items will now be selected automatically depending on the item key.
- The simple macros in map labels and graph names have been replaced with expression macros to ensure consistency with the new trigger expression syntax
New templates and integrations
Adding new official templates and integrations is an ongoing process and Zabbix 6.0 LTS is no exception here’s a preview for some of the new templates and integrations that you can expect in Zabbix 6.0 LTS:
- f5 BIG-IP
- Cisco ASAv
- HPE ProLiant servers
- Cloudflare
- InfluxDB
- Travis CI
- Dell PowerEdge
Zabbix 6.0 also brings a new GitHub webhook integration which allows you to generate GitHub issues based on Zabbix events!
Other changes and improvements
But that’s not all! There are more features and improvements that await you in Zabbix 6.0 LTS. From overall performance improvements on specific Zabbix components, to brand new history functions and command-line tool parameters:
- Detect continuous increase or decrease of values with new monotonic history functions
- Added utf8mb4 as a supported MySQL character set and collation
- Added the support of additional HTTP methods for webhooks
- Timeout settings for Zabbix command-line tools
- Performance improvements for Zabbix Server, Frontend, and Proxy
Questions and answers
Q: How can you configure geographical maps? Are they similar to regular maps?
A: Geomaps can be used as a Dashboard widget. First, you have to select a Geomap provider in the Administration – General – Geographical maps section. You can either use the pre-defined Geomap providers or define a custom one. Then, you need to make sure that the Location latitude and Location longitude fields are configured in the Inventory section of the hosts which you wish to display on your map. Once that is done, simply deploy a new Geomap widget, filter the required hosts and you’re all set. Geomaps are currently available in the latest alpha release, so you can get some hands-on experience right now.
Q: Any specific performance improvements that we can discuss at this point for Zabbix 6.0 LTS?
A: There have been quite a few. From the frontend side – we have improved the underlying queries that are related to linking new templates, therefore the template linkage performance has increased. This will be very noticeable in large instances, especially when linking or unlinking many templates in a single go.
There have also been improvements to Server – Proxy communication. Specifically – the logic of how proxy frees up uncompressed data. We’ve also introduced improvements on the DB backend side of things – from general improvements to existing queries/logic, to the introduction of primary keys for history tables, which we are still extensively testing at this point.
Q: Will you still be able to change the type of information manually, in case you have some advanced preprocessing rules?
A: In Zabbix 6.0 LTS Zabbix will try and automatically pick the corresponding type of information for your item. This is a great UX improvement since you don’t have to refer to the documentation every time you are defining a new item. And, yes, you will still be able to change the type of information manually – either because of preprocessing rules or if you’re simply doing some troubleshooting.


 Prev Post


