


Can you take screenshots of the websites you monitor with Zabbix? Of course, you can! By day, I earn my living by being a monitoring tech lead in a global cyber security company. By night, I monitor my home. Welcome to my weekly blog about how I monitor my home with Zabbix & Grafana and do some weird experiments with them.
Proper full-stack monitoring does cover everything from the device’s physical status to what the end-user sees. However, often even with website monitoring, web admins only rely on all kinds of run-time data; operating system load, hardware health, service response times, and logs. If your site has some rarely occurring technical issue, you might not have any idea what the site looks like when the error happens. Is your site looking really wrong or is maybe just a panel or two misbehaving during some issue?
Zabbix & Selenium to the rescue!
Table of Contents
Get your Selenium
No, even if this post is meant to provide some food for thought, I am not speaking about the selenium your metabolism needs. Instead, I am speaking about a web-test framework that allows you to automate web browsers by using Java, Python, or several other languages it supports. It’s probably most useful for web browser & website developers so they can be sure that their sites look OK on all major browsers and so forth, but why not utilize that with your monitoring, too?

With a really short Python script (or whatever language) you can spawn a headless instance of whatever browser you want and ask it to do stuff for you. In the horribly simple example above, the script can be called like
selenium_screenshot.py blog.zabbix.com
and it then saves the screenshot under /usr/share/zabbix/assets/webtest-screenshots/ directory which is accessible by my home Zabbix & Grafana.
Now, where did I put that script?
What I actually use this for at home is that whenever some lunch restaurants publish their new menus, my Zabbix grabs a screenshot of the lunch menus and I can then spy the menus without a need to go to sites by myself.
As I do not want to show the more exact locations of the places I visit, in this example I’ll show you how to screenshot the blog.zabbix.com site instead.
Hooking the script to Zabbix is easy; just add the script to Zabbix via its Administration –> Scripts, and add it as a script you can call via Actions, and if you so want, also put it as a manual action so you can call the script manually any time you want through Zabbix contextual menus.

Then just add a trigger that snaps a screenshot whenever your web test is failing.
Say cheese!
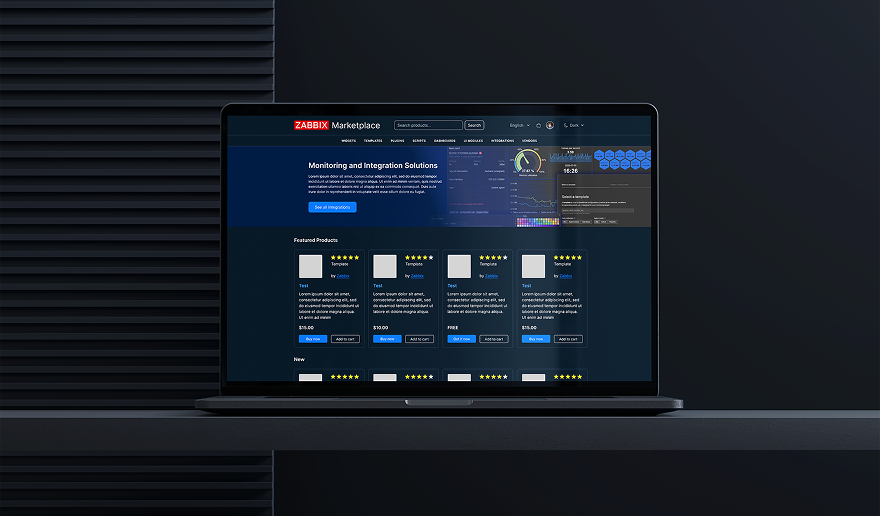
Now that we have our screenshot mechanism in place, this is how it looks through Zabbix URL widget:

… and this is how it looks when embedded to Grafana with its Text panel, HTML content type and a simple <img> tag:

What’s this useful for?
Lots of stuff. From now on, you too can easily embed a screenshot of your monitored website within your monitoring environment. Put some more panels to that dashboard showing the active alerts, graphs, run-time data, and logs, and you can have a very comprehensive full stack monitoring in place.
Or make your screenshot script more intelligent (I recommend that anyway), and make it save the files with date stamp info in filenames, so you can have a nice little time machine inside Grafana and its time picker.
Selenium can also give you many more other details, such as performance data or the URLs which were called during the page load. I’m sure that’s useful, too.
I have been working at Forcepoint since 2014 and never get tired of getting a more clear view of the status of the stuff I monitor. — Janne Pikkarainen
This post was originally published on the author’s LinkedIn account.


I use LinuxMint as Desktop.
I do it like this:
Hi!
Thank you for the tip! Your method seems to be much easier than mine 😀
On the other hand, Selenium can provide much more detailed data; per-request durations to catch the slowest parts of the page, browser performance statistics and more, but if and when screenshots are the only need , cutycapt sure looks handy.
Thanks again!