This week, I advanced my project on multiple fronts, so welcome to this little smorgasbord of different topics. In my future posts, I will go deeper into each topic as my project goes forward.
Table of Contents
Zabbix the weatherman
Let me begin with a monitoring blooper.
As Zabbix has very well-working forecast/prediction functions for your usual IT capacity trending, I tried what happens if I let it predict the outdoor temperature based on recent temperatures. On my first try, this did not go as I planned.

You see, currently, here in Finland the temperatures change a lot during a 24 hours period: from nightly -10C or below temperatures to maybe +5C to +10C during the day. As I asked Zabbix to predict the weather based only on one hour of data one day ago, this did not go as planned.
OK, clearly the one hour worth of data was too little. What if ask Zabbix to base its forecast on one week worth of data?

The prediction slightly improves — at least it won’t predict a nuclear winter anymore — but only slightly. Zabbix in its little mind has no idea that the weather could get warmer due to the springtime. Or, in case Zabbix was right, I’ll let you know in a week.
Average data for Joe Average
As my monitoring setup collects more data, one thing I can get out of it will be averages. What’s the average temperature? What’s the average for this and that?

Above shows the average data for the last 24 hours, and on my Grafana dashboard the values change dynamically based on the time period I choose on it.
Who wouldn’t need home SLA reports?
Everybody knows how The Suits love their reports. I have this mental image where I think during their mornings they are like
[x] coffee
[x] warm bread
[x] orange juice
[x] classical music
[x] latest reports
And oh dear, their morning is ruined if the [x] is missing from the last entry. Poor Suits.
Anyway, as the recent Zabbix 6.0 brought us revamped Business Services Monitoring, why not use it for home monitoring, too? This part includes very much work in progress, but I will show you the current results.
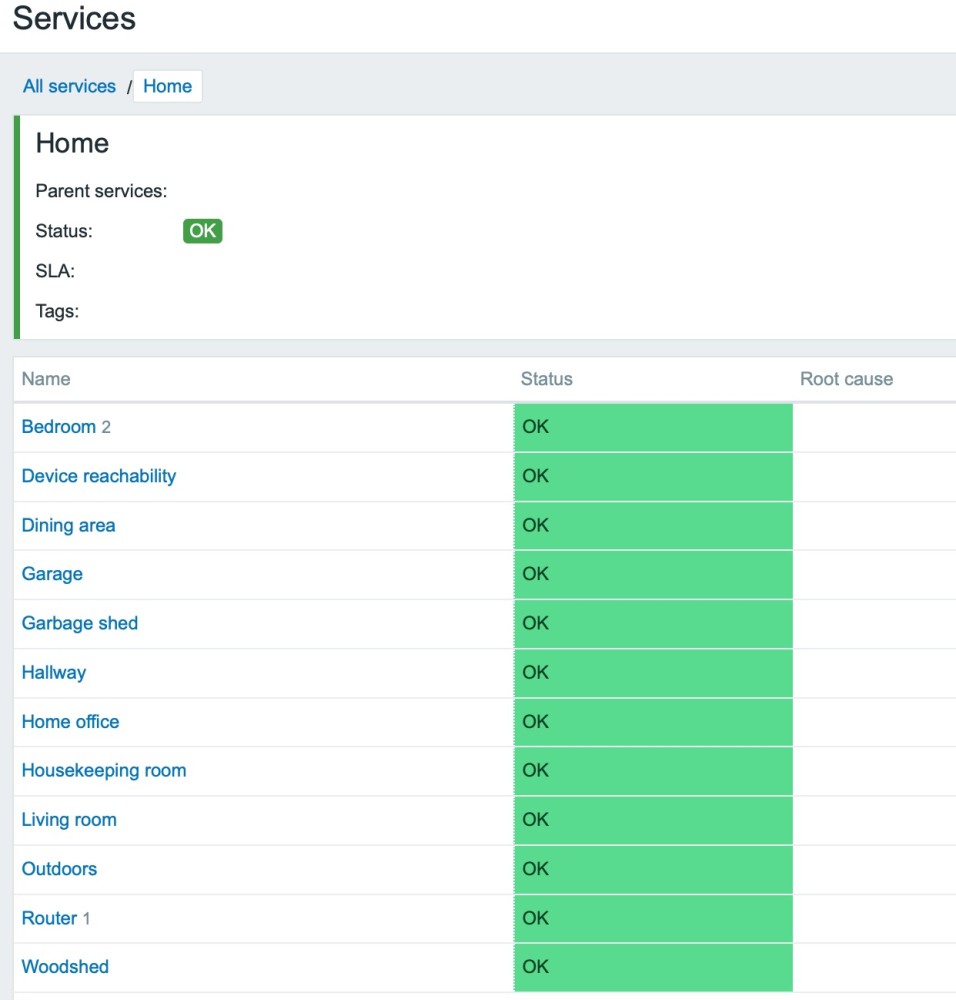
When I’m finished, each room will be configured as its own Business Service. For now, I only have entered the room names and some other stuff. There is only one room with some actual content, for now, and it’s our bedroom. What happens if I click on it?

I will get to see if the lights and temperature are OK, both from a technical standpoint and for their values. In case the status would not be OK, the root cause column would show me the reason why everything is not OK — though I would not need to click my way this far, the data would be shown on the previous page already.
As for SLAs (Service Level Agreement, for example, if you promise that your service will be available 99.9% of the time, it better be or your customer will be a sad panda and yell at you), those are also a work in progress. Zabbix can be let to generate daily/weekly/whatever SLA reports for any of the configured Business Services. I have yet to build them, but I have one for my home router already.

Come on, it’s sunny, let’s go out, Zabbix!
True story: this morning my wife asked that could I add pollen monitoring to Zabbix. My non-technical wife is getting excited about home monitoring, too! (I think she’s only pretending. Still AWESOME!)
I still need to add pollen monitoring — the data is available as open data — but I initialized The Great Outdoors Monitoring in two other areas.
Where’s my train?
Just before creating this post, I proved to myself that I can show live train data on Grafana. I sure got a screenful, as I have not played around with GraphQL too much, and for now, I got way more trains than I planned to get, and the data contains extra fields I need to filter out with Grafana’s Organise Fields. Still, connection established! Wooooo!

What’s for lunch?
Only added one lunch restaurant for now, but in theory, I will receive an alert whenever the restaurant posts its new weekly lunch menu. Zabbix is configured to be a good netizen though and it will only try to fetch the menu every one hour on Monday morning, no point to poll them all week, so let’s see how this will work.

That’s all for now. See you next week!
I have been working at Forcepoint since 2014 and I am a walking monitoring unit. — Janne Pikkarainen
* Please note, that this blog post was originally written a few months ago, in early Spring, and the temperature records do not correspond to the actual weather at the time of publication.
This post was originally published on the author’s LinkedIn account.