


Zabbix Team is very happy to announce the release of Zabbix 4.2!
Does Zabbix 4.2 answers The Ultimate Question of Life, the Universe, and Monitoring? Well, let’s have a closer look!
Zabbix is a universal Free and Open Source enterprise-level monitoring solution. It covers performance and availability of servers, IoT and network devices, databases, applications, cloud resources, web services and more. By no means is the tool limited to just IT infrastructure monitoring, as it can also effortlessly cater to environmental and business metrics.
Needless to say, Zabbix comes with all the bells and whistles a modern monitoring system should: data collection and processing, distributed monitoring, real-time problem and anomaly detection, alerting and escalations, visualization and more.
So what does Zabbix 4.2 actually bring to the table? Here’s what we have in store for you:
Official support of new platforms

In addition to existing official packages and appliances, Zabbix 4.2 also caters to the following platforms:
- RaspberryPi, Mac OS/X, SUSE Enterprise Linux Server 12
- MSI for Windows agent
- Docker images
Built-in support of Prometheus data collection
Zabbix is able to collect data in many different ways (push/pull) from various data sources including JMX, SNMP, WMI, HTTP/HTTPS, RestAPI, XML Soap, SSH, Telnet, agents, scripts and other data sources, with Prometheus being the latest addition to the bunch.
Strictly speaking, data retrieval from Prometheus exporters was already possible thanks to HTTP/HTTPS checks and data preprocessing using regular expressions.
Now we offer a more elegant integration with the exporters using native support of PromQL language. Moreover, the use of dependent metrics gives us the ability to collect massive amounts of Prometheus metrics in a highly efficient way: we get all the data using a single HTTP call and then just reuse it for corresponding dependent metrics.
 Getting a single metric value
Zabbix can also transform Prometheus data into JSON format, which can be used directly for low-level discovery.
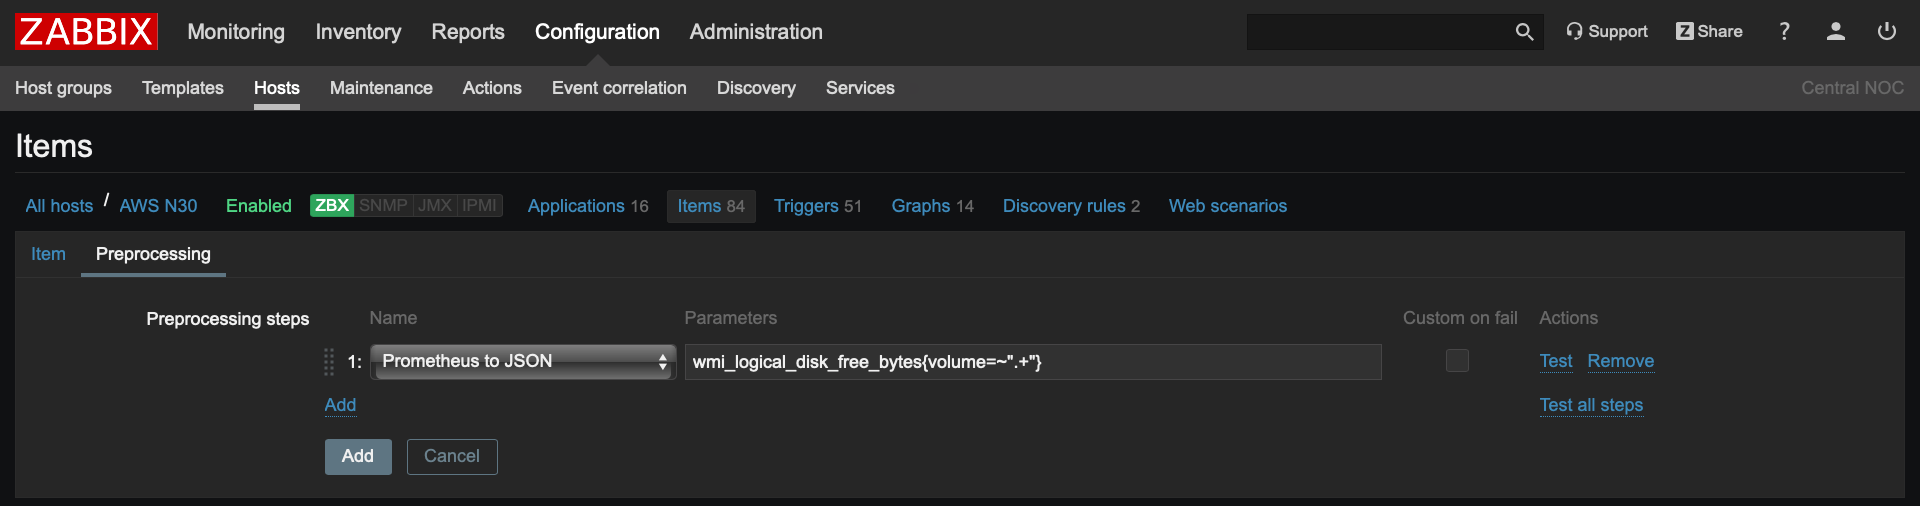 Finding a set of metrics using filters in PromQL format
Right now there are more than 300 ready to use integrations for monitoring services and applications with Zabbix. Adding support of Prometheus exporter in 4.2 makes it possible to expand the list with both officially and community supported applications for monitoring services, cloud resources and containers.
Efficient high-frequency monitoring
Do we all want to discover problems as fast as possible? Absolutely! Quite often, however, this forces us to perform checks too frequently, thus overloading the monitoring system. How can we avoid that? Simple – with throttling for preprocessing, as it allows us to skip recurrent values.
Suppose we’re focusing on the availability of a mission critical application. Zabbix is configured to check if it’s up and running every second. It then receives a continuous flow of zeros (application is down) and ones (application is alive) like this: 1111111111110001111111111111…
Do we really need to process all of that? Nope. Remember, we are only interested in status changes, and that’s exactly what throttling was designed to address. As a result, our flood of data will instead transform into something like this – 01010101… This is absolutely sufficient for problem detection and won’t force you to store unnecessary data!
Zabbix ignores skipped values and does not store them, therefore they do not affect triggers and problem generation in any way. The simple truth is that from Zabbix point of view these values have never even existed.
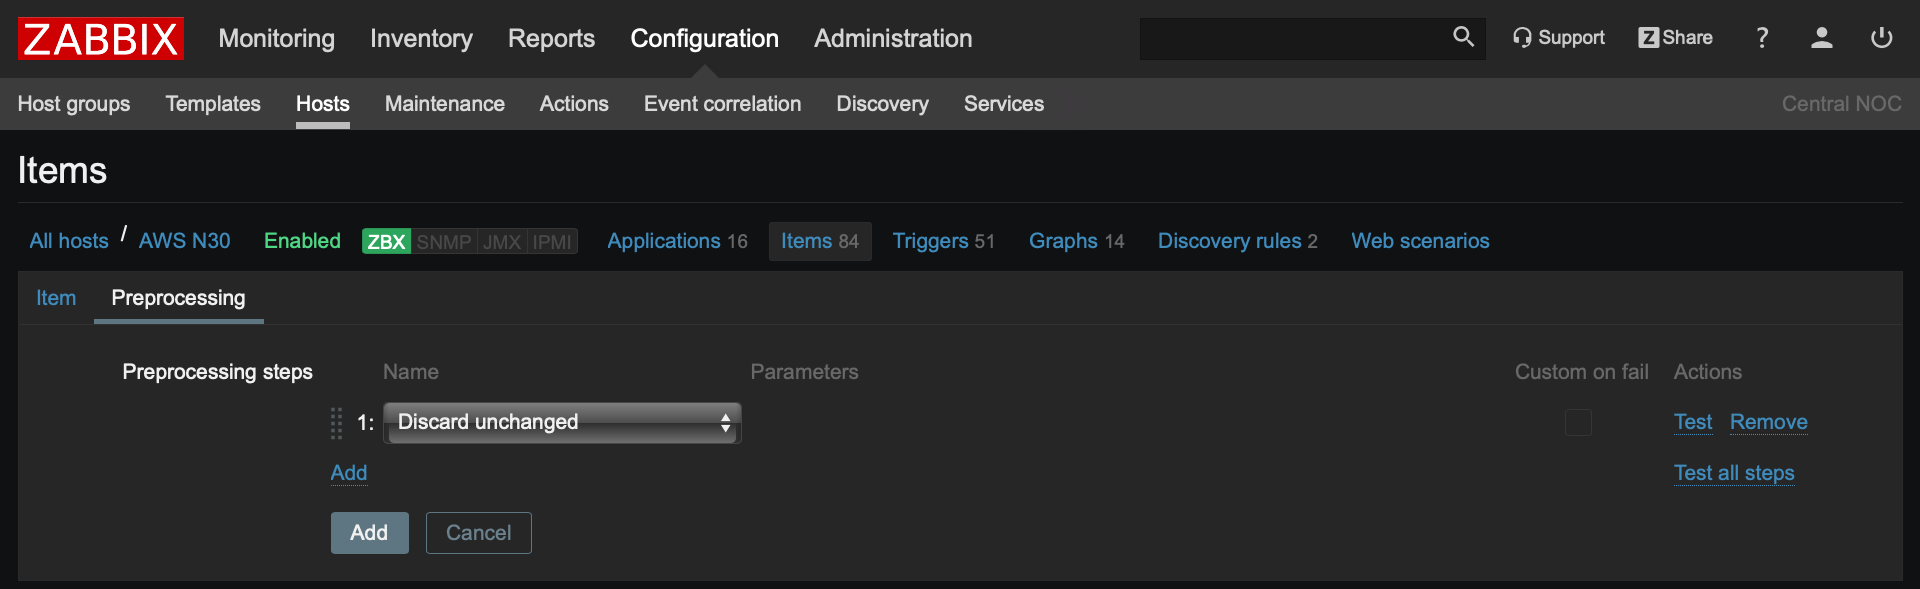 Ignoring recurrent values
Great, now we can collect data with high frequency, instantly discover problems without keeping excessive amount of history data in the Zabbix database.
What about the graphs though? Are they supposed to be blank because of lack of data? And how do we know that Zabbix even collected any data, as most of it will be ignored anyway?
No worries fam, we have a solution for that too – something we call “throttling with heartbeat”.
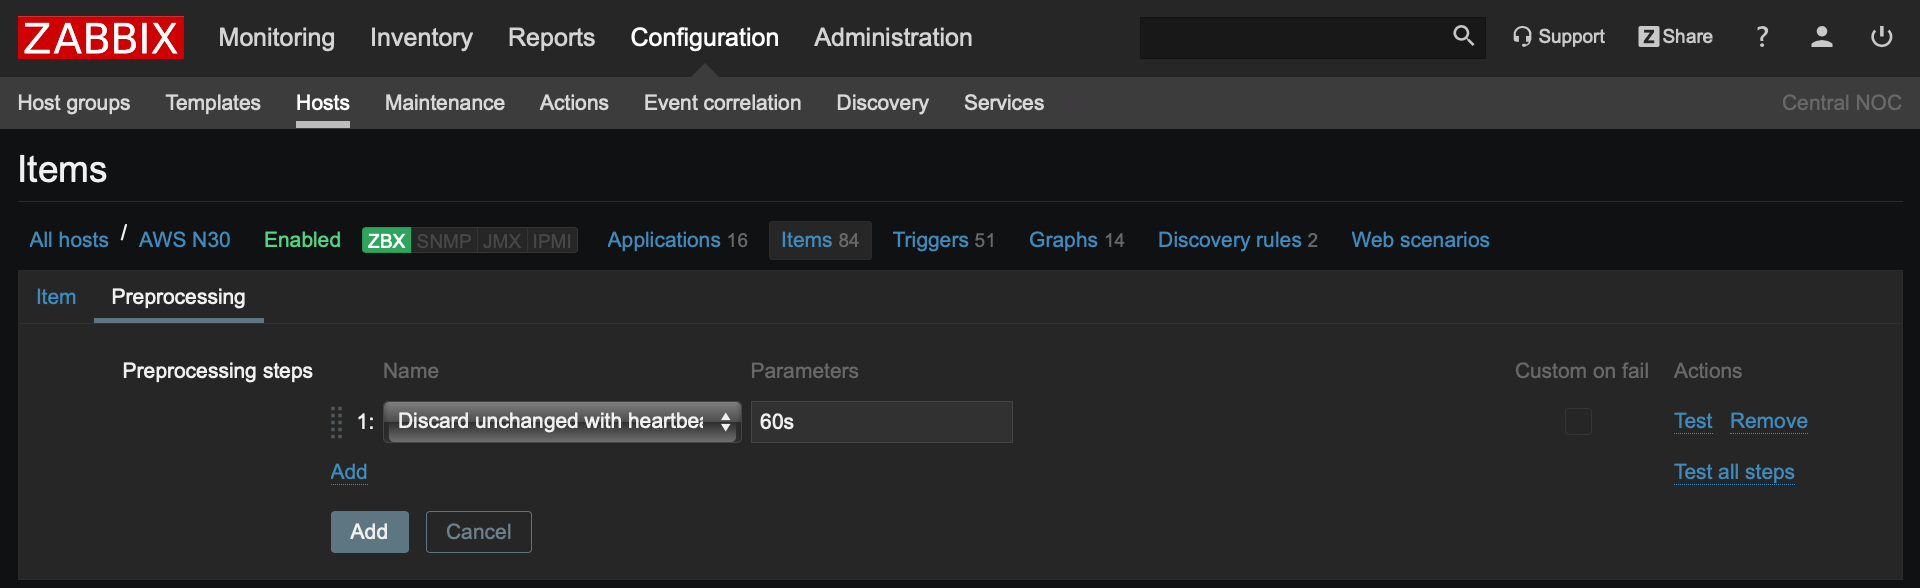 Checking that a metric is alive every minute
In this case Zabbix will process at least one value for a given period of time. Therefore, if we collect data every second and heartbeat period is set to one minute, Zabbix will only keep every 60th value, leading to 60x data compression.
Thanks to throttling with heartbeat we can be absolutely confident that the data is collected, trigger function nodata() is operational and we have nice graphs!
Validation of collected data and error handling
No one wants to collect incorrect data. If we know that a sensor is supposed to return temperature readings in a range of 0°C up to 100°C, then any other value should be considered as incorrect and be ignored.
With Zabbix 4.2 we can address that via built-in preprocessing rules that validate data by matching or not matching regular expression, using JSONPath or XMLPath.
We can also define how to react to any problem related to preprocessing. If received temperature measurement are outside the valid range, then we can simply ignore them. We may also set value to a default one (for example, 0°C) or define our own error message, like “Sensor is broken” or “Change battery”.
 Temperature must be in a range of 0-100, ignore other values
Now it is also possible to extract error messages from collected data. This can be especially handy if we get an error from external APIs.
Preprocessing data with JavaScript
Remember when functionality of the built-in data preprocessing was not sufficient? Well that’s not the case anymore! Now you can fully harness the power of user-defined scripts written in JavaScript!
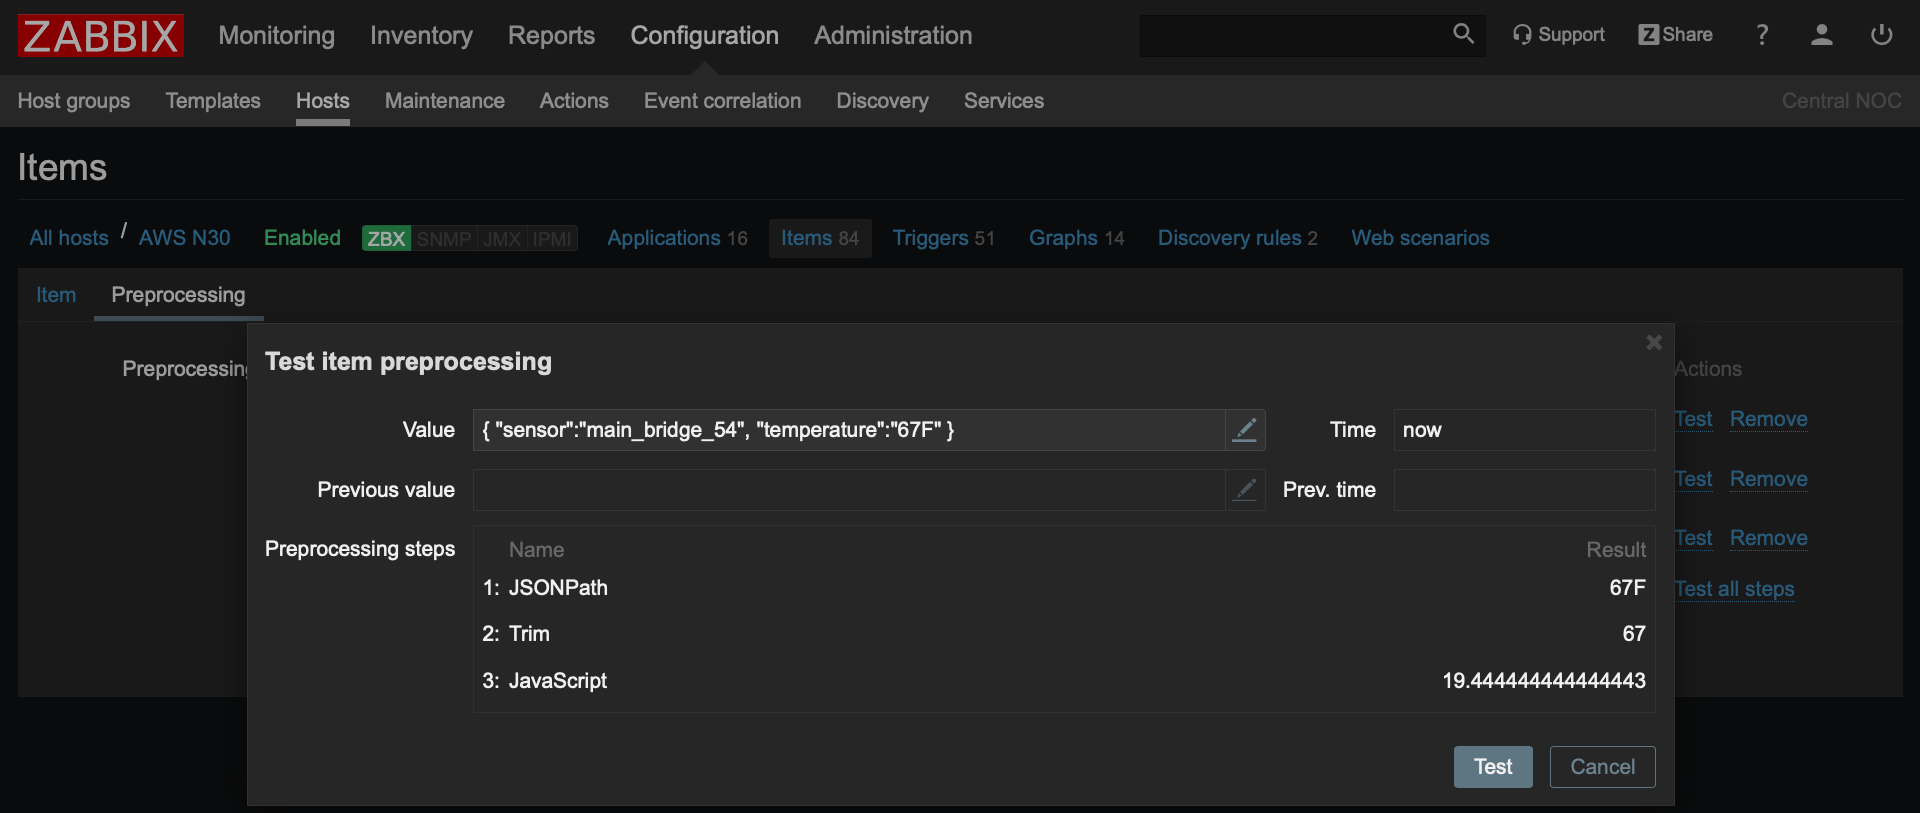
 One-liner for converting temperature from Fahrenheit to Celsius
Support of JavaScript gives absolute freedom of data preprocessing! In fact, we can drop all external scripts we wrote and replace them with JavaScript.
This enables all sorts of data transformation, aggregation, filtering, arithmetical and logical operations and much more!
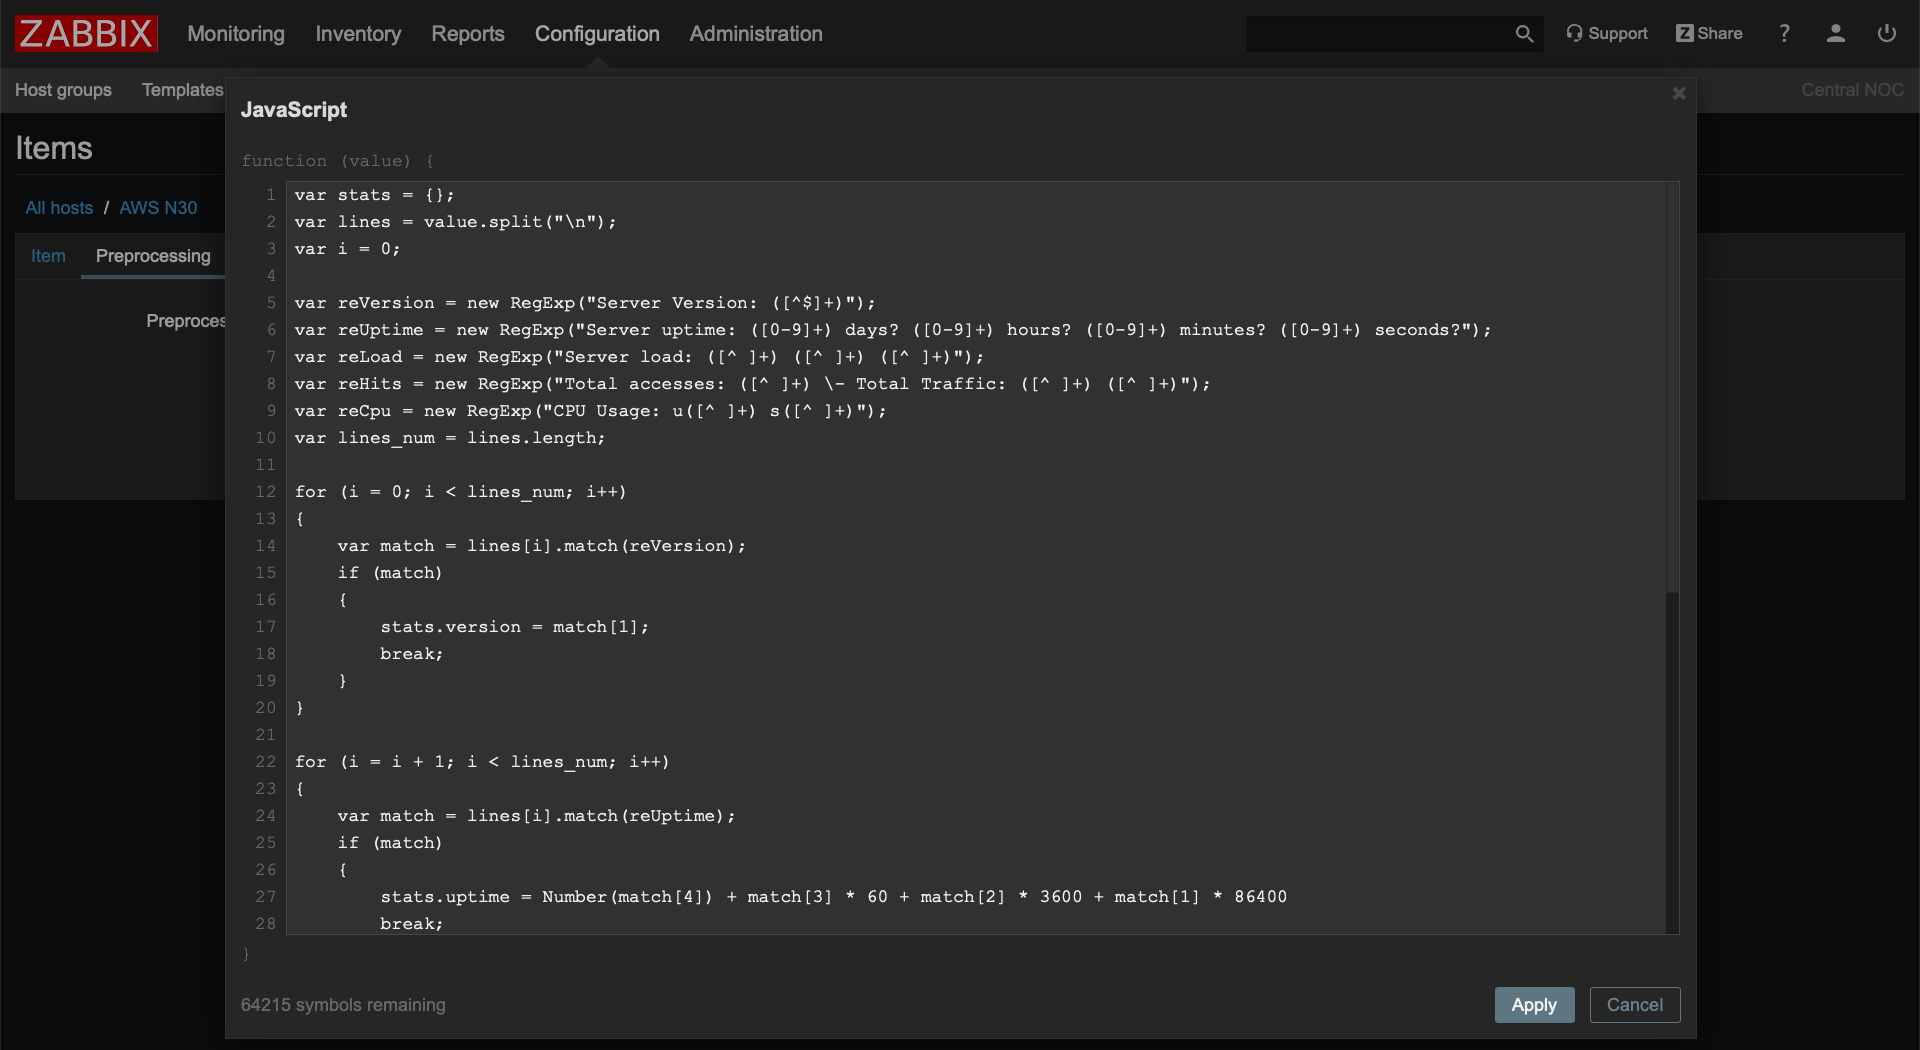 Extracting useful data by parsing output of Apache mod_status with JavaScript
Test preprocessing rules from UI
As preprocessing becomes much more powerful, it is important to have a tool to verify complex scenarios. Zabbix 4.2 allows us to test preprocessing rules straight from the Web UI! Pretty cool, right?
Processing millions of metrics per second!
Prior to 4.2, all preprocessing was handled solely by the Zabbix server. Now, however, we are ready to deliver greater scalability, since all preprocessing functions can also be performed by proxies.
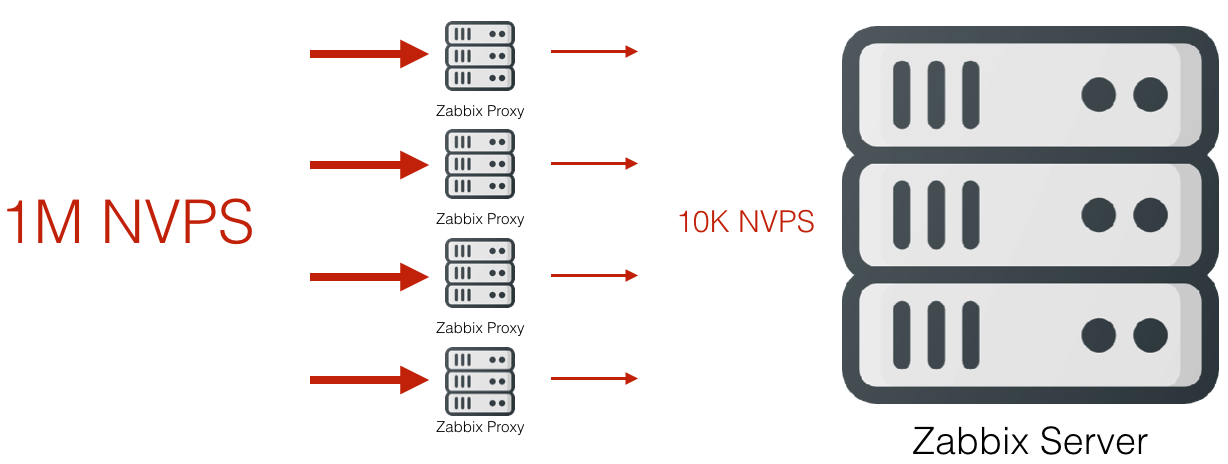
A combination of proxy-based preprocessing with throttling gives us the ability to perform high-frequency monitoring collecting millions of values per second without overloading the Zabbix Server. Proxies perform massive preprocessing of collected data while the Server only receives a small fraction of it.
Easy low level discovery
Remember, low-level discovery (LLD) is a very effective tool for automatic discovery of all sorts of resources (filesystems, processes, applications, services, etc) and automatic creation of metrics, triggers and graphs related to them. It tremendously helps to save time and effort allowing to use just a single template for monitoring devices with different resources.
Low-level discovery used to require a specially formed JSON to work correctly…not anymore!
Zabbix 4.2 supports processing based on arbitrary JSON input, which in turn allows us to communicate directly with external APIs, for example, and use received data for automatic creation of hosts, metrics and triggers.
Combined with JavaScript preprocessing it opens up fantastic opportunities for templates, that may work with various external data sources such as cloud APIs, application APIs, data in XML, JSON or any other format.
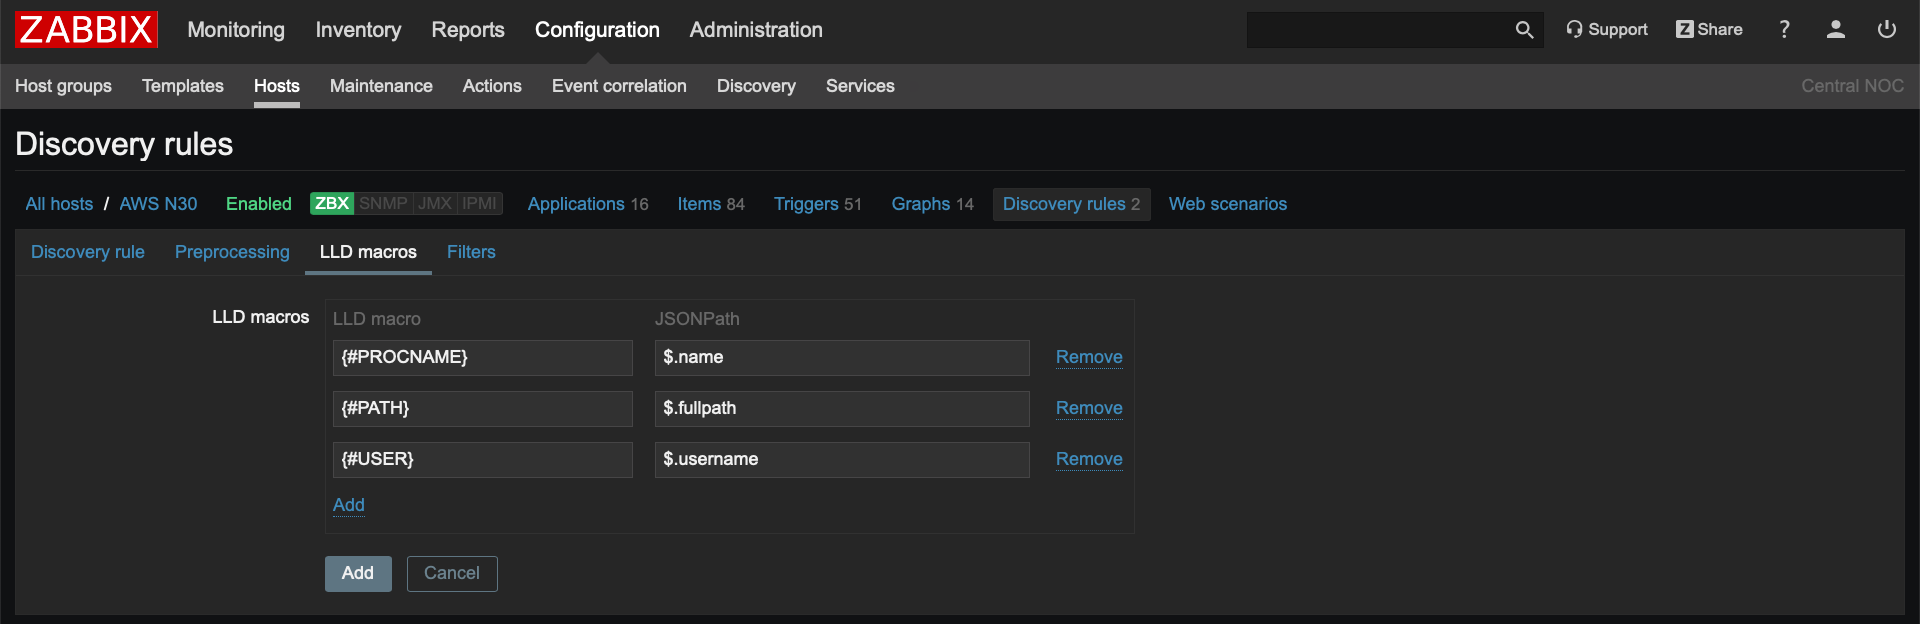 Connecting JSON to process data with LLD
The sky is the limit!
Support of TimescaleDB

TimescaleDB promises better performance due to more efficient algorithms and performance oriented data structures.
Another significant advantage of TimescaleDB is automatic table partitioning, which improves performance and (combined with Zabbix) delivers fully automatic management of historical data. However, we have to admit, that Zabbix team hasn’t performed any serious benchmarking yet. It is also hard for us to comment on real life experience of running TimescaleDB in production.
At this moment TimescaleDB is an actively developed and rather young project, so please use it with care.
Simplified tag management
Prior to Zabbix 4.2 we could only set tags for individual triggers. Now tag management is much more efficient thanks to template and host tags support.
All detected problems get tag information not only from the trigger, but also from the host and corresponding templates. Nice!
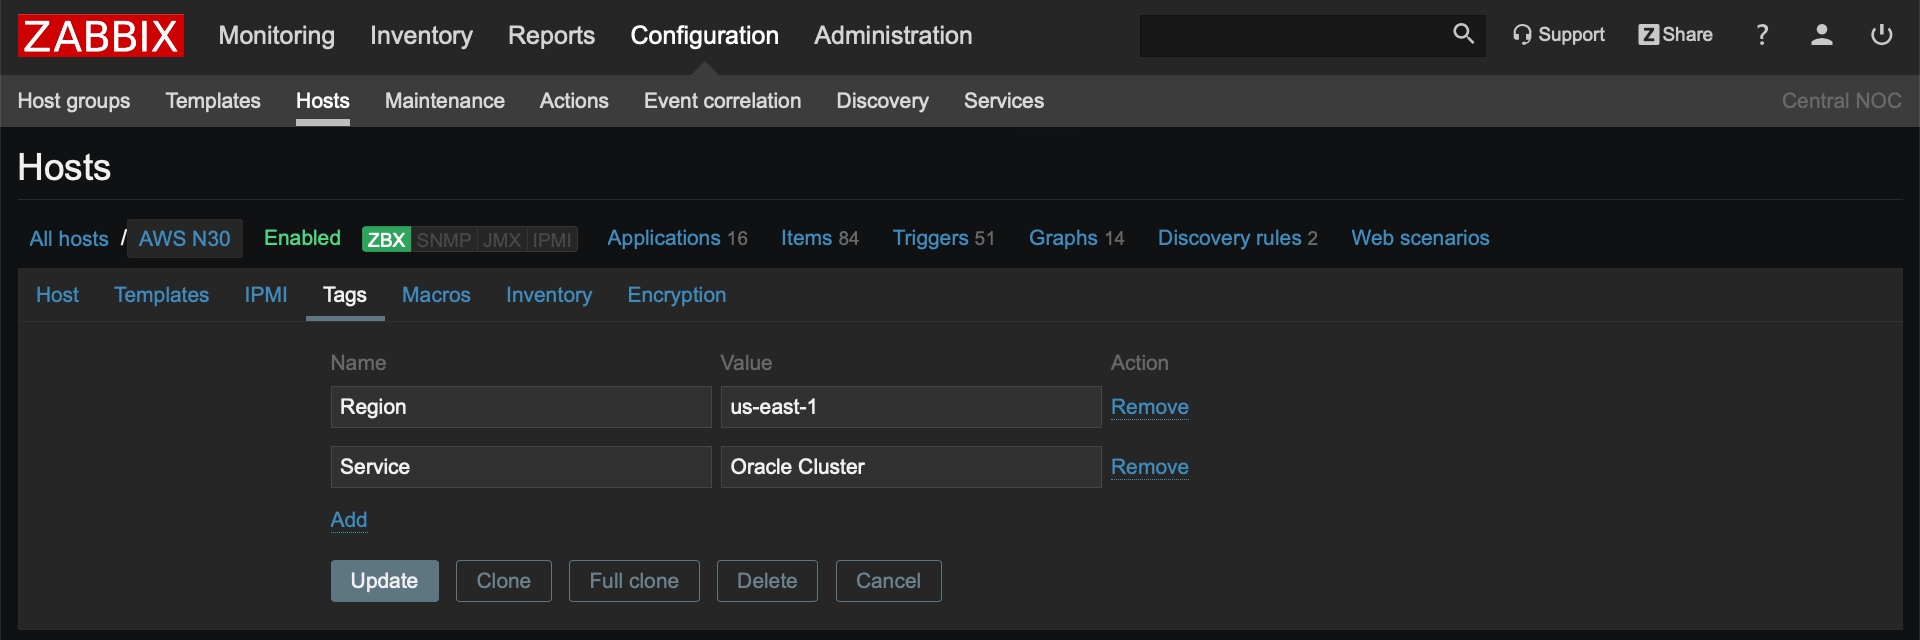 Defining host-level tags
More flexible auto-registration
Zabbix 4.2 auto-registration options give us the ability to filter host names based on a regular expressions. It’s really useful if we want to create different auto-registration scenarios for various sets of hosts. Matching by regular expression is especially beneficial in case we have complex naming conventions for our devices.
Control host names for auto-discovery
Another improvement is related to naming hosts during auto-discovery. Zabbix 4.2 allows us to assign received metric data to a host name and visible name.
It is an extremely useful feature that enables great level of automation for network discovery, especially if we use Zabbix or SNMP agents.
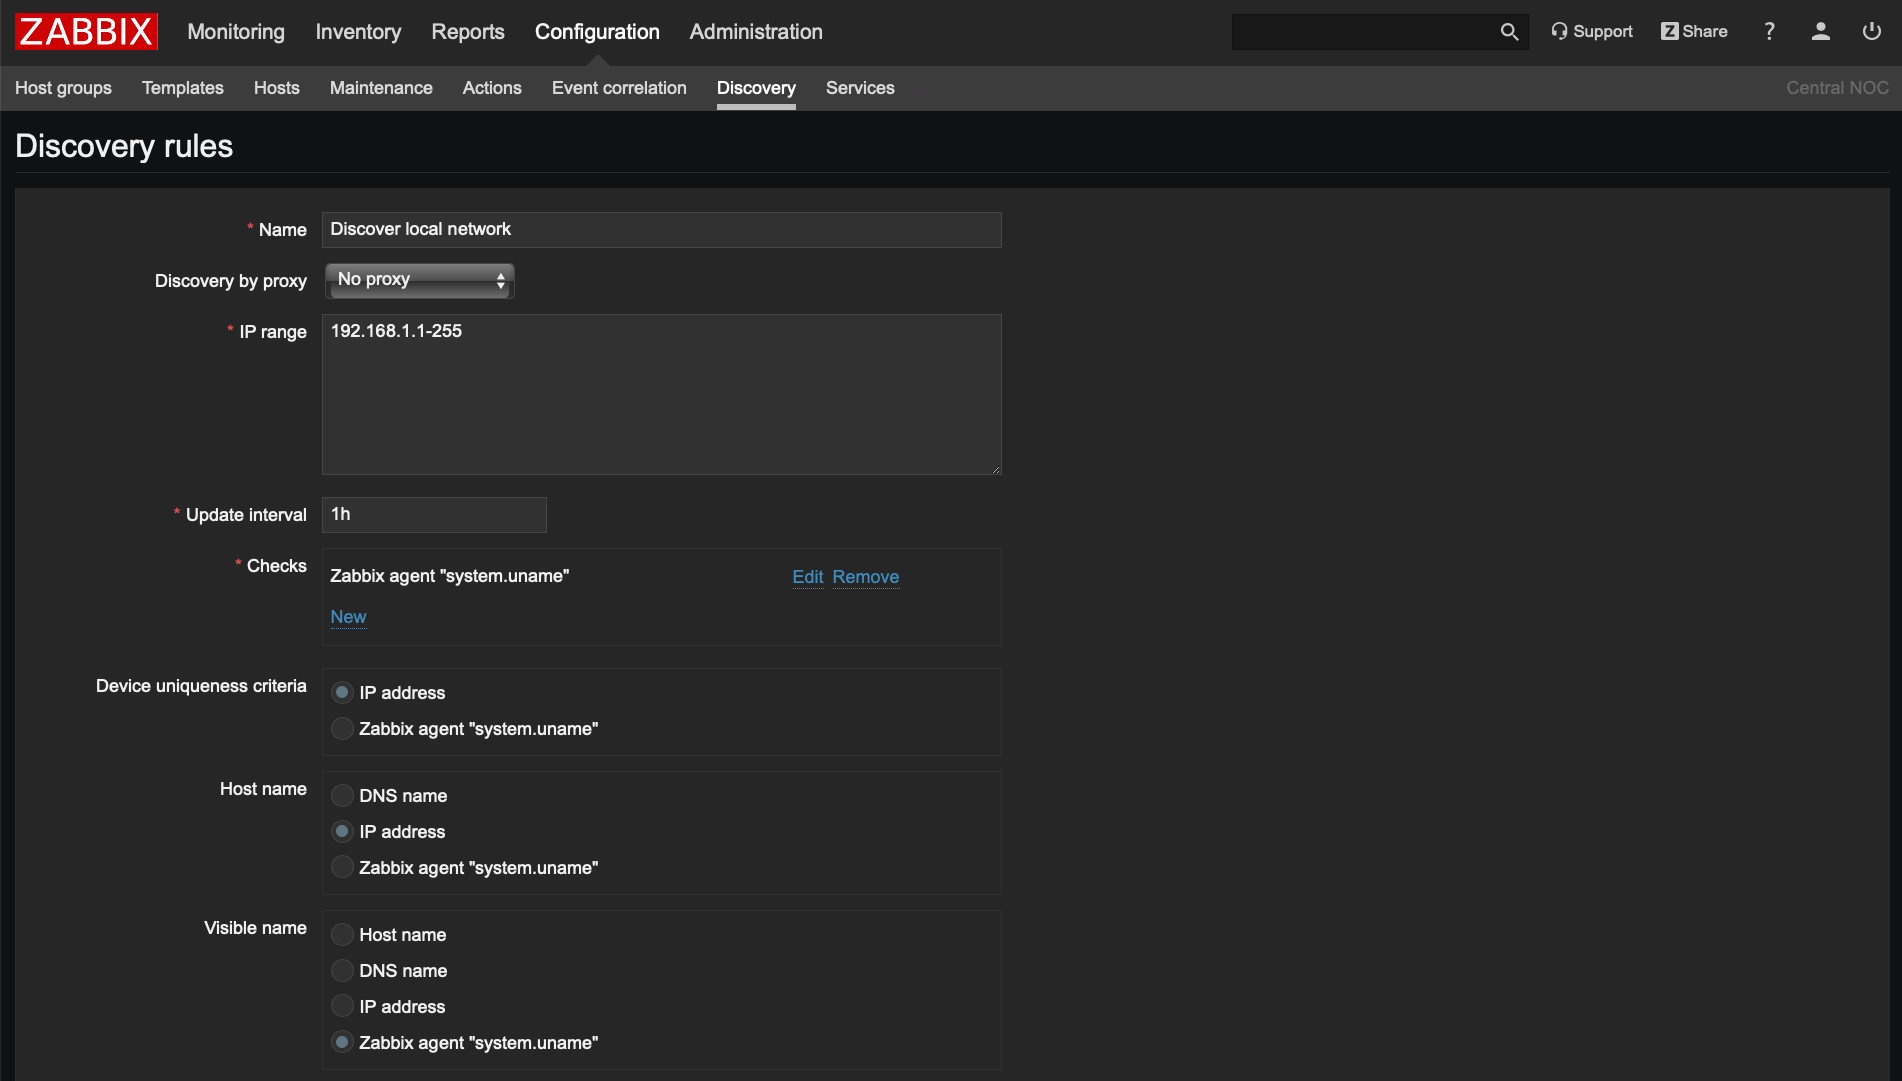 Configure discovery to automatically assign visible host name to local hostname
Test media type from Web UI
Zabbix 4.2 allows us to send a test message or check that our chosen alerting method works as expected straight from the Zabbix frontend. This is quite useful for checking the scripts we are using for integration with external alerting and helpdesk systems etc.

Remote monitoring of Zabbix components
Zabbix 4.2 introduces remote monitoring of internal performance and availability metrics of the Zabbix Server and Proxy. Not only that, it also allows us to discover Zabbix related issues and alert us even if the components are overloaded or, for example, have a large amount of data stored in local buffer (in case of proxies).
Nicely formatted email messages
Zabbix 4.2 comes with support of HTML format in email messages. It means that we are not limited to plain text anymore, the messages can use all power of HTML and CSS for much nicer and easy to read alert messages.
It is time to learn some HTML and CSS!
 Even with minor HTML formatting it looks much better than plain text!
Accessing remote services from network maps
A new set of macros is now supported in network maps for creation of user-defined URLs pointing to external systems. It allows us to open external tickets in helpdesk or configuration management systems, or do any other actions using just one or two mouse-clicks.
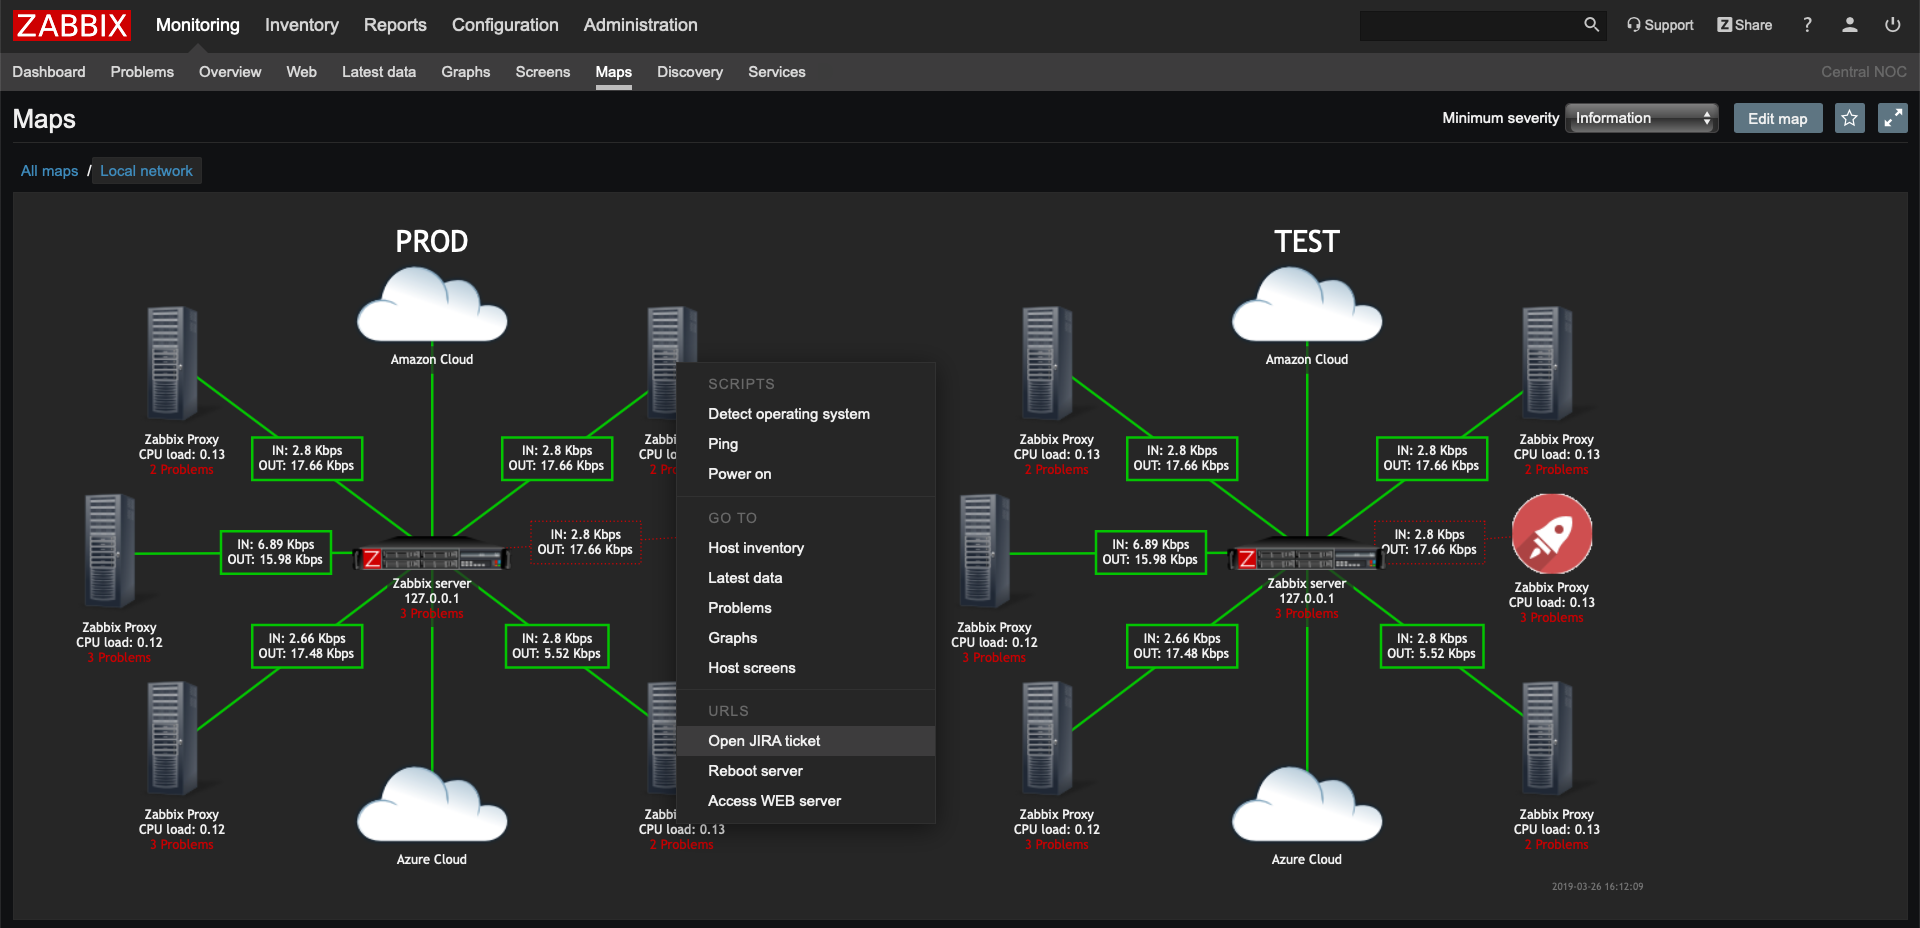 Open a new ticket in Jira or ServiceNow with just one click
LLD rule as a dependent metric
This functionality allows us to use received values of a master metric for data collection and LLD rules simultaneously. In case of data collection from Prometheus exporters, Zabbix will only execute HTTP query once and the result of the query will be used immediately for all dependent metrics (LLD rules and metric values).
Animations for maps
Zabbix 4.2 comes with support of animated GIFs making problems on maps more noticeable.
 Much better visibility of problem devices
Extracting data from HTTP headers
Web-monitoring brings the ability to extract data from HTTP headers.
With this we can now create multi-step scenarios for Web-monitoring and for external APIs using the authentication token received in one of the steps.
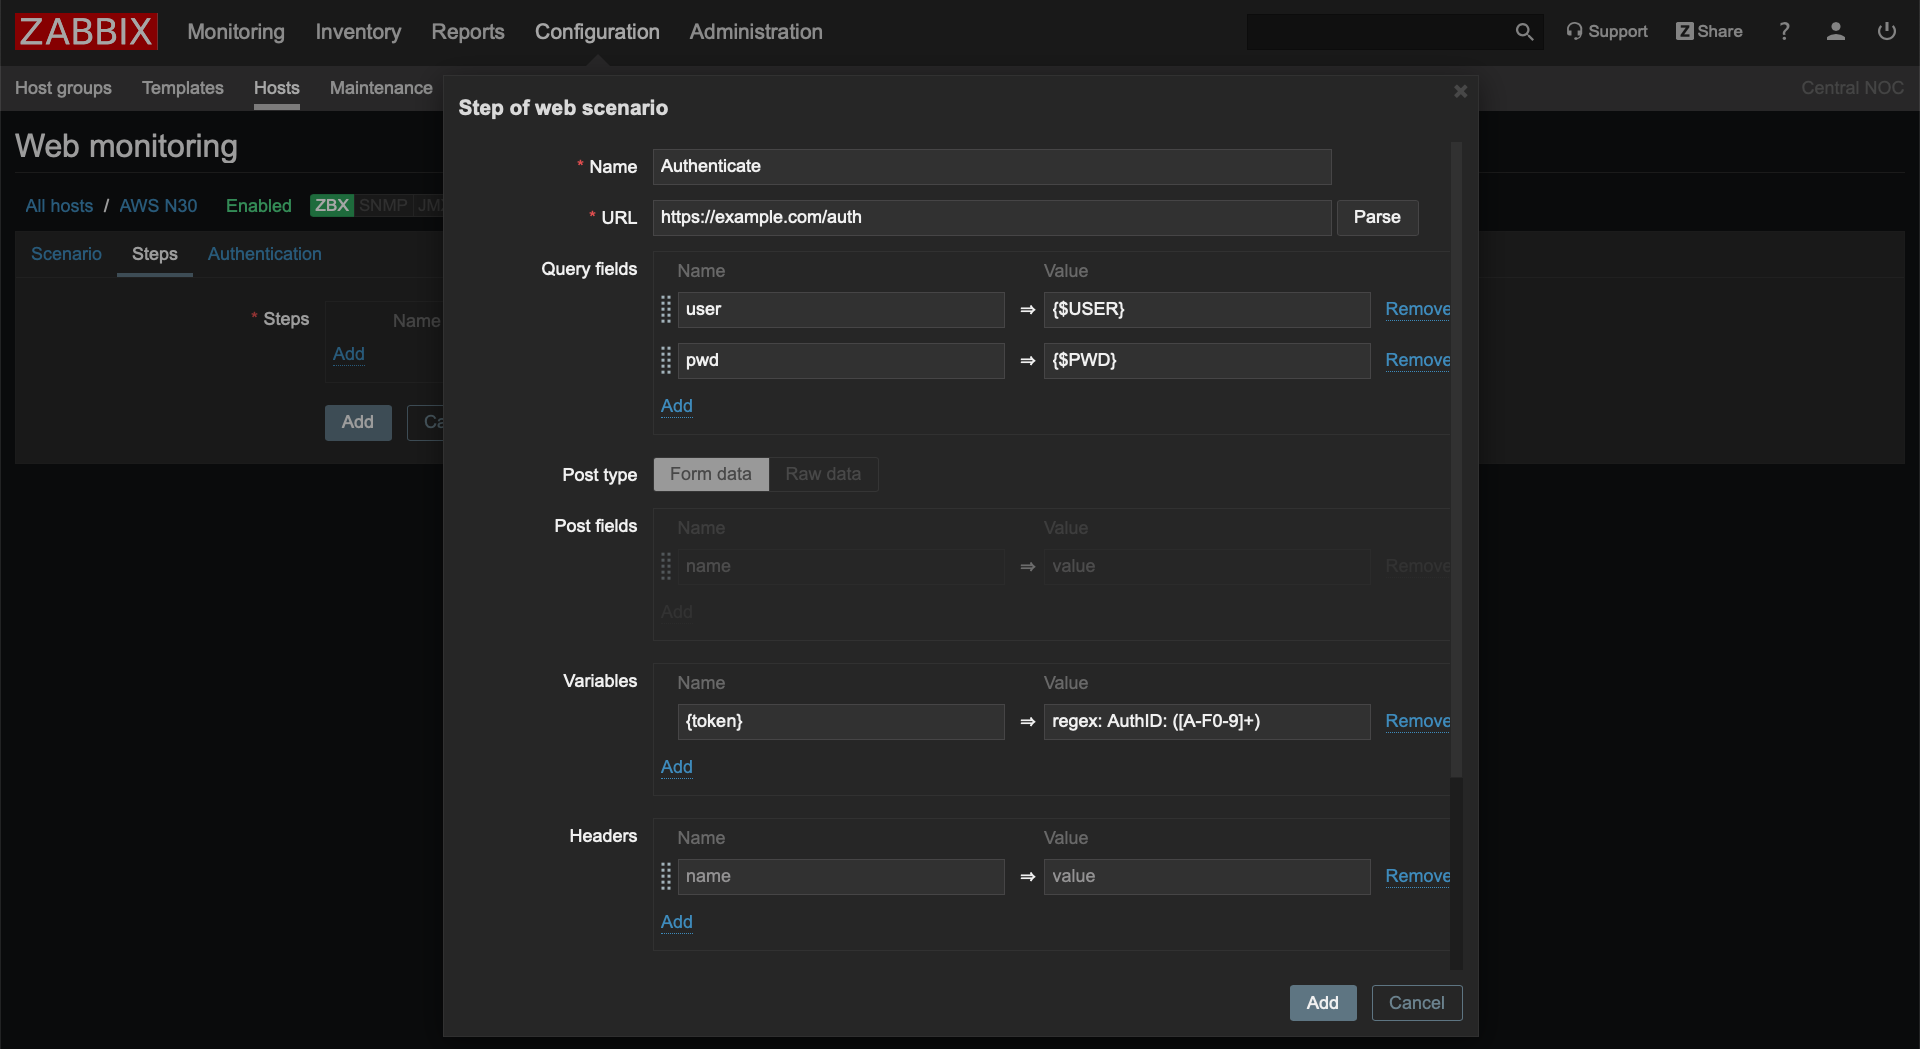 Extracting AuthID from HTTP header
Zabbix Sender pushes data to all IP addresses
Zabbix Sender now sends metric data to all IP addresses defined in the “ServerActive” parameter the of Zabbix Agent configuration file.

Filter for configuration of triggers
Configuration of triggers page got a nice extended filter for quick and easy selection of triggers by a specified criteria.
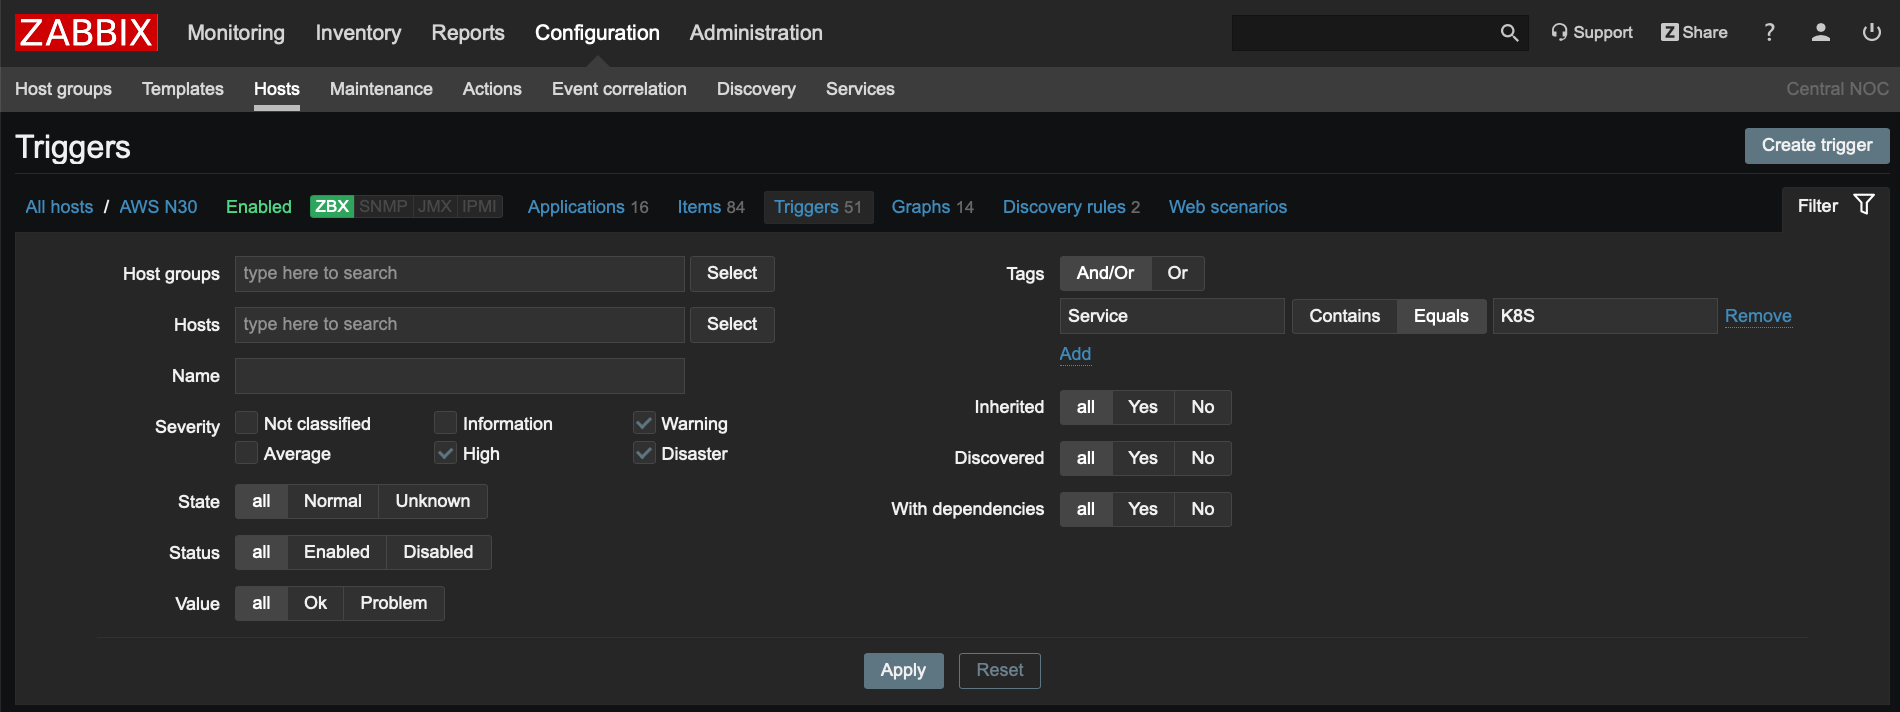 Example of selecting triggers related to K8S service only
Showing exact time in graph tooltip
It is a minor yet very useful improvement. Zabbix will show you timestamp in graph tooltip.
Other improvements
-
Non-destructive resizing and reordering of dashboard widgets
-
Mass-update for item prototypes
-
Support of IPv6 for DNS related checks (“net.dns” and “new.dns.record”)
-
“skip” parameter for VMWare event log check “vmware.eventlog”
-
Extended preprocessing error messages to include intermediate step results
How to upgrade?
In order to upgrade you just need to download and install new binaries (server, proxy and Web UI). When you start the upgraded Zabbix Server it will automatically update your database structure as well.
Please note, you don’t need to install new agents as they are backwards compatible and will work with Zabbix 4.2 just fine.
We offer free webinars about Zabbix 4.2 and all its new features, so don’t miss your chance to find out more! Sign up today!
You can also check Zabbix r/zabbix community on Reddit and of course the Zabbix Forum!
Useful links
— Release notes
— Upgrade notes


[…] mucho más detalles en este vínculo del Zabbix Blog, en […]
[…] mucho más detalles en este vínculo del Zabbix Blog, en inglés.. Lea también los Release Notes de la versión de Zabbix 4.2 […]