


The case about how Apache Corporation put Zabbix to work helping satisfy special requirements in the Oil & Gas industry where it is common to have more than one industrial automation supplier across multiple production and processing facilities. Consolidated monitoring of complex IT infrastructure, OEM industrial devices/services, custom applications, and integration with other open-source solutions.
Contents
I. Zabbix integration with industrial automation systems (0:26)
1. Background (1:55)
2. Why Zabbix? (8:40)
II. Conclusion (26:30)
Zabbix integration with industrial automation systems
Background
A typical modern processing facility has a so-called Main Control Room (MCR) with human-machine interface screens and perhaps several remote Equipment Rooms with specific controllers wired to different types of field transmitters and actuators. The overall size of the system depends on the process complexity and the number of control parameters.
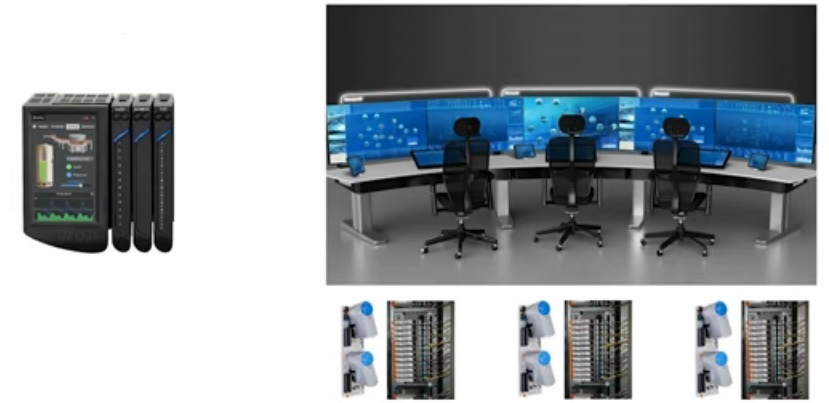
Main Control Room vs. standalone controller
Plant operators are responsible for ensuring facility systems’ smooth operation and making any necessary changes to optimize throughput and operating efficiency.
 Operations
The operators are also responsible for responding to process alarms, which are also highly customizable.
NOTE. Poorly designed alarm hierarchy could lead to bad results, as the operator can miss any critical alarm and this may lead to production losses, equipment failure, etc.
Process alarms hierarchy
The control system is composed of a very large number of interconnected devices; from field instrumentation through to communication devices, such as network switches, and computers that run the HMI graphics.
System alarms are maintenance engineer’s responsibility and, in most cases, they are not announced in MCR. This approach varies from site to site but the idea behind such a decision is “do not disturb” production personnel with problems they could not solve anyway.
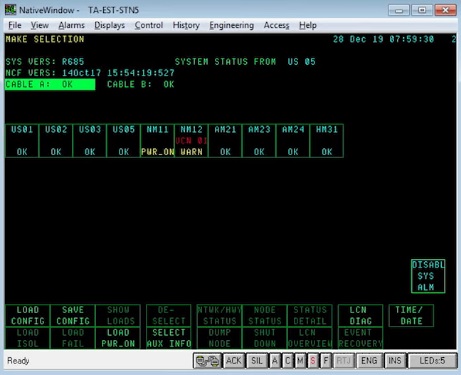
Fortunately most of DCS/SCADA components are nowadays redundant, i.e there is no single point of failure. However, it is essential for maintenance personnel to know the current state of each device and take corrective actions before minor system problems develop into something that might cause undesirable process upsets.
 System status display example
In an ideal world, you have only one Industrial Automation supplier for the plant lifecycle. In a real-life, it’s not at all that cheerful.

Apache facilities locations
For instance, at our Apache facilities, we have:
- 9 remote locations,
- 3 main OEM suppliers (Honeywell, GE & Rockwell),
- Multiple PLC types from several vendors,
- Almost all generations of Windows (W2K, XP, 7, 10, 2003/08/12),
- Communications over fiber optics, WiMax, and VHF Radio.
I can’t say that our installation is big as compared with other facilities, but we need to take care of a number of devices:
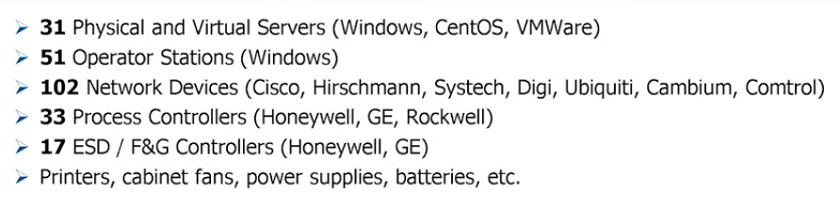
We need something highly customizable to coordinate different control systems of various vendors, different types of devices talking over different protocols. What we need is Zabbix.
Why Zabbix?
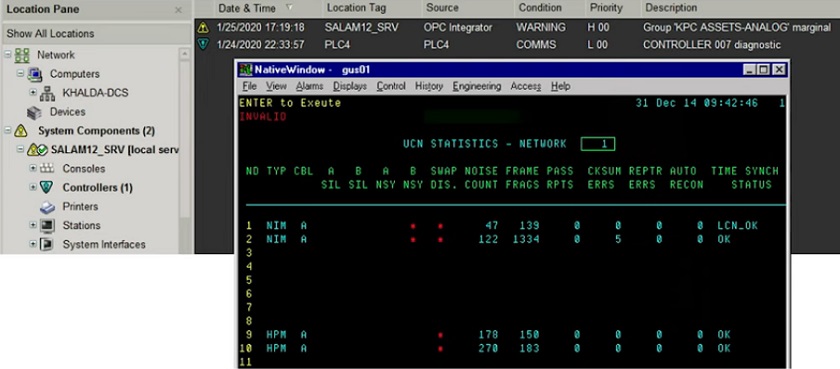
Each vendor has some method of logging or displaying diagnostic data for their equipment. However, this information is usually only accessible via proprietary software installed on standalone engineering stations. In many cases the interface of those applications is not particularly user-friendly and all of them look vastly different.
 Different diagnostic displays
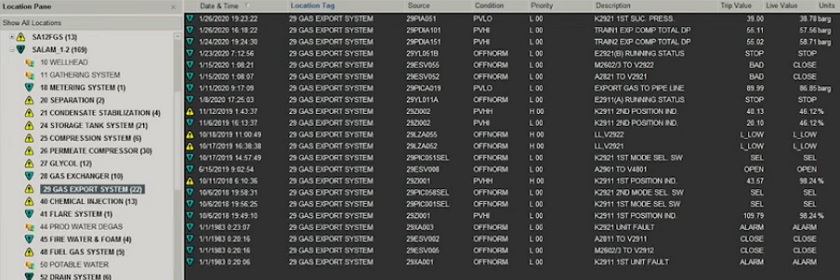
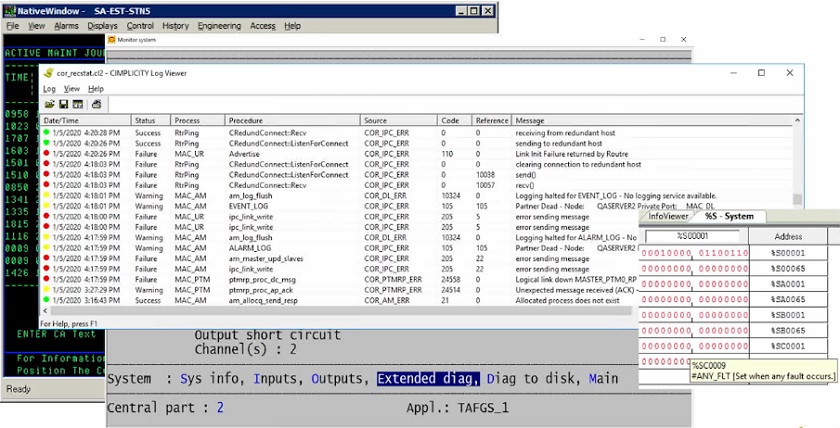
Some control system vendors don’t provide a diagnostic screen at all, and you have just a sequence of events and have to look up and visualize them to identify what’s going on. In the worst case, you have to look into the specific memory register to find out what’s going wrong with your system.
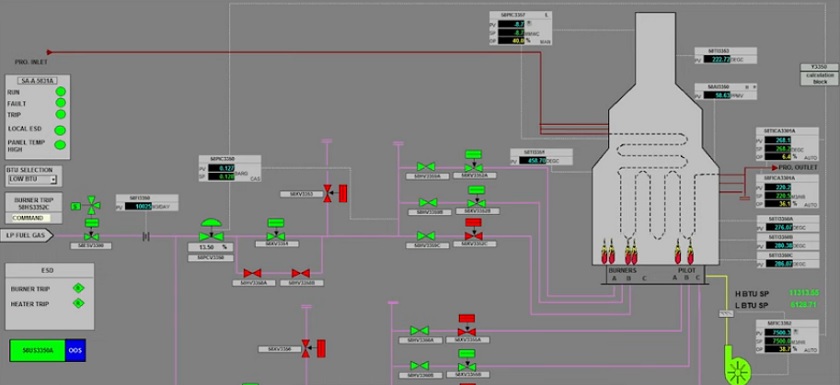
Most SCADA manufacturers use a common PC-based platform with special software, which sometimes doesn’t provide any diagnostic information at all. You have only visual indications with no audible alarm, and to dig deeper, you need to search inside the log.
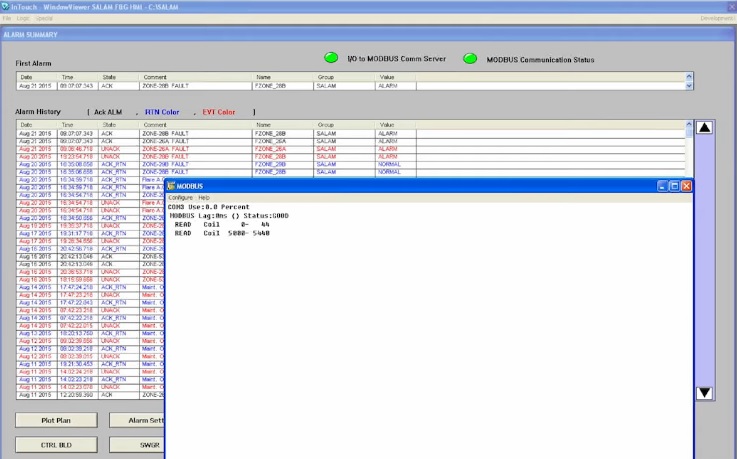 Example of an obsolete SCADA system running on the Windows XP
Finally, it is necessary to monitor auxiliary machines that are not a part of SCADA/DCS but play a significant role in the customer-specific environment. In this case, we use a special application to send files over serial links.
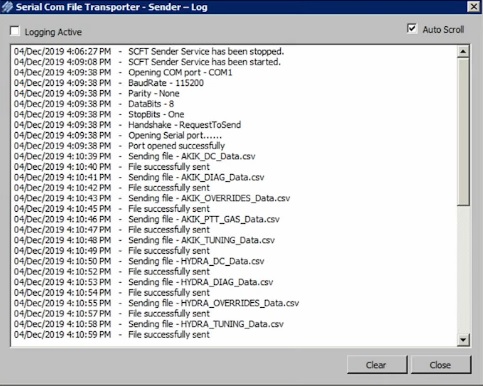 Sending files over serial links
We also have Grafana running on top of the InfluxDB, as we need to visualize process data and provide this information for management.

InfluxDB service status
Simplified system architecture: Zabbix server for performance metrics, Graylog server as central storage for all events, and OPC client who gathers diagnostic and process data from the different vendors.
Open Platform Communications (OPC) is a series of standards and specifications for industrial telecommunication. An industrial automation task force developed the original standard in 1996 under the name OLE for Process Control (Object Linking and Embedding for process control) and after the initial release, the OPC Foundation was created to maintain the standard). The beauty of this decision is that the OPC protocol is independent of the vendor.
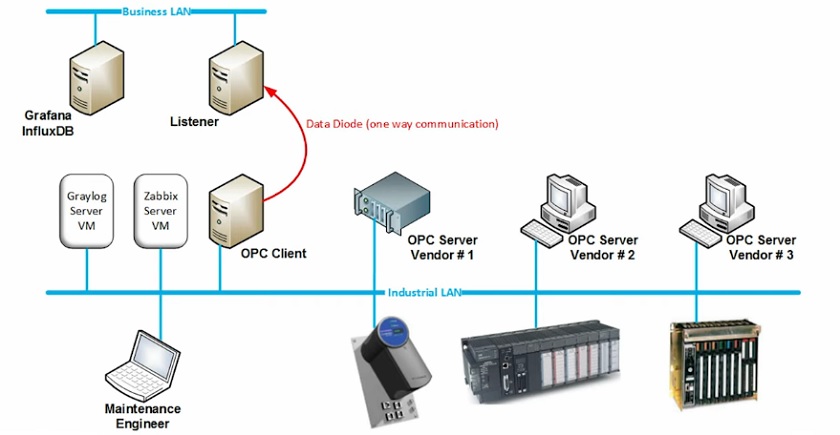 Simplified industrial system architecture
We use our in-house PowerShell script, which runs every five minutes as a scheduled task, free DLLs provided by the OPC Foundation, and one JSON file per site.
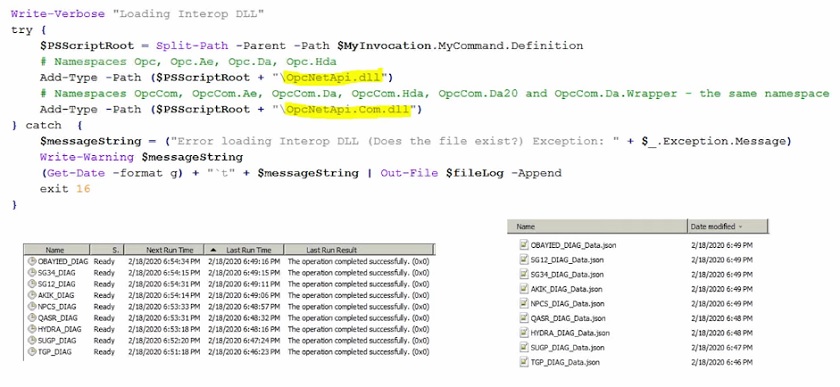 PowerShell script
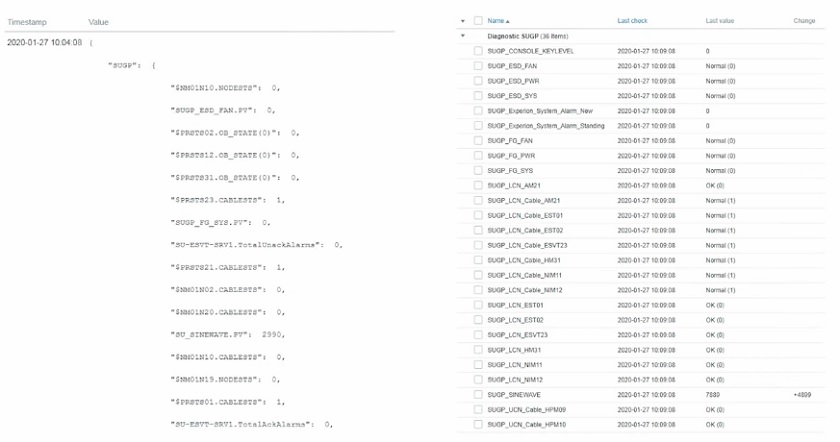
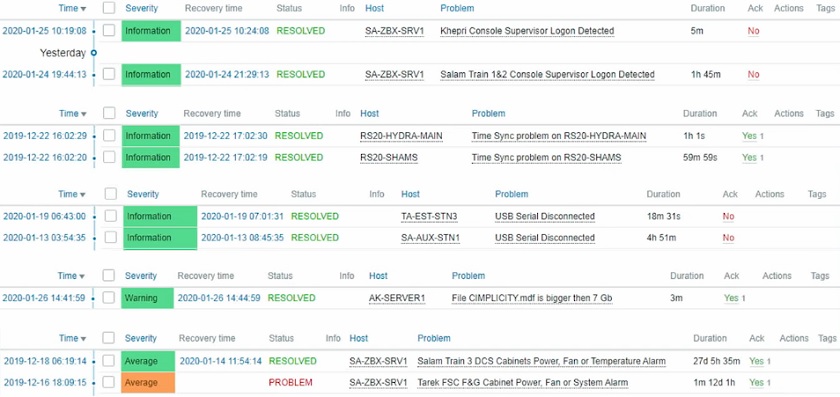
Once data is in Zabbix, we can create our own alarm hierarchy, which is not reliant on the vendor-specific structure. And here is an example of a predefined set of triggers that covers all devices on one site, so the operator doesn’t need to call maintenance personnel anymore.
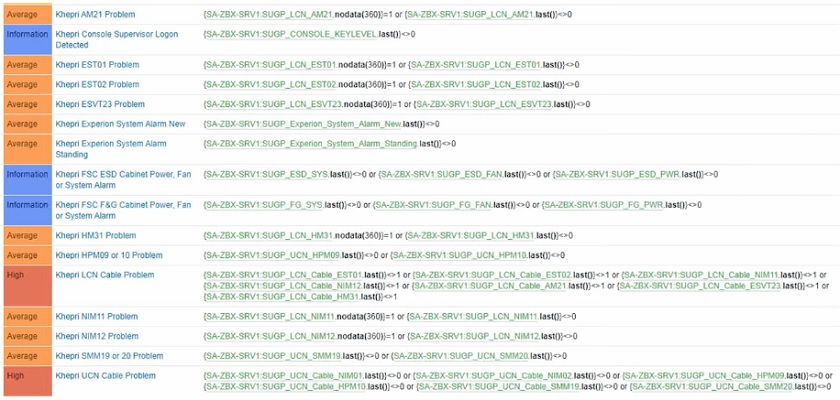 Alarm hierarchy
In the main dashboard, we have only the most important things — problems. And you may have the dashboard in the background thanks to an audible alarm.
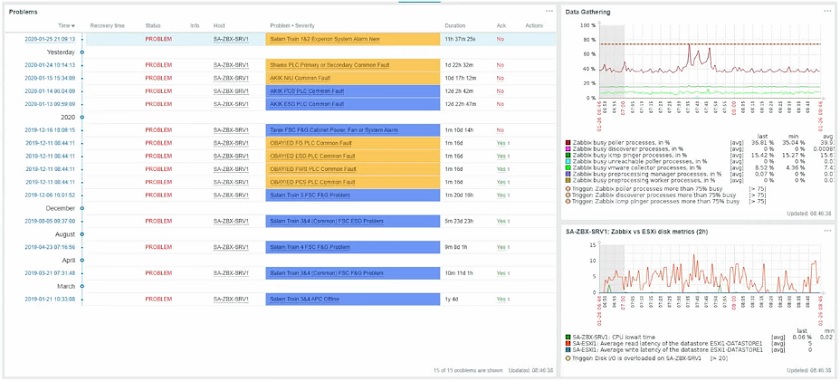 Main Zabbix dashboard
Support screens provide more details on, for instance, communication with remote sites.

Map support screen
Our control system is a mixture of PC-based components, special-purpose industrial controllers, and communication infrastructure.
We monitor standard things relying on simplified Zabbix default templates and on Zabbix manufacturer-specific templates for Dell, HP, etc.
 PC-based hardware
We use IPMI for server monitoring.
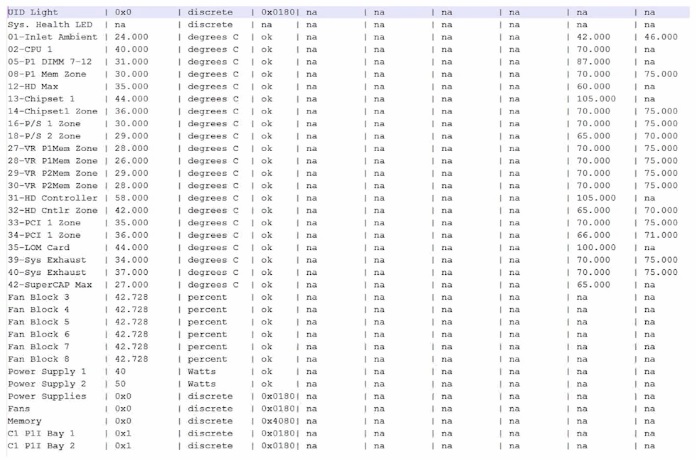 Pulling data in IPMI format
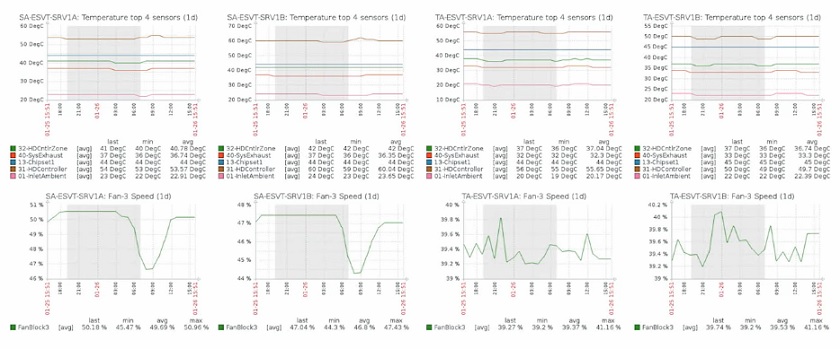
For all PC-based hardware, we monitor fan, temperature, power supply status, hard drive space, etc.
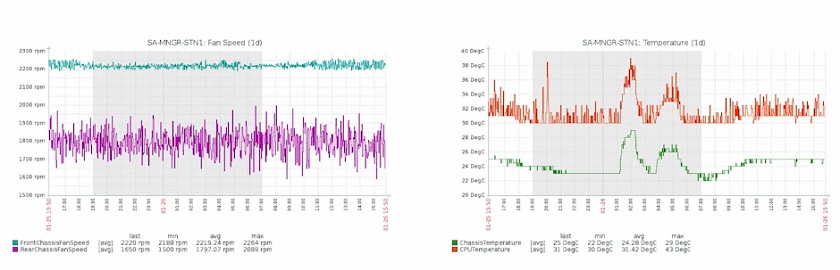 Monitoring different parameters
For stations, as they don’t support IPMI, we use Windows Management Infrastructure to collect specific metrics.
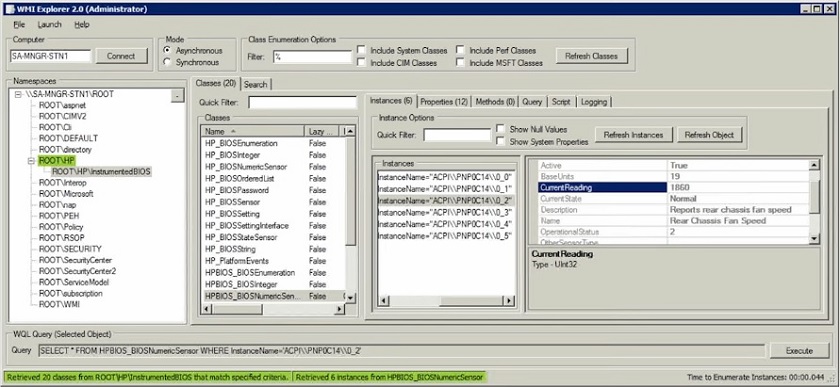
Windows management infrastructure
Here we’re monitoring a “non-paged pool” for each process. It’s not a generic services’ monitoring on the node, we look deeper into every process. Sometimes, when you apply a new patch from Microsoft or from another vendor, which works fine in the test environment, but then you have a memory leak in the production environment. Zabbix helps to catch such problems. Also, we need to monitor the execution state of Windows scheduled tasks.
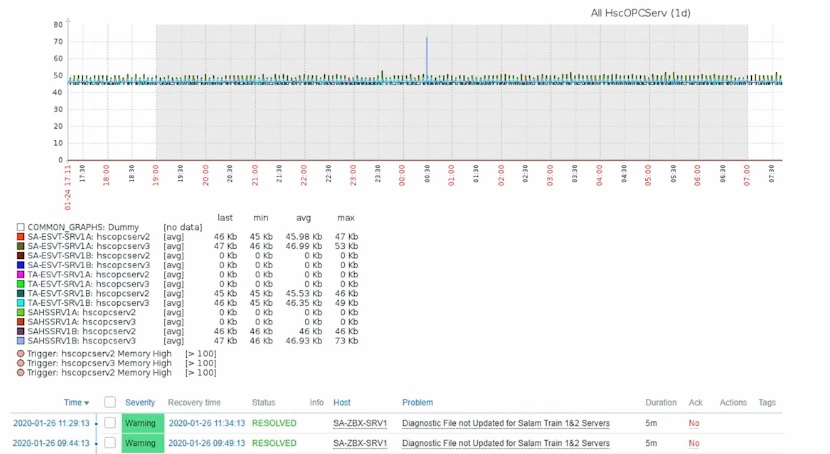 Monitoring process memory and scheduled task status
Every control system has a lot of devices like any other IT environment. In our case, we used Cisco devices’ standard monitoring: traffic counters, fan, temperature, spanning-tree change, port status, routing health, etc.
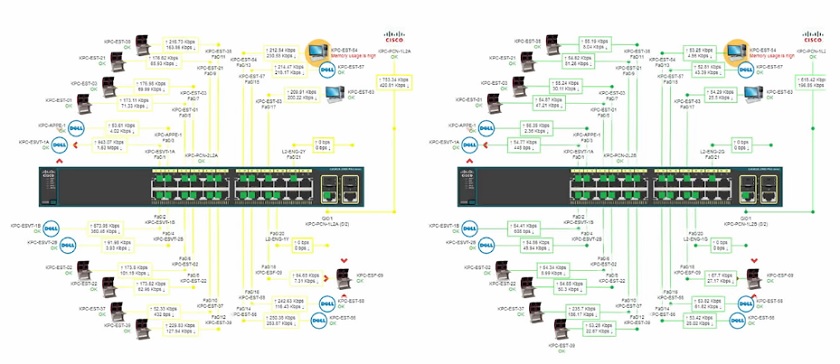 Communication equipment
Since we have more than one user with elevated privileges, we are tracking configuration changes.
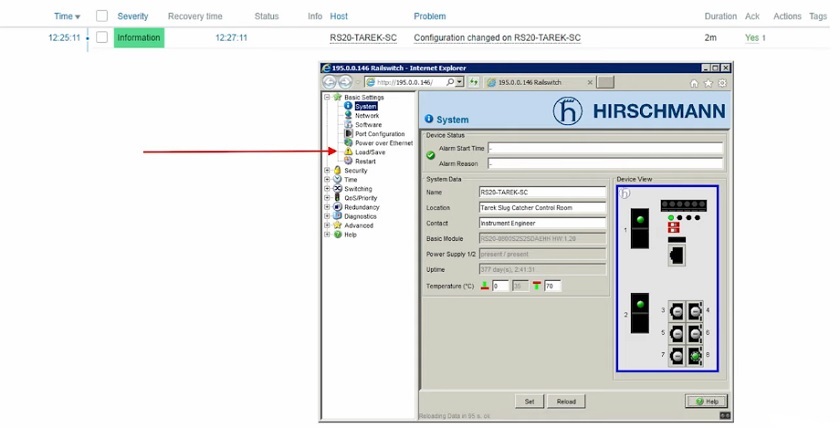
Unsaved configuration changes on the industrial switch
The Active Directory structure is simple (2 Domain Controllers) so we’re monitoring only the most important things. Zabbix initiates the replication report, checks how many servers are healthy and notifies of anything going wrong. For AD infrastructure reliable time source is very critical, thus we monitor synchronization with 2 NTP servers connected to GPS antenna.
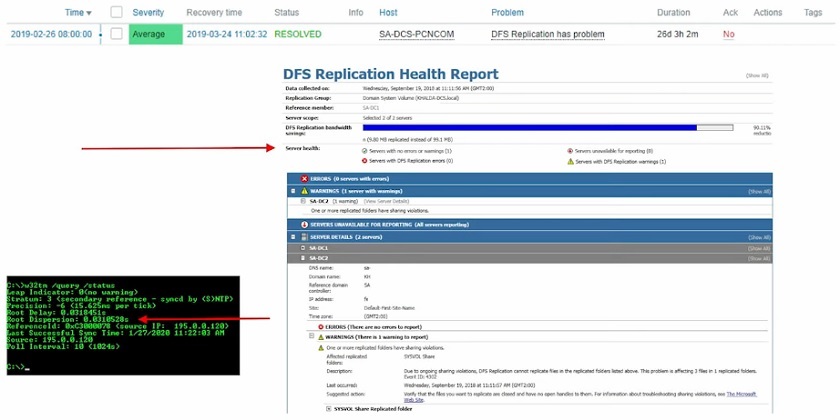 Replication health report in Zabbix
We only use custom LLD in our backup infrastructure, as once you have a predefined number of industrial automation devices, they are not changing very often.
 Low-level discovery in back-up infrastructure
Each new device is automatically discovered. If anything goes wrong, an error message is displayed.
![]() Error message
Error message
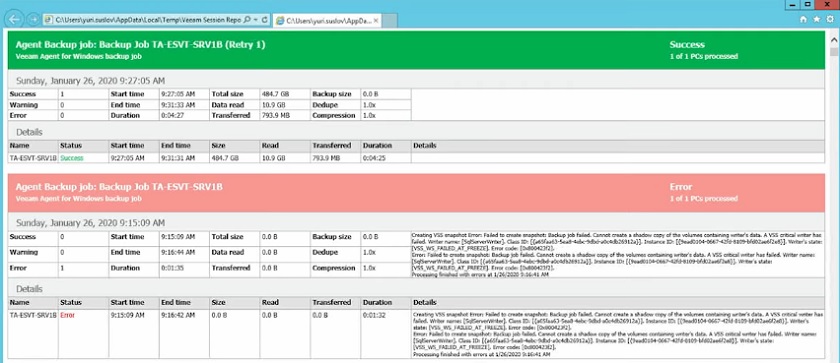 Error details
Overall system health.
 Real-life error example
In case of the error in the snapshot above, without Zabbix, I had to log on at least four different machines using remote desktop or VNC to find out the necessary information:
 Problem: power lost and restored on one gateway
 Problem: data transfer between sites
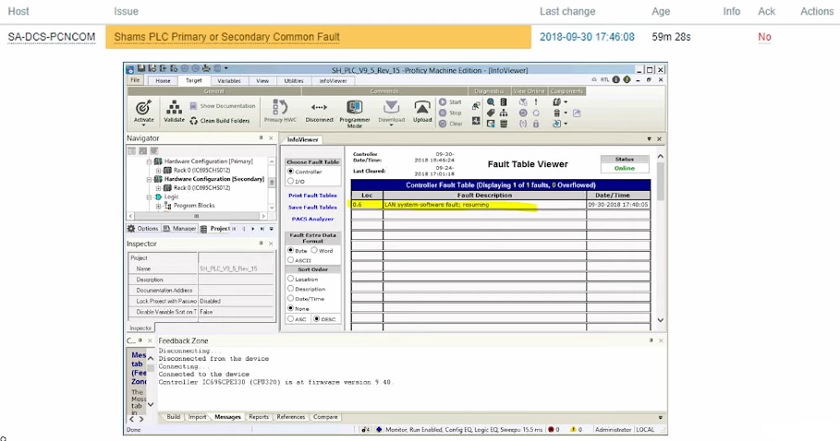
 Problem: unexpected change in server mastership
Without Zabbix, you have many screens at the same time. Thus, we decided to make a generic problem instead of creating a trigger for every single item, since you have to look the details up anyway.
 Generic problem in Zabbix
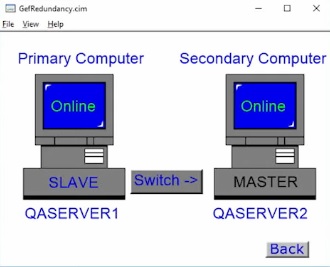
In the example below, we had a problem with redundancy.
 Redundancy problem
We have to report production data to the state authorities. Our facility is located in the desert, 500 kilometers from Cairo, and the only way of communication is a mobile network. Some GSM modems are so obsolete, they don’t support any diagnostic protocol.
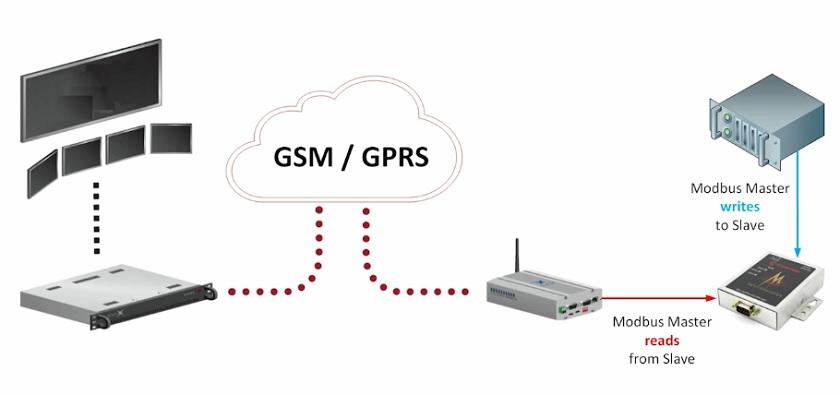
These network devices have only a built-in web-server. So, Zabbix runs an external script to get information from the web-page and identify communication frozen.
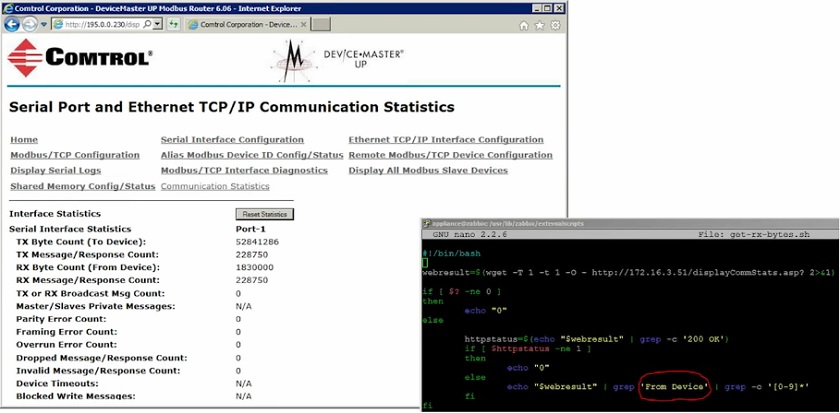 Zabbix retrieving data
More parameters to monitor:
- As operators have only basic privileges, we monitor any person with elevated privileges to log in.
- We’re collecting logs from different devices in a single place, so all of them must be in sync with main NTP server
- Serial ports are still heavily used in industrial automation but, as you know, modern computers don’t have those COM ports anymore. That’s why we use USB to serial converter, which is not always reliable, thus we have to monitor health of those adaptors.
- Some SCADA systems use SQL Express server and we have to watch after database size.
- We also have to monitor the status of power supplies, fans, and temperature for every cabinet at every site.
 Parameters monitored by Zabbix
We need to monitor the communication status of each oil and gas production well around each site, which is connected over Wi-Max (some kind of long-range Wi-Fi).
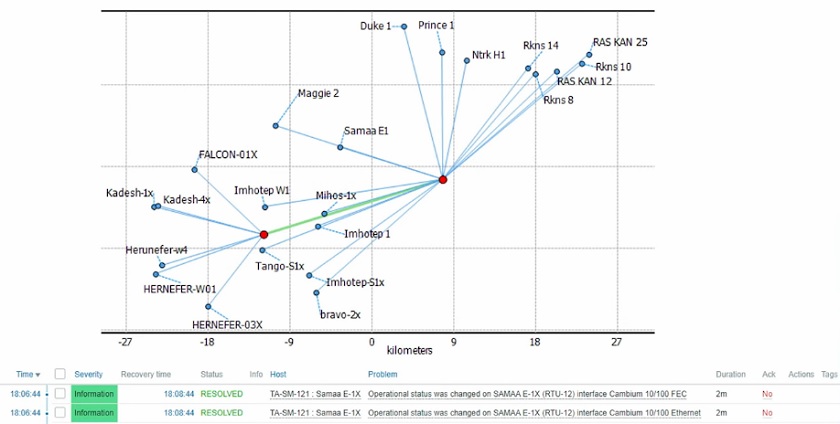
Oil and gas production wells network
These are no permanent power lines in the desert, so we rely on solar power charging during the day and discharging at nights. If the batteries are not sufficiently charged, this may cause production losses.
We also have to monitor daily temperatures outside and inside remote enclosures.
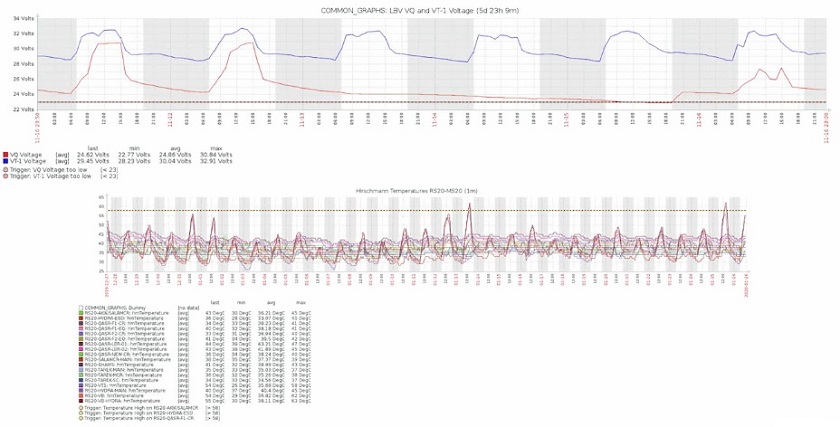 Remote line break valves
We use PowerShell script run on a daily basis to pull graphs over Zabbix API from all the sites and to consolidate them in one PDF report for our telecom department.
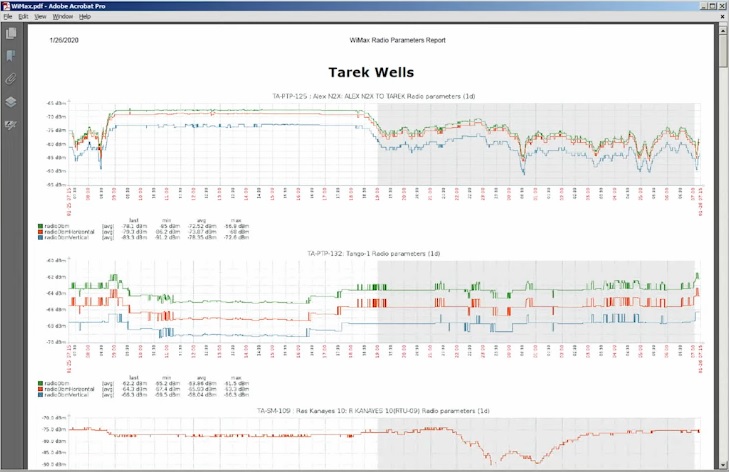 Daily email notification
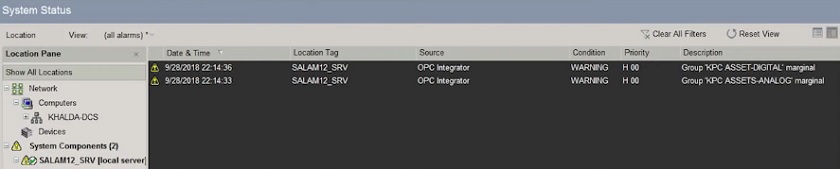
Zabbix is also watching after the Graylog server used by the alarm rationalization team.
Greylog dashboard used by alarm rationalization team
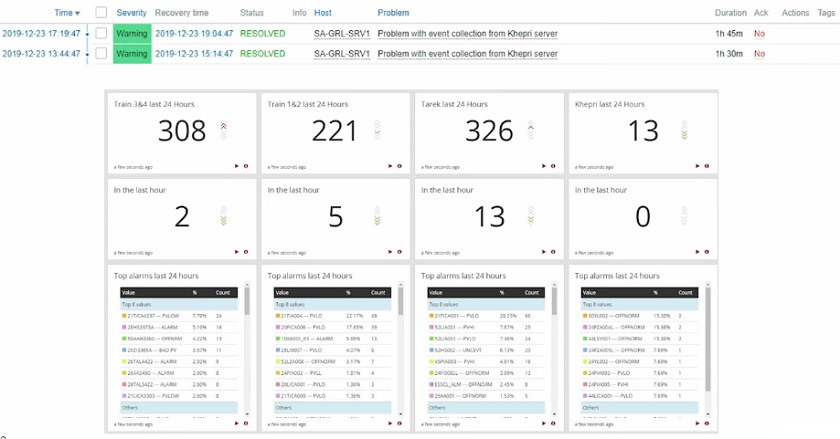
Zabbix monitors the database to verify how many events have been collected over the last two hours.

Zabbix collecting data
Conclusion
Zabbix acts as an umbrella over the top of your systems and provides an overall view of the control system at your fingertips. Zabbix is your choice if you have to monitor different sites, interact with devices and applications from different vendors and providers as Zabbix supports different ways of communication, and is customizable.
See also: presentation video and slides.


It would be very nice if such an excellent tool, Zabbix, has the ability to implement SCADA and HMI screens, so that the industrial site operators be able to see the full process status and measurements in it’s maps.