


In this article, I will try to cover the theoretical models on monitoring your vehicle fleet with minimal to no cost at all by using the ELM327 microcontroller, a python library to process the collected data and a Zabbix proxy running on a small Raspberry Pi device to store and sent the collected metrics to the central Zabbix server.
Table of Contents
Expanding the scope of our Zabbix instance
The first thing that comes to mind when someone mentions a monitoring system is pretty simple. People think about server monitoring, and with servers, we usually mean Linux and Windows systems and also network monitoring for all kinds of flavors of switches, routers, firewalls, etc. But by putting so much focus on these standard things, we are someway limiting the possibilities of monitoring systems. Zabbix has proven itself as an extremely powerful monitoring tool that can combine and monitor all client infrastructure – no matter if we are talking about the aforementioned servers, network devices, services, applications, or anything else. And most important – Zabbix is truly a 100% open-source product, which allows anyone to use all listed functionalities for free.
Please, keep in mind that no doubt there are systems available that are created exactly for the same purpose I will cover here. Maybe they are more reliable. Perhaps they require less effort to achieve the desired result. But that is the exact reason why the presented model is mostly theoretical, with the primary goal being to show that it is hard to put Zabbix in some functionality boundaries. Usually, the only limitation is our imagination. And it is up to you to treat this information for pure entertainment or try to implement it in a place where you find it suitable.
Monitoring a car fleet
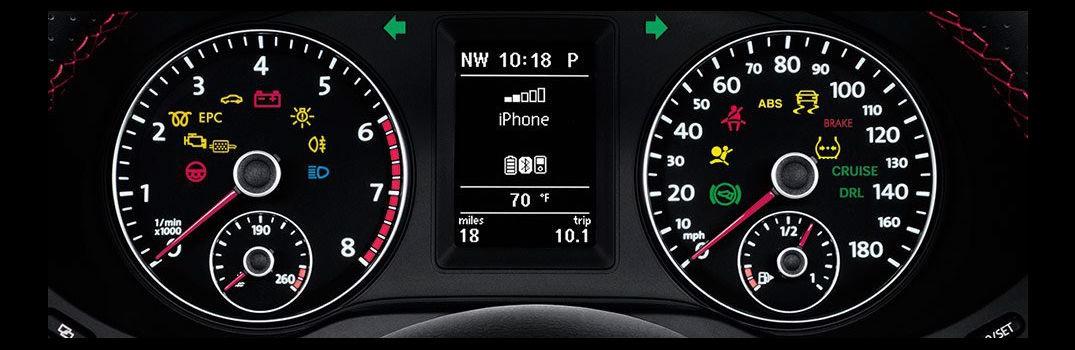
Let’s get straight to the point. You don’t need to own a huge logistics company with a thousand vehicle fleet to understand it. In simple words – if you or any of your relatives own a car, you should be aware that cars tend to break. Just like it usually happens, there could be many types of issues, starting with a flat tire and ending with some ongoing damage in the gearbox or engine. It is important to understand that vehicles themselves are becoming smarter. If in the past it was a purely mechanical device, then nowadays it is a highly complicated electronic system on top of that mechanical device that can diagnose the slightest deviations from accepted norms that are set by the manufacturer and inform about this malfunction either with an indicator light on your dash or simply with a log message that will be accessible only when read with specialized software or tools.
Keep in mind that malfunctions in vehicles are not as simple as boolean ( works or not ). In most cases, an issue is noticed before the car is not able to move forward, and the purpose of that is to be informed and fix the issue before it has turned into a defect that actually prevents the vehicle from functioning.
And now think about this from an automotive business perspective. We may be talking about hundreds of vehicles that are always on the move to deliver something or someone in time. It should be straightforward that in such a niche business, each of these vehicles should be able to traverse close to a thousand kilometers per day.
Thankfully, as mentioned previously, the smart diagnostic system will let you know about all the potential problems. On the other hand, the driver of the vehicle usually has nothing to do with its repairs or technical condition. So in a perfect world, we should have a few technical employees that would simply ask returning driver whether everything is fine with the car after his shift – are there any errors, and connect with diagnostic software to read its logs to make sure that everything actually is ok. If it’s not ok, information should be passed to the technical department to move this vehicle to the maintenance.
Why such pressure? Well, remember that most of these notifications serve as a warning that something is not working as it should, but currently, it is not causing harm. However, if it is ignored, there is a high chance that at some point, the vehicle will not be able to continue its way to the destination.

So this is where Zabbix joins the conversation. Imagine if all this data transfer from the vehicle diagnostic system to the responsible employees would happen automatically, with potential error prioritization and escalation to further levels if any vehicle has an ongoing issue that remains active for multiple days. And remember that Zabbix is a completely free and open-source system, which means that we could achieve this result for free. And we are absolutely not limited to DTC ( Diagnostic Trouble Codes ) readings. Combining this ecosystem with the recent Zabbix 6.0 LTS release, we can create a geomap with the current location of any vehicle from our fleet. With a little effort, we can also get speed measurements, long stops, starts, and much more.
This is the part when the tested but still theoretical model comes into action. By now, we are aware that a car is way smarter than it may look, and it gathers and stores a lot of useful information. However, the Zabbix monitoring system as per the most common standard sits somewhere in our headquarters and monitors generic metrics of our IT infrastructure. So how could we potentially get this information from our vehicle to Zabbix?

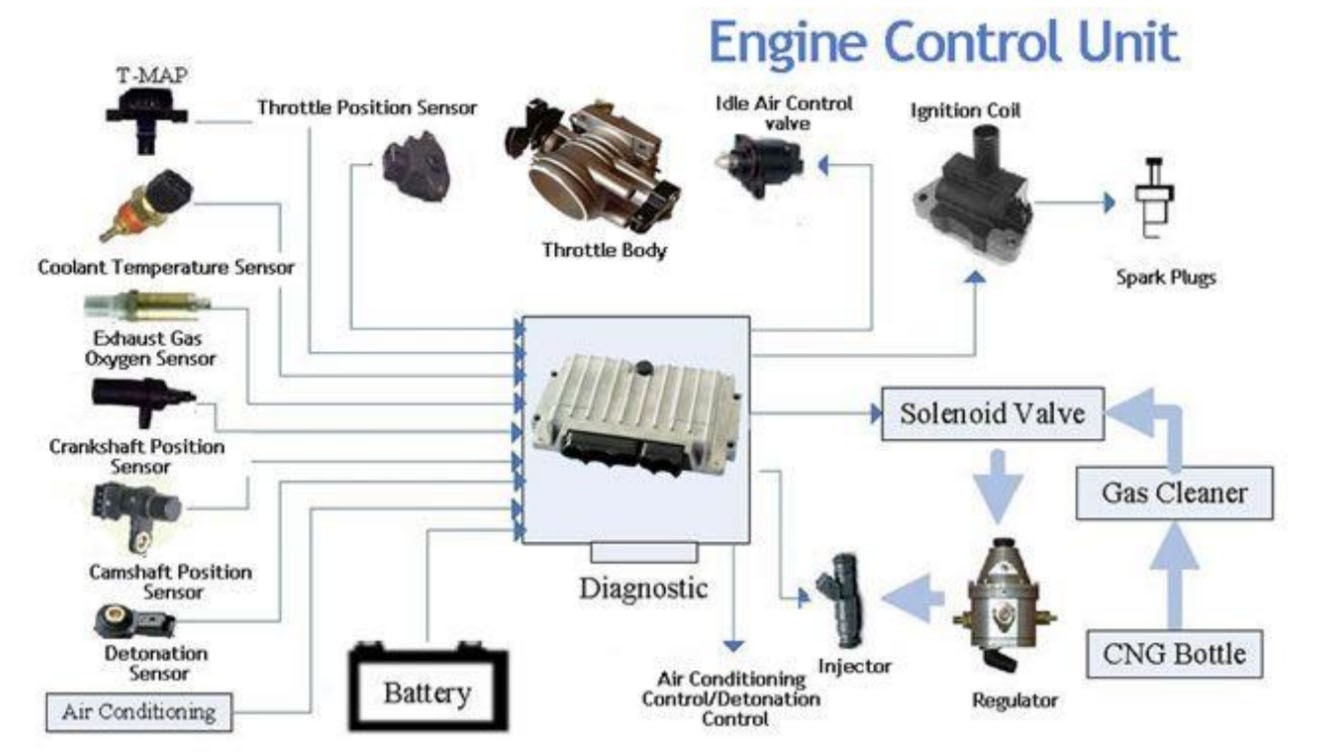
Since all information is stored in ECU (Electronic Control Unit), there is also a way to read it. And it is achieved through OBD (On-Board Diagnostic) socket through the standardized protocol. Just like anything else, OBD has multiple versions or protocols of communications. Still, if we are talking about seamlessly modern cars, most likely we are talking about OBD-II, which included Electronic signaling and messaging format.
Using ELM327 to gather data
precisely OBD-II will help us to gather all information from the vehicle, to further transfer it to our Zabbix monitoring system. Initially, this may yet sound very unclear because we have some kind of socket to access our ECU, but how can we actually gather some meaningful data? For that, we will need ELM327
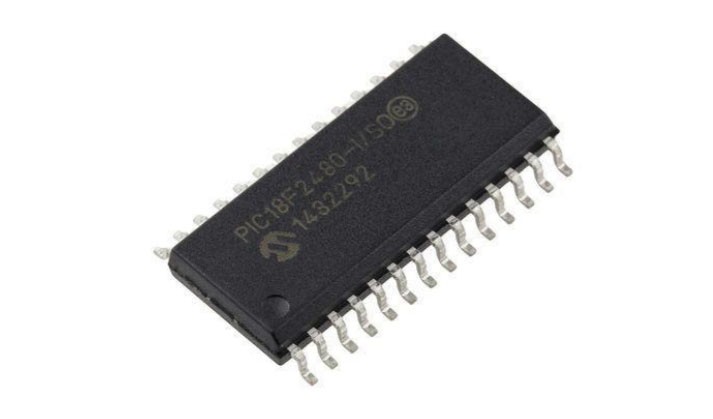
ELM327 is a programmed microcontroller produced by ELM Electronics for translating the OBD interface. Even today ELM327 command protocol is one of the most popular PC to OBD interface standards. Typically ELM abstracts the low-level protocol and presents a simple interface that can be called via UART, typically by a hand-held diagnostic tool or a computer program connected by USB, RS-232, Bluetooth, or WiFi. In our case, we don’t need and don’t have any dedicated diagnostic tool, so we will have to use something else to work with OBD-II and translate all incoming data. With the ELM-327, it is straightforward. You can purchase an ELM327 OBD2-Bluetooth adapter on Amazon for a couple of dollars, and it will be enough to provide the required functionality.
Data processing with Python-OBD and Raspberry Pi
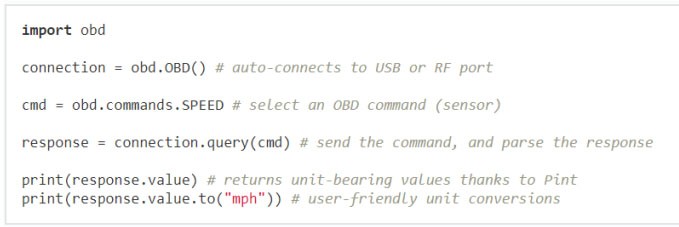
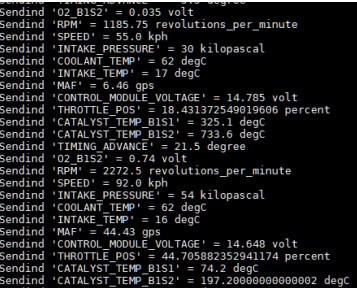
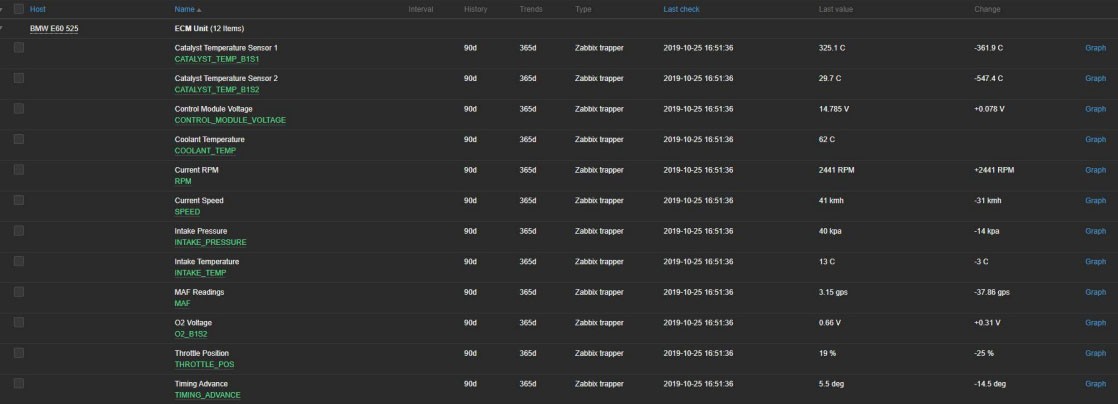
As it usually happens, for all things that we need, we can find a Python library published under GPLv2. And as you already noticed from the screenshot, we are not limited to stored DTC values. In addition to that, we are able to read live data from our vehicle, such as speed, fuel pressure, coolant temperature, intake temperature, and much more.

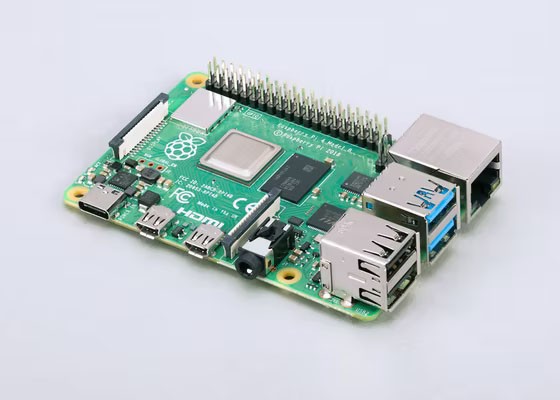
The closer we get to the result, the simpler the task starts to look. At this point, we basically have everything that we need. We have the data, and we have the interface from which to read it. ELM327 allows us to transport this data to our device, and the python library will enable us to translate and process this information, therefore allowing sending clean data to our Zabbix. The only open question is what device should we use in our vehicle, on which we could run our Python script, and which would have GSM access to transfer gathered data to the Zabbix server. In my example choice was as simple as cheap – Raspberry Pi.
And then it’s a matter of choice when you have Raspberry set up on a vehicle, connected via Bluetooth or any other way to your ELM327, that is plugged into an OBD-II connector. With Python script running on Pi device to receive and process data from our ECM, we need to decide what piece of software from Zabbix we want on this device.
Zabbix proxy for data storage
Considering that the car could be driving through different areas where internet coverage could not be the best, but we also don’t want to lose any data simply because there was no connection, I think it is best to install Zabbix proxy on Raspberry Pi.
Zabbix proxy perfectly suits such a small setup and helps us with its main purpose. Proxy has a local database that stores all information that has to be sent to our Zabbix server. If because of some networking trouble this data can’t be passed to our server, it will be kept in the local database for a moment when a network connection is restored and data is sent. Luckily for us, Zabbix has Official Packages for Raspberry Pi OS, so we don’t need to tailor any magic around it.
The functionality of the Zabbix proxy allows us to choose between two modes ( Active and Passive ), which basically allows us to choose the direction of communication. It might not be the cheapest approach to purchase a static IP address for each unit. Therefore we will be using Zabbix Proxy (Active), which simply will connect to our Zabbix server and send all gathered information. Of course, there are security measures for validation to make sure that only designated devices will be able to send data to a server. If an even more secure approach is required, users may choose to use TLS encryption with PSK or Certificates.
Collecting the current latitude and longitude
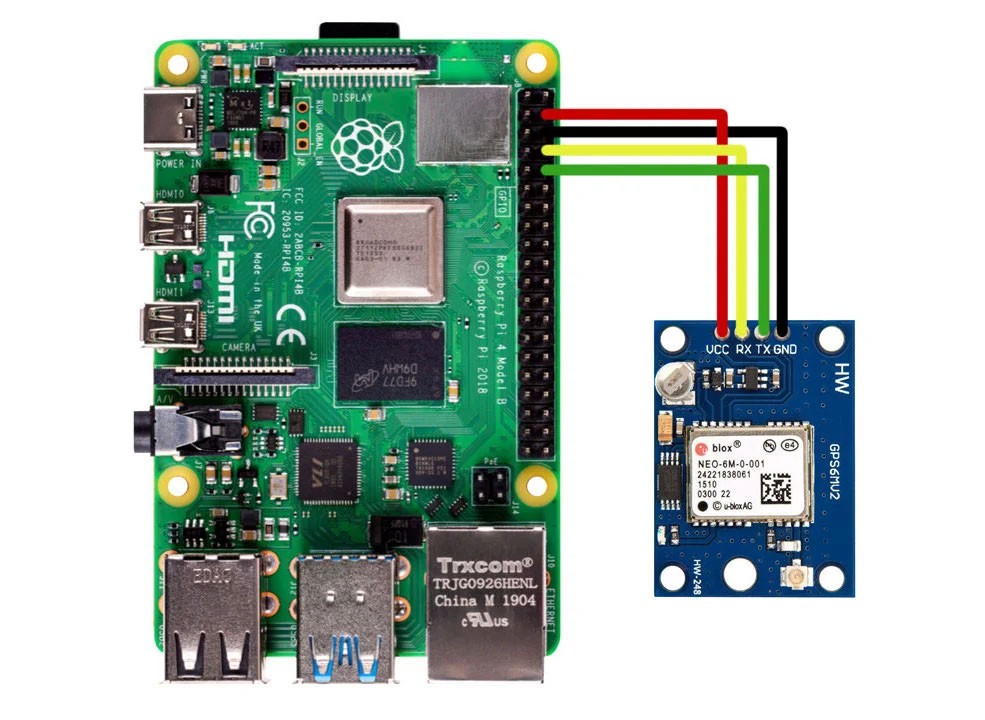
Previously I mentioned, that with the new Geomap widget, it is possible to achieve a live view of the current location from all your fleet on a single dashboard. To do that, we obviously need live latitude and longitude readings, which ECU and stock Raspberry Pi are not able to provide. But this is the beauty of Raspberry Pi. With minimal investments, we can purchase a GPS unit and combine it with our Pi.
With a very simplified Python script, we can gather all required data, and move it to our Zabbix proxy that is installed on localhost, which then will parse this information to our Zabbix Server that will allow us to see it in the dashboard. As this is not a very native and straightforward approach to monitoring, we won’t be able to use native item types to collect this data. This means that all the collection must be done within the script, and then we need to pass this data using the Zabbix-sender utility. The purpose of this utility is very simple, without any complications, take data that is provided and send it to a specified Hostname.
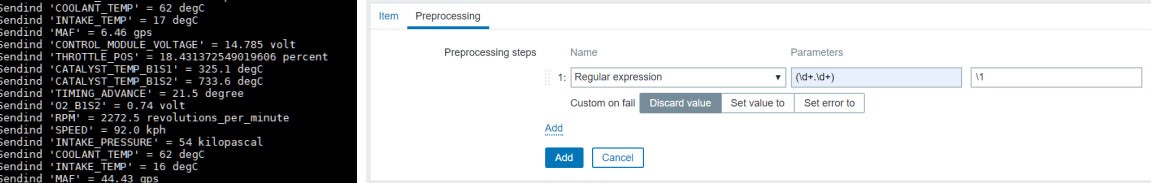
Since Zabbix has a very powerful preprocessing engine, we don’t have to make our script over-complicated with data transformation to meet guidelines for data visualization within Zabbix. We can send raw data, just like it is, and then use any suitable preprocessing step in the Zabbix frontend to extract the value we need to visualize.
The many uses of the collected data
When the data arrives in the Latest data in our Zabbix frontend, consider the most complicated part of this task is done. And just like before the idea of automotive monitoring with Zabbix, the only limitation is your imagination. You can simply collect this data without any actions. Monitor it on your own, from time to time, just to see if you can do anything meaningful with it.
You are also able to utilize a wide list of trigger functions within Zabbix to define that it is a problem when some particular value is received. For example, when some DTC appeared on a device, or let’s say, the average speed of the vehicle exceeds a threshold. Maybe you want to set some borders for coordinates, and if a particular vehicle gets outside of a specified radius, it could raise a problem in your monitoring system.
It is up to you how to react to these triggers. It could be just a flashing light on your Problems view within the Zabbix frontend. It could also automatically create incidents for your maintenance team with a message that a particular vehicle has worn out brake pads that has to be replaced. But maybe if these brake pads are not replaced for a full week since the first time it was noticed, you want to receive a personalized message on your mobile phone so that you can escalate this issue further.
No secret that there are flaws and downsides. As I mentioned right in beginning, there are software and devices that are developed and adopted exactly for this purpose, however, my approach may not be 100% reliable. Data transfer from ECU is not as live as reading CPU utilization from your computer. All of this is just a reminder that monitoring is not limited to network devices and servers. And Zabbix, which is growing every year, provides more and more features to its users while remaining absolutely free and open-source, is here to support all your ideas and help them come to life.


is the above case study has implemented anywhere ?
Hello. I have used the same script for this obd-ii and saved it to raspberry pi and then in the raspberry pi I install the libraries (obd), after I run the python script this error is coming out (Traceback (most recent call last):
File “/home/zabbix/obdIIcode.py”, line 7, in <module> zbx = ZabbixSender(“127.0.0.1”) TypeError: ‘module’ object is not callable). i have created zabbix server and the zabbix agent,proxy and the zabbix sender on my raspberry pi. Im strugling on the part to send data from the zabbix sender to the zabbix trapper (item:Axia).
Can you please explain to me how I can proceed?