


One of the questions for those of us that use Zabbix on a large scale is “Just how much data can Zabbix ingest before it blows up spectacularly?” Some of the work I’ve been doing lately revolves around that question. I have an extremely large environment (around 32000+ devices) that could potentially be monitored entirely by Zabbix in the future.
There is a thread in the Zabbix forums where some people have discussed ideas for large environments, but unfortunately, I have not been able to find a thorough list of ways to run large environments. I intend to show how I set up my environment to handle a large influx of data. To give an idea of what I’m talking about, here are some of my current environment stats:
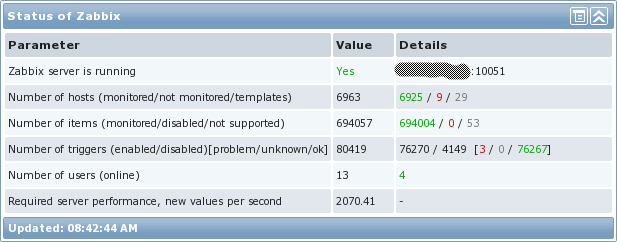
One thing that should be pointed out is what the “Required server performance…” number really means. It is not an indication of how much data is actually coming into Zabbix. It is a calculation that Zabbix makes by looking at all the intervals assigned to each item and then finding roughly how many values per second that equates to. Since Zabbix trapper items do not have an interval assigned, they are not part of that equation. In my particular environment, we use trapper items quite heavily, so here’s how many NVPS (new values per second) my environment really handles:
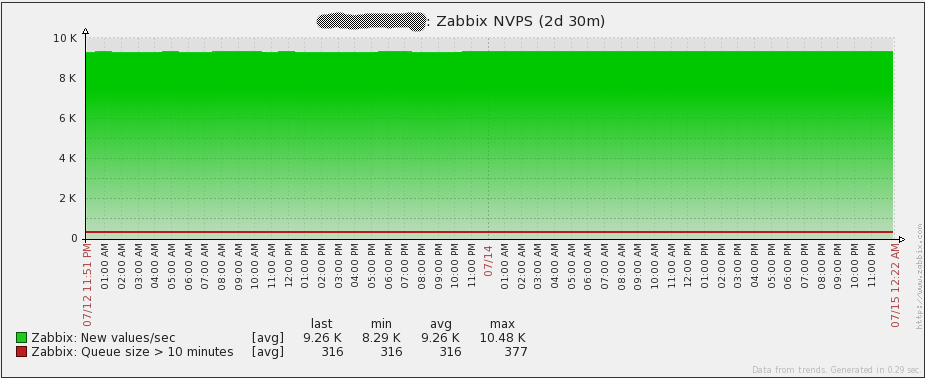
As shown in the graph, over a 2-day period, the Zabbix server handles around 9.26k NVPS on average. I’ve actually had short lived spikes all the way up to around 15k and the server handled them just fine as well. In short – awesome!
Architecture
One of the first questions to consider is the type of architecture to use. Should the Zabbix server be highly available? Does an hour or two of downtime matter? What are the consequences if the Zabbix database goes down? What type of disks will the Zabbix database require and what RAID level? What kind of network is there between the Zabbix server and the proxies? Is there a large amount of latency? How will data get into Zabbix – will data be pulled (passive monitoring) or pushed (active monitoring)?
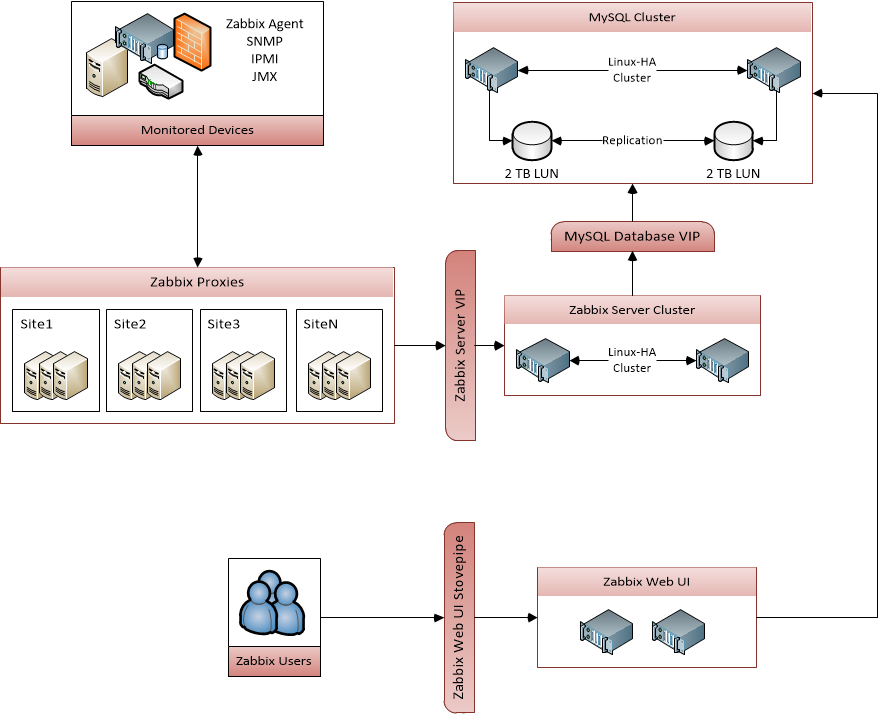
I’ll go into detail on how I approached each of these issues. I’ll be honest here – the thought of the network and the latency didn’t occur to me when I started building my Zabbix environment, but as you’ll see later, ignoring that can lead to problems whose root cause are difficult to nail down. Here is a diagram of the overall architecture that I used:
Hardware
Identifying the proper hardware to use can be difficult. You’ll find a list of what I am using at the bottom of this section. I opted for high performance SAN space for my database servers because the Zabbix database requires a lot of I/O. In theory, the faster the database disks, the more data Zabbix will be able to handle. Also, CPU and memory are important to a MySQL database. Lots of memory allows Zabbix to hold frequently accessed data in memory which in turn increases performance. Originally I wanted to get 64GB of RAM for the database server, but 32GB seems to work just fine so far.
My idea behind the fairly powerful Zabbix server was that it will be responsible for evaluating hundreds of thousands of triggers. That will take some CPU power, so it can’t hurt to have plenty available. Memory wise, I probably could have scaled down to 12GB since I do not have many processes running on the Zabbix server (it does very little monitoring itself).
My Zabbix proxies don’t require significant amounts of hardware, which is why I opted to use VMs. I mainly use active items, so the proxies are mostly serving as collection points and are not doing large quantities of data collection themselves.
| Zabbix server | Zabbix database |
|---|---|
| HP ProLiant BL460c Gen8 12x Intel Xeon E5-2630 16GB memory 128GB disk CentOS 6.2 x64 Zabbix 2.0.6 |
HP ProLiant BL460c Gen8 12x Intel Xeon E5-2630 32GB memory 2TB SAN-backed storage (4Gbps FC) CentOS 6.2 x64 MySQL 5.6.12 |
| Zabbix proxies | SAN |
|---|---|
| VMware Virtual Machine 4x vCPU 8GB memory 50GB disk CentOS 6.2 x64 Zabbix 2.0.6 MySQL 5.5.18 |
Hitachi Unified Storage VM 2x 2TB LUN Tiered storage (with 2TB SSD) |
Server High Availability
Now lets consider the architecture for the Zabbix server. Typically, in a large environment, downtime for a monitoring service can’t be tolerated for long periods of time (more than a few minutes). Due to the way that the Zabbix server process runs, it is not currently possible to run more than one instance of the Zabbix server. To work around that, I set up Linux-HA using Pacemaker and CMAN. As a base for getting stuff installed, take a look at the quickstart guide for RedHat 6.4. Unfortunately, the guide has changed since I last used it, but it should give you the same end result that I had as a base on which to put a custom configuration. There are four services that are managed with the HA stuff:
- Shared IP address
- In a failover event, this IP will be disassociated with the previous server and will be assigned to the newly active server
- This IP address will always be associated with the active server. The benefits of this are three-fold:
- It is easier to find which server is active
- All connections from the active Zabbix server come from the same IP (by setting the “SourceIP” configuration option in zabbix_server.conf)
- All proxies/agents can be configured to simply hit the shared IP address to get to the active Zabbix server
- Zabbix server process (zabbix_server)
- In a failover event, the zabbix_server process will be stopped on the previous server and will be started on the newly active server
- A symlink for crons
- This points to a directory that holds crons that should only be run on the active server. The crontab on each server should access all crons through this symlink.
- In a failover event, the symlink will be deleted on the previous server and will be created on the newly active server
- Cron process (crond)
- In a failover event, the crond daemon will be stopped on the previous server and started on the newly active server
An example configuration file and an LSB compatible Zabbix server init script to accomplish all of this is available for download here. A few parameters will need to be modified in the example pacemaker configuration file (enclosed within “<>” tags). Also, the init script is written with the idea that all Zabbix files are under a common location (for me, all files are under “/usr/local/zabbix”). You will need to modify the init script if that is not the case.
Database High Availability
A highly available Zabbix server process is not much use if the database can easily go down. There are many approaches to highly available MySQL – I will only cover the approach I took.
I use Linux-HA using Pacemaker and CMAN for my database as well. I found that it has some nifty functionality for managing MySQL replication. I use/used (see the “issues to resolve” section of this post) replication to maintain synchronization between my active and passive MySQL servers. See the section on Zabbix server HA above for the link to documentation on doing a base install of Linux-HA. Here’s the idea behind my database HA:
- Shared IP address
- In a failover event, this IP will be disassociated with the previous server and will be assigned to the newly active server
- This IP address will always be associated with the active server. The benefits of this are two-fold:
- It is easier to find which server is active
- If a failover event occurs, no changes have to be made on the Zabbix server to point to the newly active database machine
- Shared slave IP address
- This IP is meant to be used when read-only access is wanted to the Zabbix DB. This way, ad-hoc type things can hit the slave (if it’s up), instead of the master.
- This IP address could be on either the active or passive server. It entirely depends on a couple of things:
- If the passive server is online and MySQL it is not more than 60 seconds behind the active server, then this IP will be on the passive server
- If the passive server is offline or it is more than 60 seconds behind the active server, then this IP will be on the active server
- MySQL process (mysqld)
- In a failover event, the MySQL instance on the newly active server will become a MySQL master. Once the newly passive server is available, it will become a slave of the new master.
An example configuration file is available for download here. A few parameters will need to be modified in the example pacemaker configuration file (enclosed within “<>” tags). Also, for this to work properly, you may need to download a different MySQL resource agent for use with pacemaker. A link to that is found in some awesome documentation on setting up a MySQL master/slave cluster with pacemaker in the Percona github repository. In the event that the link to the documentation dies for some reason, there is a copy available here.
Zabbix Proxies
If you haven’t heard about Zabbix proxies, do yourself a favor and read up on them in the Zabbix documentation. They’re awesome. Proxies allow the Zabbix server to divvy out monitoring across multiple machines. The proxies are then responsible for sending all the data they collect to the Zabbix server. There are a couple of other things to know in regards to Zabbix proxies:
- They can handle an incredible amount of incoming data when set up correctly. During testing, I had a single proxy (“Proxy A”) taking in around 1500-1750 NVPS without any problems at all. And that was on a 2 vCPU and 4GB RAM virtual machine with a SQLite3 database! “Proxy A” was in the same datacenter as our Zabbix server, so the network latency was virtually non-existent. “Proxy A” was really busy pulling in all those metrics, but proxies with small amounts of network latency between them and the Zabbix server can handle large amounts of data. Note that “Proxy A” was an active proxy and most of the items it was monitoring were from active Zabbix agent items.
- Remember earlier how I said you need to know the network latency between the proxies and the Zabbix server? I promise I wasn’t kidding. I’ve found that the amount of data that a Zabbix proxy can ingest without falling behind on sending data to the Zabbix server is a function of network latency. I have an item that tracks how many values a proxy has left to send to the Zabbix server. Here’s what can happen if you ignore network latency:
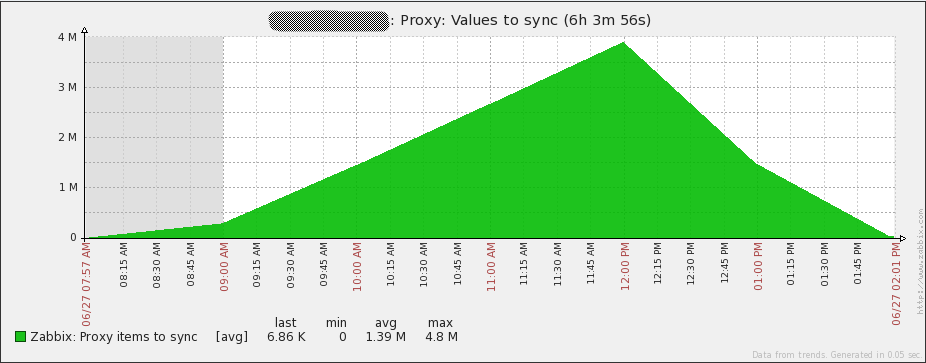
A proxy that cannot keep up I think that it is fairly obvious that the number of values a proxy needs to pass to the server should never keep going up. This was from a proxy (“Proxy B”) that was pulling in around 500 NVPS. Remember my previous testing where a single proxy in the same datacenter could handle 3-3.5 times that amount of data? That would be impossible from a proxy that has significant latency to the server. “Proxy B” resides in Singapore, but the Zabbix server is in North America. The network latency between “Proxy B” and the Zabbix server is around 230ms. Due to the method that proxies use to send data to the server, network latency has a dramatic effect. In this case, “Proxy B” could only send 1000 collected values to the Zabbix server every 2-3 seconds. From what I’ve been able to tell, here’s what happens in an attempt to send data to the server:
- The proxy initiates a connection to the server.
- The proxy sends a maximum of 1000 values.
- The proxy closes the connection.
All of these steps are performed as many times as needed. With high amounts of latency, this is slow because of two main issues:
- The initial connection is slow. In my case, to set up the initial connection takes at least 0.25 seconds. Ouch!
- Since the connection is closed after sending 1000 values, the TCP connection never exists long enough to speed up to the bandwidth available on the link.
To give you an idea of just how slow this is, “Proxy A” had the same virtual hardware and was able to send 40,000 values within 2-3 seconds. Much better!
Database Performance
Since Zabbix uses a database for storing all data, database performance is absolutely critical for a scalable solution. Obviously, since so much data is written to the database server, I/O performance is one of the easiest bottlenecks to hit. I am lucky enough to have a SAN with Solid State Drives, but just because I have fast I/O doesn’t mean my environment is immune from DB issues! Here’s an example:
- When I first started exploring the use of Zabbix in our large environment, I was running MySQL 5.5.18. The database ran just fine for a while, but once I hit around 700-750 NVPS, the MySQL process on my server would start using 100% CPU and the database performance ground to a halt. I tried playing around with configuration settings in MySQL, enabling large pages, partitioning tables, and tweaking various Zabbix settings, but none of that seemed to work at all. My much-smarter-than-I wife suggested upgrading MySQL to 5.6 to see what happened. Amazingly, the database performance was perfect after the upgrade. I never was able to get 5.5.18 to work, but 5.6.12 works great in my current environment. For reference, here’s a copy of my my.cnf file.
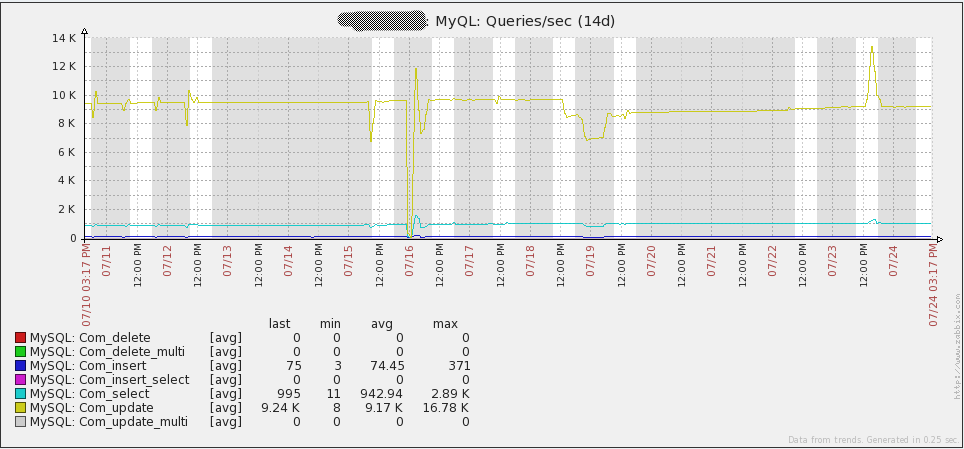
The graph below shows the number of queries running every second in my environment:
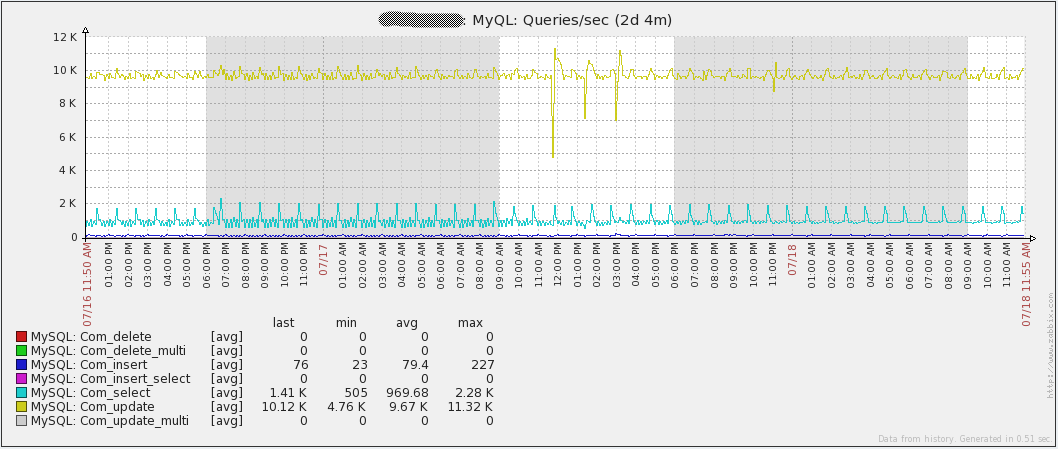
Notice that “Com_update” has the highest number of queries per second. The reason for this is that every value retrieved by Zabbix results in an update to the “items” table in the database. The other thing to point out with this is that the database is write-heavy. This means that the MySQL Query Cache will not help performance. In fact, it could cause a performance decrease due to the constant need to mark stored queries as invalid as data is modified.
Another thing that can destroy the database performance in large environments is the Zabbix Housekeeper. It is highly suggested to disable the housekeeper in large environments. That can be done by changing the “DisableHousekeeping” configuration value in “zabbix_server.conf” to “1”. Of course, without the housekeeper enabled, no history/events/action data will ever be deleted. One of the ways around that limitation is to enable partitioning on your database. In my case, this is in MySQL. One of the limitations of MySQL 5.6.12 is that partitions cannot be used on tables that have Foreign Keys. Unfortunately, Foreign Keys are used heavily in Zabbix 2.0.x, but the history tables don’t have any. Partitioning the history tables yields two benefits:
- All history data in a table for a particular day/week/month/whatever can be self-contained in its own partition. This allows easy deletion of old data later on with almost no impact on the database server and it makes it easy to see just how much data is pulled into the environment for whatever timeframe your partitions are set.
- With MySQL InnoDB tables, deleting data does not release disk space. It simply creates areas in the InnoDB namespace that can later hold new data. It is impossible to shrink an InnoDB namespace, however, partitions can be deleted at will. Deleting partitions will cause disk space to be freed.
To poll or not to poll…
Zabbix provides two different methods for retrieving data: active or passive. If you’re not clear on what the difference is, think of it like this – the Zabbix server/proxies pull data from agents for passive items and Zabbix agents push data to the Zabbix server/proxies for active items. By definition, Zabbix trapper items are active because they require data to be sent to the Zabbix server/proxy (using “zabbix_sender” or some other method).
The reason I bring this all up is because the type of monitoring used can have a drastic effect on how much data Zabbix will successfully be able to ingest. Passive monitoring requires polling processes on a Zabbix server/proxy to make a request to an agent and then wait for a response. Depending on your network and the performance of the server being monitoring, the poller may have to wait for a few seconds to get a response. Multiply that across even just a thousand servers, and polling can turn into a very slow process.
Now let’s talk about active monitoring. With active monitoring, the Zabbix server/proxies simply wait for a connection from an agent to be made. Each individual agent will periodically connect to the Zabbix server/proxy to get a list of items that it should be monitoring. The agent will then monitor each item according to its interval and then send the results as needed. A connection will only be made to a server/proxy once an agent actually has data to send. This method of monitoring prevents the Zabbix server/proxies from needing to wait for a check to complete before getting the data. This increases the speed at which data is retrieved. In my environment, this is the method that is used.
Server/Proxy Monitoring
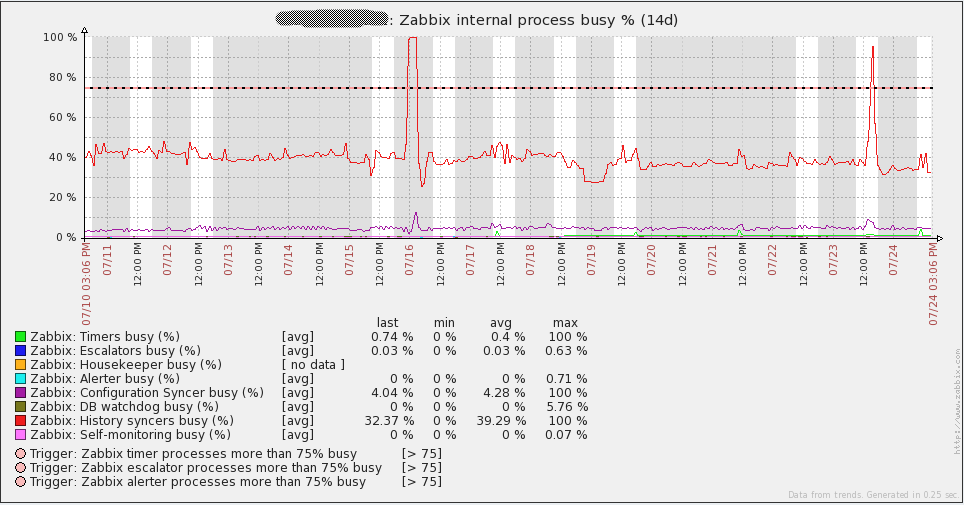
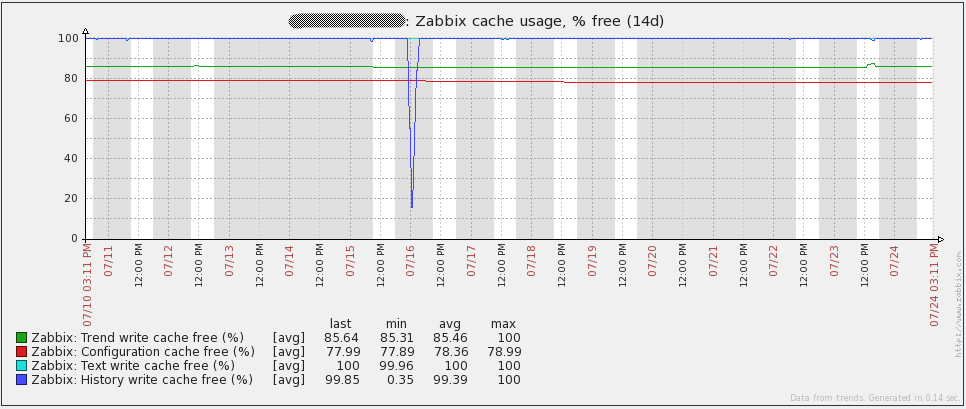
I’ll just say this straight out – if you think that you will be able to make a decent installation of Zabbix without monitoring the internal server processes – you’re full of it. You must monitor these processes to get an idea of where any bottlenecks are or even to identify processes that you can scale back to save resources. The documentation on these items can be found here. A good blogpost on these items is on the Zabbix blog as well. The default Zabbix server template that comes with Zabbix 2.0.x has these items already configured. Make sure you add these items to your Zabbix server!
One of the statistics that can indicate database problems is the free space in History Write Cache (the “HistoryCacheSize” variable in the server config file). The value from this item should always be close to 100%. If this cache continually becomes full, it can mean that Zabbix cannot write incoming data to the database quickly enough.
Unfortunately, proxies do not support these items. This makes it a bit harder to identify where problems are. The other issue with proxies is that there is nothing built into Zabbix to track how many values the proxy has left to sync to the server. Thankfully, there is a way to monitor how far behind the proxy is. All that is necessary is to run a query against the proxy database:
SELECT ((SELECT MAX(proxy_history.id) FROM proxy_history)-nextid) FROM ids WHERE field_name='history_lastid'
That query will return the number of values that the proxy still needs to send to the Zabbix server. If you happen to be using SQLite3 as the database for the proxy, just add this command as a UserParameter in your agent configuration file on the proxy:
UserParameter=zabbix.proxy.items.sync.remaining,/usr/bin/sqlite3 /path/to/the/sqlite/database "SELECT ((SELECT MAX(proxy_history.id) FROM proxy_history)-nextid) FROM ids WHERE field_name='history_lastid'" 2>&1
Set a trigger to watch for when your proxy starts getting backed up and you’ll be able to catch slow proxies. Here’s an example:
{Hostname:zabbix.proxy.items.sync.remaining.min(10m)}>100000
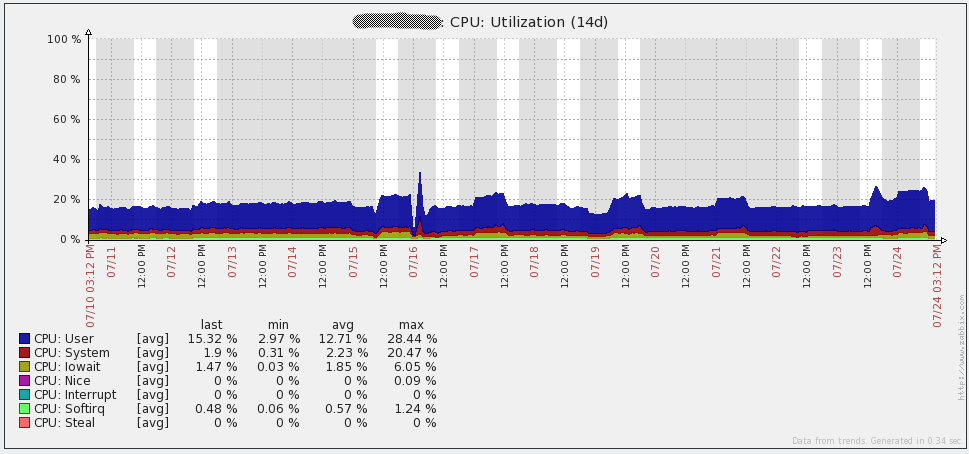
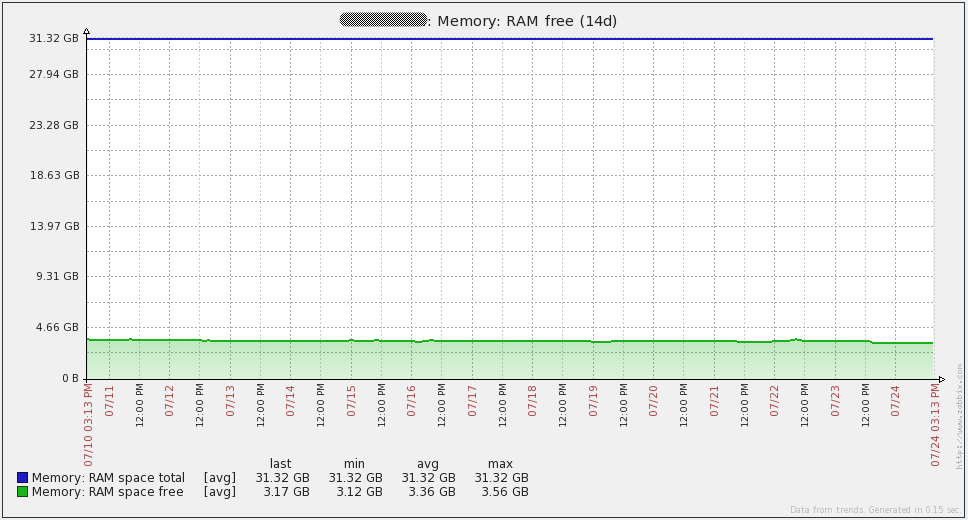
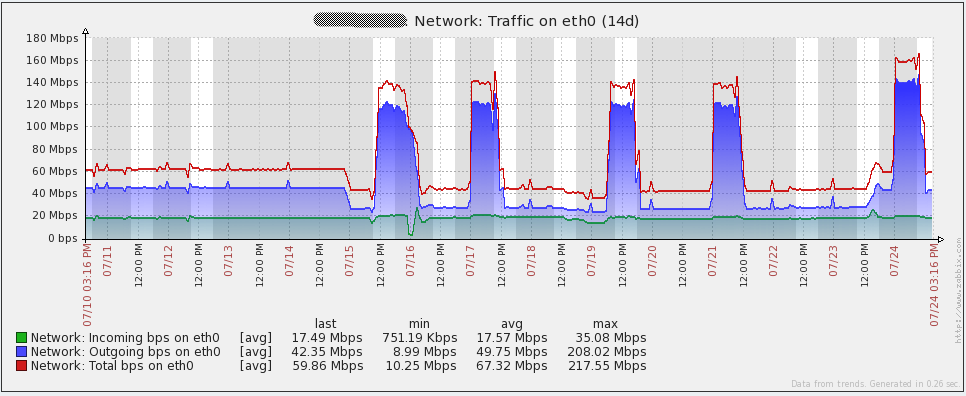
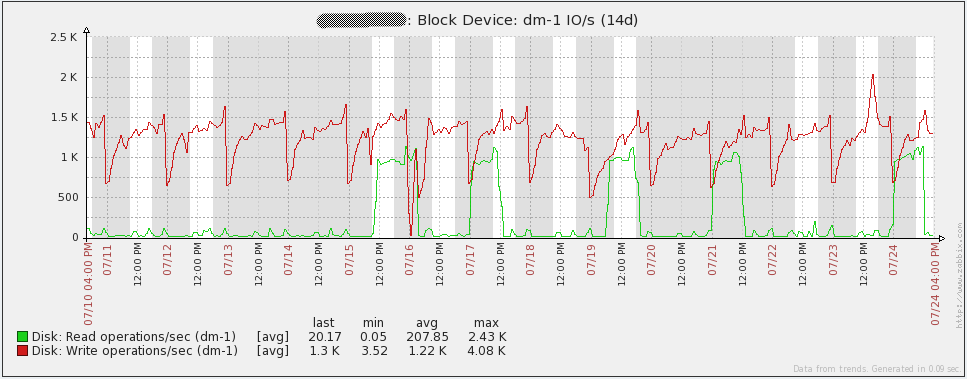
Overall Performance results
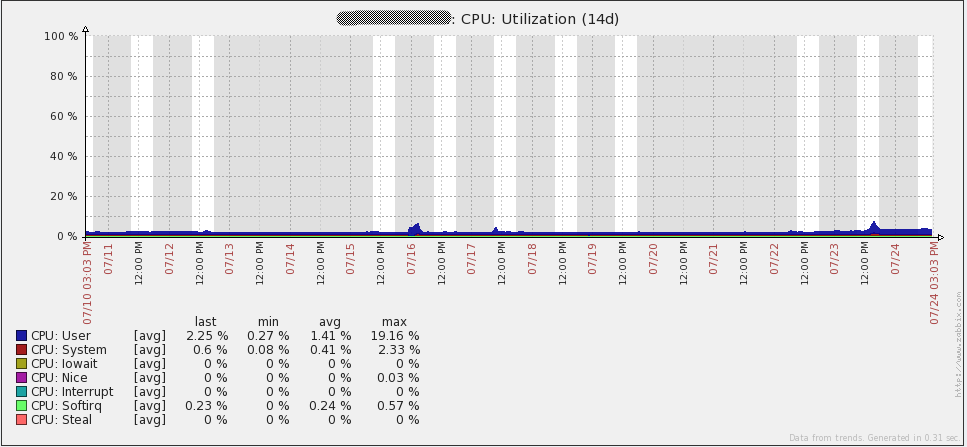
Here are some performance graphs for my server. You’ll notice some spikes/dips on July 16th. I’m not sure what happened in that event. I had to re-initialize the database on all my proxies to resolve the issue (I was using SQLite3 at the time). I have since migrated to using MySQL databases on my proxies and I have not seen the issue again. Other spikes in the graphs are from load testing. From looking at these graphs, it is easy to see that the hardware I’m using could be overkill for some time to come.
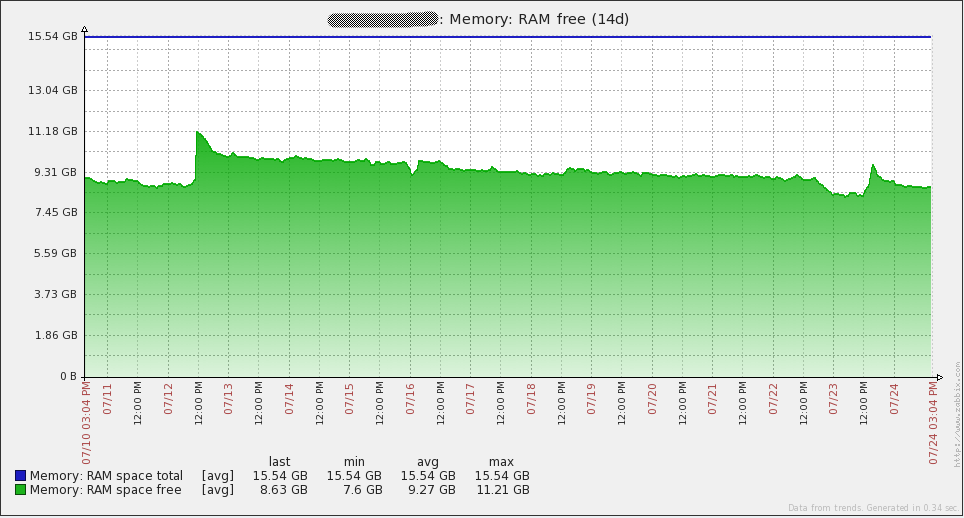
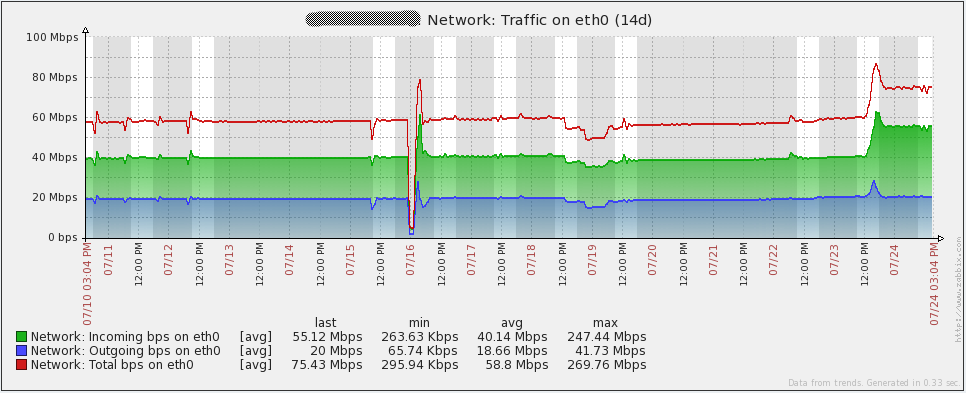

Here are some performance graphs for my database server. You’ll notice some large increases in network traffic every day or two. Those are when my database backups run (mysqldump). You’ll also see a large dip in the queries per second graph on the 16th due to the issue I mentioned above.
Configuration Management
In total, my current environment has 2 Zabbix servers, 2 MySQL servers, 16 Zabbix proxies, and thousands of Zabbix agents. With that many servers to manage, manually making changes to configuration files is not really an option. My company currently uses Puppet to deploy applications, but it is not currently set up for configuration management. As a result of this, I had to come up with my own way to manage configuration files across development, staging, and production environments.
Thankfully, I have access to a Git repository where I can store all my configuration files. All of my servers have access to that repository, so I took advantage of it to store any scripts, configuration files, or anything else that I want to synchronize across all servers. I wrote a script that can be called through a custom User Parameter available on all of the agents. When I call the custom script, it automatically goes out to the Git repository, pulls down all the latest files, and then restarts the agent/proxy/server if the configuration files had changes. In this way, rolling out changes to my entire environment is as easy as using the “zabbix_get” command.
Along with managing configuration files, creating thousands of hosts manually in Zabbix is not viable. My company has a CMDB where information about all our servers and the services that run on them is stored. Every hour I have another script that pulls information from the CMDB and then compares it to whatever is in Zabbix. It will then Add/Delete/Enable/Disable hosts as needed, create hostgroups, move hosts into hostgroups, and assign hosts to templates. In this manner, the only part of adding a host that I need to be involved in is if a new item/trigger needs to be implemented.
Unfortunately, due to them being so tightly integrated with our systems, I cannot post the scripts here.
Issues to Resolve
Even with all the work I’ve put into this there is still one major issue to resolve.
- Once I hit the 8000-9000 NVPS mark, my database replication slave was no longer able to keep up with the master. Effectively, this makes HA not exist at all for my database. I have some ideas on what to do for HA at this point, but have not had time to test/implement any of them. Here are a few of my ideas:
- Use Linux-HA with DRBD for my database partition
- Set up LUN replication on the SAN to replicate all changes to another LUN
- Look into Percona XtraDB cluster. A 5.6 version hasn’t been released yet, so I’d have to wait to try out this option (since I had performance problems with MySQL 5.5).
References
Here’s the list of downloads/URLs I reference all over in this post.
- Zip file with all downloads from the article (also includes my Zabbix configuration files)
- Large environment forum thread
- Zabbix server configuration documentation
- Zabbix proxy distributed monitoring documentation
- Zabbix active/passive item documentation
- Zabbix internal item documentation
- Zabbix blogpost on internal items
- Pacemaker/CMAN quickstart guide
- MySQL Pacemaker configuration guide
- MySQL Large Pages
- Partitioning the Zabbix database
Also in Russian: эта статья доступна и на русском языке.


Hi,
Beautifull article! I’m waiting for file inside:
for proxy: /usr/local/zabbix/etc/proxy.conf.d/
for agent: /usr/local/zabbix/etc/agent.conf.d/
I’m looking also for autoupdate script… Is similar to script provided by zabbixzone? http://zabbixzone.com/zabbix/easy-update-on-custom-scripts/
I’m searching for a way to restart agent after update (also on windows server)
Thanks!
I actually don’t have any files in “/usr/local/zabbix/etc/proxy.conf.d/” and the only files in “/usr/local/zabbix/etc/agent.conf.d/” are custom userparameters, so nothing special. As for the auto-update script, I can’t post it here. It is tightly integrated with my company’s systems and would require significant work to make it available to the public. My script is quite different from the one on zabbixzone.com. I don’t use the system.run[] key at all.
To do the restart after the update in my script, I use “screen” to run the command “/etc/init.d/zabbix-agentd restart”. Unfortunately, that wouldn’t work on windows servers. I don’t have any windows servers, so I haven’t had to do any work on those.
Hi,
Thanks for the article ! Very useful !!!
I have some questions :
Any reason that you don’t using Zabbix discovery and action to add new host and assign it to relevant template ?
How do you verify that all monitors are running (you have 53 items not supported) ?
How many active alerts do you have ? Which dashboard/console are you/NOC using to see the alerts ?
Did you create IT Services ? if yes, how you modify it once you add new servers ?
Thanks a lot !
I don’t use discovery because my hosts are scattered across dozens of subnets. Discovery would be very difficult to manage in my network (especially since I currently only monitor a very small portion of our devices). Our security team also wouldn’t particularly enjoy having Zabbix do port scans across huge swaths of the network :). Also, not using Discovery makes it easier for me to control exactly which devices on our network get added to Zabbix.
The only decent way to know when items are “Not Supported” in Zabbix 2.0.x is to have triggers using the nodata() function. That’s how I check items I expect could go to an unsupported state.
Our impletmentation of Zabbix is still ongoing, so there aren’t many active alerts. Our NOC uses a custom internal dashboard (not Zabbix) to view active alerts. Zabbix will have a script that submits triggers to that custom system via an API.
No, I have not created IT services.
Hi, Corey!
Nice article and great solution for big networks.
Can you give me more information about your CMDB (which software do you use) and how to make import hosts from this system into zabbix.
The CMDB that I use was developed internally by my company. Due to that I can’t really give details on how it works other than say that it stores information about all of our servers including the services that run on them, IP/DNS addresses, and their status (online, production, etc.). The scripts I use to automate adding hosts are closely tied to the CMDB, so it isn’t possible for me to make the scripts available either.
Could you possibly revisit this? I’m running Percona XtraDB Cluster 5.6, but I can hardly pass 300nvps let alone 9000. As a side note though, I do SNMP polling and both Zabbix and Percona are on the same server. There doesn’t seem to be any hardware limitations though, it seems to be a database connections issue.
yuusou, there are many different things that can cause the issue you’re experiencing. I highly suggest getting on #zabbix on freenode to work through your issue. I’m “heaje” on there.
Hi Corey Shaw,
My name is Sheun and am so glad you publish this article. It is indeed helpful, I will need to deploy such an Architecture for my office. We currently deploy Zabbix on a default basis and our NVPS is about 102 and now giving fault (Zabbix Server Down). It will only come up after taking out some monitored device which in turn reduces the NVPS.
I will like to have you support has I deploy and I can be reach on [email protected] for further discussion.
Thanks
seunds1 – I’d suggest reading over https://www.zabbix.org/wiki/Getting_help and using one of the available options there. Specifically, the IRC channel on freenode is an excellent place to get support.
I have a single server install that performs great.
Required server performance, new values per second 15351.67
I second the use of proxies if you are looking for performance. I have 5 proxies in total 4 pretty evenly distributed and 1 with only a handful (location based).
I use MySql 5.5.8-1 InnoDB, table partitions history (daily) and trends (weekly)
The other real difference maker is dedicated disks. 4 disks setup in RAID 10 separated from the OS (2 disk Raid 1). Currently getting 15k+ NVPS (And I have trapper items outside of this also).
I also have another 4 disks in RAID10. I had the items table and DB Log on here while the history and trends on the other 4. Works amazingly performance wise, but getting MySql to work with the links if I had to do any DB maintenance was more pain than I bargained for, so they currently are unused.
Another thing I do not have a lot of users accessing my GUI. I generate alerts into another system which keeps my DB writing like mad, without a lot of user driven reads.
–
Any chance you could share the item keys for proxy NVPS and values to sync?
Derp, nevermind, I just found it in the article.
Can I ask how long did it take you to setup all the items, triggers, actions for your environment? Did you use scripts to automate the trigger creations? Our biggest concern using Zabbix is the amount of work that is involved in maintaining all the items and triggers for such a large number of devices.
Little bit of a necro reply but this is the first result on google when you start digging into Zabbix performance ;).
I roll Zabbix at my company and I can say trigger maintenance is a breeze. We have a smaller set up than this but with a much much higher item/trigger density per host than what’s shown in this article.
Zabbix’s templates have an inheritance concept for tuning triggers. Even after applying a template, you only have to change it in one spot. the same is true for discovered triggers/items.
We have Zabbix to the point with puppet that we don’t even add or configure a host when we spin one up in AWS or on-prem. we used to use discovery rules (which worked great but there are some edge cases) but later opted to write our own API based discovery script. It configures the host info, what templates to use, and host groups.
Most of our time isn’t spent tuning or maintaining triggers. There’s always going to be some trigger tuning as you add new templates but that’s true of all monitoring platforms. We spend most of our time creating new items for developers so they can better understand their application.