One of the most technically experienced Zabbix trainers – Dmitry Lamberts reveals his five important improvements that were included in Zabbix 5.0 LTS release. Read the recap from Zabbix Online Meetup in English where Dmitry shared his advice on new features.
Contents
I. Nanosecond support in Zabbix Sender input file (47:42)
II. Nodata triggers and proxy availability (53:07)
III. Test item from the user interface (59:17)
IV. Default message for each media type (1:04:27)
V. SNMP credentials at a host interface level (1:08:18)
Hello everybody! Today I’m going to tell you about five small things but for a big reason — five new features in Zabbix 5.0.
It’s not a big secret that every major release comes with a lot of new features. Some of them are very technical as preprocessing, LLD, or TimescaleDB. But in every major release, there are some features that might seem so small that you won’t even notice them.
So, this presentation will explain five small things that will make a big difference in your regular life with Zabbix and will solve some ongoing issues that we had previously.
Nanosecond support in Zabbix Sender input file
Zabbix Sender has been here for a long time. The new option is the ability to add a nanosecond to the Zabbix Sender input file if you are sending the values from the input. This option can be used together with the –with-timestamps option, which specifies that each line of the input file contains whitespace-delimited <host> <key> <timestamp> <ns> <value>.
It’s a pretty lightweight and easy to install utility. There are no configuration files. It was used for sending data to the Zabbix server/proxy trapper item for processing most commonly in external scripts run outside of Zabbix.
shell> cd bin

shell> ./zabbix_sender -z zabbix s "Linux DB3" -k db.connections -o 43
where:
-
z – Zabbix server host (or the IP address)
-
s – technical name of monitored host (as registered in Zabbix frontend)
-
k – item key
-
o – value to send
The second option is to use an input file with –input-file (-i). Usually, we can use it to monitor some specific services or applications, when the data is collected with some external script, and it takes over 30 seconds to collect the data.
NOTE. At this moment, the maximum timeout option in Zabbix is 30 seconds, however, it is not recommended to set it to the maximum value at the start of your installation.
So, it’s a script with some cron-shuttling that runs from time to time on your system and collects the data to the text file with the syntax <hostname> <key> <timestamp> <value>. Then we utilize Zabbix Sender from time to time by specifying path with a ‘– i‘ to the input file, which sends the values to our Zabbix server with the proxy.
The problem was that for installations using replication or high availability setups, and therefore database replication, for instance, Galera or Innodb Cluster for MySQL 8, a primary key is required on all tables in the Zabbix database.
 Primary key for tables in the database
Not all the tables have primary keys out of the box, for instance, history tables. We can solve this problem by manually adding primary keys to our database.
 Default history table structure
In the default history table structure we have only four columns, and there were two options how we could add the primary keys:
- Alter table history add primary key (with itemid, click and ns), which is a good option.
- Alter table history add primary key (with itemid, click), which still works, but causes problems.
Before Zabbix 5.0, there was no option to specify nanoseconds in the input text block. The only thing that we could specify was the clock — the UNIX time with the minimum value for the clock of one second.
However, Zabbix is evolving, and now high-frequency monitoring is available. So, now we can collect five or fifty values per second. Here, the problem is very simple. For instance, if we had Galera or any other application, which required primary keys, and we used external scripts to collect high-frequency metrics and try to write them in the input file with the same UNIX timestamp, there was no option to add nanoseconds.
 Executing external script
In the log file, we got ‘query failed‘ because there is a duplicate entry based on the primary keys that we added.
 ‘query failed’ log file
Now we have a new Zabbix sender option ‘-N‘ with the input file format as follows:
<hostname> <key> <timestamp> <nanoseconds> <value>
We have just a new column with no new config files, no new utilities to install or configure.
You can still have the primary keys on the database tables, use Zabbix sender with an input file. Everything goes inside the database with no failed queries in the server log, and we can see all the latest data and the graphs. All triggers are also processed.
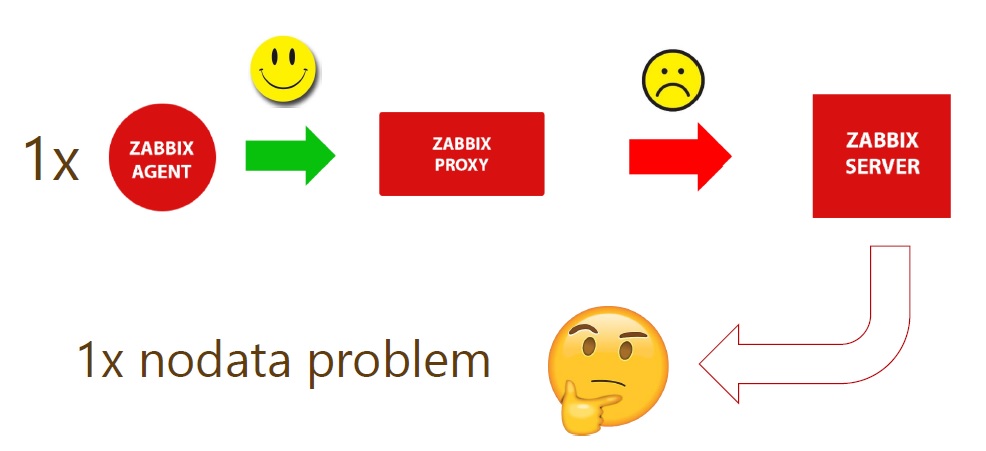
Nodata triggers and proxy availability
Since Zabbix 5.0, triggers respect proxy availability. But if you want to be informed about a host that is not reachable due to a problem with the proxy, you can still configure your triggers to notify you about it.
ZBXNEXT — is a feature request which was created 17 years ago — back in 2003. It’s the implicit trigger dependency when monitored via proxy.
This is a nodata() trigger function that checks whether the data was received from the host. If no data was received or the time period exceeds the one we’ve defined in the trigger parameters, it will be a problem.
For instance, we have one Zabbix Agent which is monitored by Zabbix proxy which is successfully reporting data to the Zabbix server.
 Zabbix agent monitoring by a proxy reporting to the server
There might arise network issues between the proxy and the server where the proxy is not able to transmit data to the server. As there is no data from the host, and the server will treat this host as unreachable and will create a new problem, which will be evaluated by all the actions. So, we’ll have a notification of nodata problem in the frontend and email messages.
 Nodata problem notification
Notifications can lead to the event and alert storms or other performance issues as the problem is not with a single host, but with a proxy. Behind that proxy, we might have hundreds or even thousands of hosts, which will end up in a lot of emails or some remote commands executing scripts for the problem.
 Nodata problem for multiple hosts
If we respect the proxy availability from our nodata() triggers, we will get only one problem in the front end and in notifications, even if 5,000 agents reporting to the proxy with communication issues report back to the server.
 Nodata problem with proxy availability
There was a way to solve this problem before Zabbix 5.0.
- We could configure trigger dependencies — create an unreachable trigger for the Zabbix agent, a dependency as to the proxy availability so that when the proxy was down those triggers didn’t fire. But creating a dependency trigger took a lot of time and was quite complex to manage and follow through upon any changes.
- If we didn’t want to respect the proxy availability, but we wanted to receive those 5,000 alerts, monitoring basically stopped. Even if there was some problem on the host, we would never know. So we had to use nodata(5) as a parameter. That is, if no data is received for over 5 minutes, there is a problem. If we wanted to receive notifications, nodata (5, strict) was to be used.
- The last option here was global correlation, which allowed us to respect this proxy availability.
Since Zabbix 5.0, it’s a hundred times easier and you don’t need to change any configuration as everything comes out of the box.
Test item from the user interface
In the previous versions, it was quite difficult to understand whether our item is configured correctly. So, if we added new items to the hosts and templates, especially since we added a lot of preprocessing options, we didn’t know if they would work as expected.
We had several options:
- waiting for the next update interval cycle.
- zabbix_agentd -t <item_key>, but that means basically executing the agent and forcing it to give us the value of some specified key. To do that you had to log in to the system where the Zabbix agent is running as it is not simulating the native communication between Zabbix server and proxy with an agent.
- Zabbix_get -s <host> -k <key> — the utility, which allows you to connect to a remote passive agent, so passive communication must be on.

But we still had some problems:
- Update intervals in our frontend might be too big and we had to wait to see the results of our actions.
- Customer intervals were even worse as we might check an item, for instance, once per month.
- Zabbix_agentd and zabbix_get don’t respect preprocessing, and we have many new preprocessing options. So, in case of any preprocessing, for instance, a simple regular expression matching or five preprocessing steps including the JavaScript, zabbix_get or Zabbix_agentd will not give you the processed value, but will just show you the value gathered from the agent.
In Zabbix 5.0, there’s no need to use any shell utilities in the frontend. To create an item, you just fill in all the parameters and preprocessing fields. Then you need to click a semi-new Test button and fill in a couple of fields.
 Testing new items
Even if an item is created on a local host, you can still execute and test it over some other host.
If you are creating a template on a development instance, which is working fine, you can start creating templated items and test them from the dev environment.
You can choose IP address — the port against which to test new items. If you monitor hosts across proxies, you just need to choose the proxy behind which that host is, and the proxy will do the monitoring.
In addition, you can see the progression of all preprocessing steps. In dev environment, the results of the preprocessing steps are displayed together with the final result.
 Preprocessing results
Default message for each media type
Media types are a part of the configuration that will notify you about some problems in your monitored environment.
In earlier versions, you had to open Configuration > Actions and change the message you want to send to the user. You could change the subject, the entire message, or use internal macros to provide more meaningful information.

However, for customers with different policies and guidelines, using hundreds of hosts or media types or monitoring customers within one single installation with hundreds of different messages to be sent it was very tiresome to make mass changes.
In Zabbix 5.0, in Administration > Media types where we define how we’ll send this message — email, ticket, creating a service, setting message to the slack or the discord by using webhooks, there is a new tab — Message templates.
 Message templates tab
Here you can specify and choose a default message for every possible operation of the event. You can do just one change and if it is assigned to 500 actions, for instance, this change will apply to those existing actions.
In some cases when you need to follow company guidelines, you can define standard messaging for every state of a problem.
 Message template parameters
If needed, you can still override default messages on Action level.
SNMP credentials at a host interface level
It’s a small thing, but since SNMPv3, problems arise with typos, as there are many different and hard to follow authentication parameters: lowercase, uppercase, symbols, digits letters, etc.
If you make one typo in any single item, be it prototype in the template, that will also apply on 100,000 hosts in our environment, and you might end up with 100,000 unsupported items simply because of a typo in a passphrase, such as lowercase instead of uppercase. So one mistake in an item prototype will affect the entire host, and unsupported items can affect SNMP interface.
 SNMPv3 authentication parameters
Instead of recommending you to be careful, we try to make your life simpler.
- In Zabbix 5.0 you don’t have to choose from SNMPv1, SNMPv2, or SNMPv3 item types as we’ve replaced them with SNMP agent.
- All configuration is done on the interface level. So, when you’re creating a new host or editing an existing host you select SNMP parameters just as you did before. In Zabbix 5.0, here choose the SNMP version and fill in all the authentification parameters on the host interface level. So, all of the existing and new items created will have this configuration and you won’t have to write down those authentication parameters for every new item.
 Setting parameters on host interface level
- You can also add multiple interfaces on the host with different SNMP versions, set up different parameters, and when creating a new item you can simply choose SNMP version with no additional configuration.
- You can also bring those other interfaces to the new host level. So, instead of creating a host with two SNMP interfaces, you can create two hosts and it will function fine.
See also: Presentation slides and video