With Zabbix 5.0 LTS version we hosted Zabbix meetups all over the world in different languages to find out what’s new in Zabbix 5.0. Explore Zabbix founder and CEO Alexei Vladishev’s brief overview of the 30+ features and improvements made in Zabbix 5.0 LTS.
Contents
I. Zabbix 4.2 and Zabbix 4.4 (00:19)
II. Zabbix 5.0 (03:01)
1. Zabbix Agent 2 for Windows and Linux (06:53)
2. Secure by design (08:41)
3. Usability improvements in Zabbix 5.0 (14:08)
VI. Conclusion (48:08)
Today we are talking about Zabbix 5.0 LTS — a new major release, which was introduced a few days ago. My name is Alexei Vladyshev. I’m a founder and the CEO of Zabbix, I’m working on Zabbix for over 20 years already. I will give you a brief overview of the features and improvements we’ve made in Zabbix 5.0 LTS
Zabbix 4.2 and Zabbix 4.4
First, let’s have a quick recap of Zabbix 4.2 and 4.4 releases. In Zabbix 4.2 released in April 2019, we introduced:
- High-frequency monitoring with throttling for large-scale monitoring and for detecting problems as fast as possible.
- Data collection with HTTP agent so that Zabbix was able to collect data over HTTP protocol and communicate directly to external APIs.
- Prometheus support.
- Improved preprocessing thanks to validation rules and support of JavaScript, which is able to transform data in any possible way and to use it for monitoring purposes.
- Preprocessing by Proxy for better scalability.
- Enhanced tag management so that events and problems received metadata using tags.
In Zabbix 4.4 released in September 2019, we introduced:
- New Zabbix agent.
- Webhooks for notification and alerting.
- TimescaleDB support.
- Built-in knowledge base for metrics and triggers so that information about metrics and triggers became visible in Zabbix UI and users could see how to solve problems generated by triggers.
- New Zabbix templates.
Zabbix 5.0 LTS
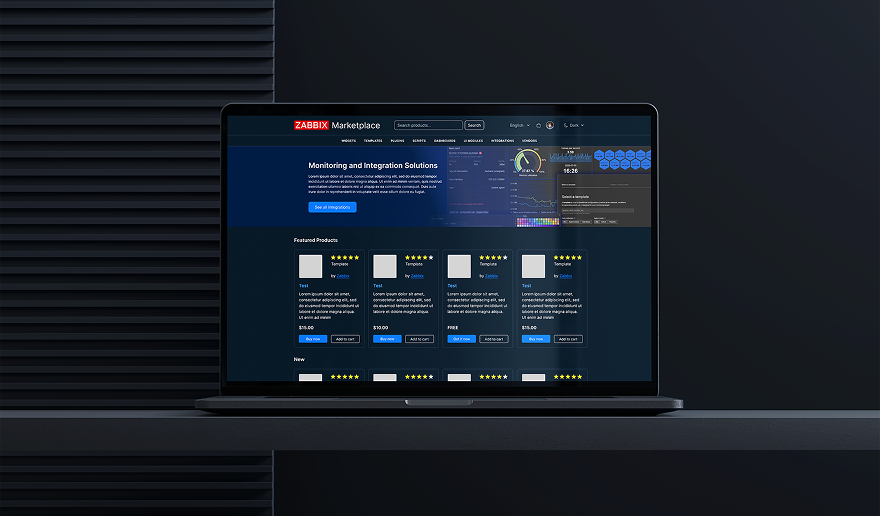
On the Zabbix integration page, you can see that Zabbix is able to monitor different applications, devices, services, including cloud services. It can be integrated with a number of different solutions.
 Available monitoring and integration templates
At the moment you may use a template, a box agent plugins to enhance data collection. On the other hand, Zabbix 5.0 offers Webhook integrations with external systems, including ticketing systems, ITSM systems, or third-party tools.
 Webhook-based integrations
In Zabbix 5.0 LTS, we’ve extended the number of integrations with different ticketing and alerting systems.
 Integration with ticketing and alerting systems
Zabbix 5.0 also extended applications monitoring thanks to out-of-the-box templates and plugins.
 Out-of-the-box monitoring templates and plugins
We continue to increase the number of officially supported templates, plugins, and Webhook integrations, which will be available in our Git repository.
If you have your own plugin or a template, it’s very easy to share and to contribute to Zabbix:
- Sign Zabbix Contributor Agreement (ZCA) on https://www.zabbix.com.developers
- Make Zabbix Pull Request at https://git.zabbix.com
- Zabbix Dev Team will review and accept if everything is fine, and we’ll extend our official support.
Zabbix is free and open-source software, we don’t do any proprietary versions. We provide packages for various Linux distributions and container platforms and Linux appliance images for virtualization platforms. At the moment Zabbix is available as one-click deployment in different public clouds, such as Red Hat Openshift или OpenStack.
 Available Zabbix packages
Zabbix Agent 2 for Windows and Linux
Zabbix 5.0 provides official support of Zabbix Agent 2 for Linux and Windows. I really believe that the new Zabbix agent is one of the most advanced monitoring agents on the market. The new Agent offers many useful features.
 Most advanced monitoring agent on the market
In addition, in Zabbix 5.0 we’ve introduced persistent storage for the new agent. That means that the metrics collected by Zabbix Agent 2 that can’t be transferred to the Zabbix server can be optionally stored in a local file system.
 Persistent storage
It’s a useful feature for unstable communications, for monitoring critical data, or satellite connections between Zabbix agent and Zabbix server.
Secure by design
1. Webhook over HTTP proxy. You don’t have to enable a direct connection with an external system, for instance, JIRA running in the cloud anymore.
Now you may set up and use your internal proxy which ensures better security.
2. In Zabbix 5.0 you can restrict available checks on the Agent side. This allows for defining Blacklists and Whitelists on a specific agent to limit remote commands, to restrict access to some metrics, specific files or file systems.
- Whitelist for MySQL related checks
AllowKey=mysql[*]
DenyKey=*
- Blacklist to deny all shell scripts
DenyKey=system.run[*]
- Blacklist to deny access to /etc/password
DenyKey=vfs.file.contents[/etc/passwd,*]
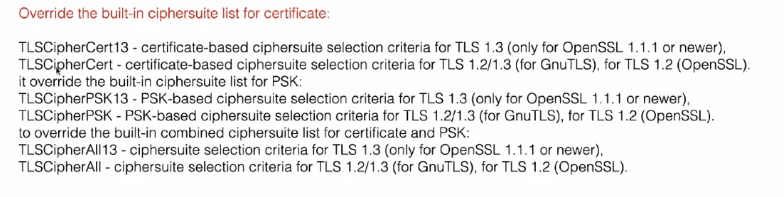
3. New configurable ciphers are now supported, which may be useful for some sensitive environments running in compliance with security standards, for disabling weak ciphers, and creating whitelists of ciphers to be used for TLS communication.
 New configurable ciphers
4. In Zabbix 5.0, we now support encrypted connection to databases (MySQL and PostgreSQL for now).
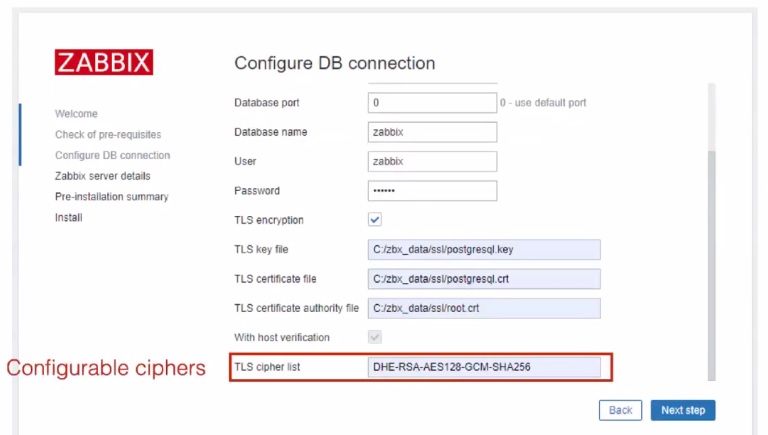 Ciphers for DB connection
5. Zabbix 5.0 supports SHA256 for stronger encryption of user password hashes.
6. Zabbix 5.0 supports secret macros. Now you can mark a user macro as secret not to expose some sensitive information. The secret macro value is not visible anywhere, it cannot be retrieved in UI, and cannot be exposed by the end-user in any way.
 Secret macros
7. All connections inside Zabbix are now secure — we use HTTPS protocols, pre-shared key encryption for connections with Agents and proxy, and support whitelist and blacklist for agent metrics, etc.
 Secure connections
8. SAML authentication for single sign-on is now supported, which is an enterprise-grade feature.
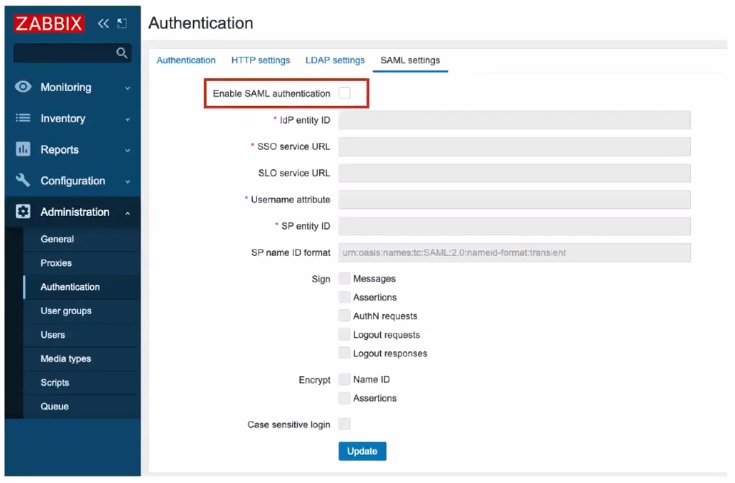 SAML-authentication
SAML enables Zabbix integration with various local and cloud identity providers such as Microsoft ADFS, OpenAM, SecurAuth, Okta, Auth0, as well as Azure, AWS, or Google Cloud Platform.
Usability improvements in Zabbix 5.0
1. Zabbix 5.0 frontend is now optimized for wide screens. We’ve moved the top menu to the left side. You can have a full or minimized display or hide it.
 UI optimized for wide screens
2. You can now build dashboards faster with the copy/paste functionality for Zabbix widgets. Now, if you need to select a widget, press Copy
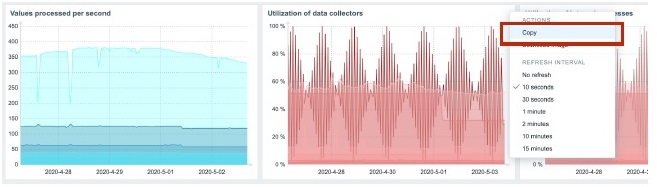 Copying widgets
and Paste the widget to the same or any other dashboard.
 Pasting widget to dashboard
3. In Zabbix 5.0, it is also possible to export graphs as PNG images from graph widgets. You only need to select a widget, then click Download image, and share it with your team.
 Exporting graphs
4. We now have a filter by tags for some widgets, for instance, for Problem by severity or Problem hosts widgets. For instance, you can group some data for a host or a data center.
 Filtering by tags
5. In Zabbix 5.0, UI modules allow for creating new menu entries or new pages, for extending existing frontend functionality or managing permission control.
The UI modules are fully independent and are shareable with other Zabbix users who can enable or disable them.
 Adding new modules
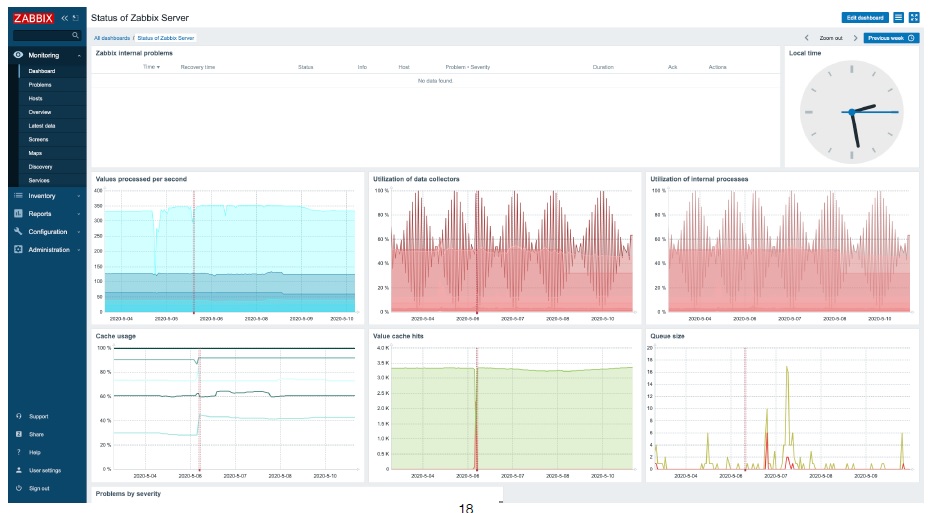
6. Now you can see the list of monitored devices in Monitoring > Hosts: the hosts and servers, interface, associated tags, problems, and quick navigation to specific host-related information as Latest data, Problems, Graphs, Screens, and Web monitoring.
We don’t have Monitoring > Web and Monitoring > Graphs tabs anymore. The data displayed in Monitoring > Hosts can be filtered by tags so that disabled devices can be displayed, for instance.
 Easy navigation to host-related resources
Monitoring > Hosts offers advanced filtering options. For instance, if you need a list of hosts encountering problems, you can filter by Problem severity or if you need a list of devices associated with a specific service, you may filter by the ‘Service’ tag.
 Advanced filtering options
7. Zabbix 5.0 offers a new preprocessing operator — Replace, which can be used instead of regular expressions, for instance. It can be also used for mapping, removing or replacing characters and strings.
 New preprocessing operator: Replace
8. We’ve also introduced a new operator for JSONPath, which returns property names of matching elements.
 New operator for JSONPath
9. Threading for email notifications is now possible in your Inbox. All emails associated with a problem will be grouped by event ID.
 Threading for email notifications
10. User macros for IPMI user name and password or even secret macros for extra security can be used in Zabbix 5.0.
11. We’ve introduced a mass update for user macros for hosts and templates as it’s much easier to manage user macros on a host or a template level. You can Add, Update, Remove a macro for a set of hosts or Remove all macros.
 Adding or updating user macros
 Removing user macros
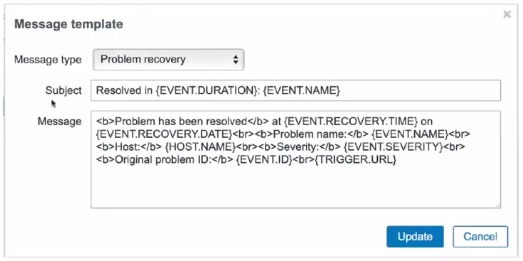
12. Message templates for Media types are now supported. In Zabbix 5.0, you can define message parameters in a new Message templates tab.
 Media type templates
You can also define different templates for different Media types.
 Defining Media type template
In earlier versions, you had to manage message formats on an Action level, which was not easy in case of multiple actions.
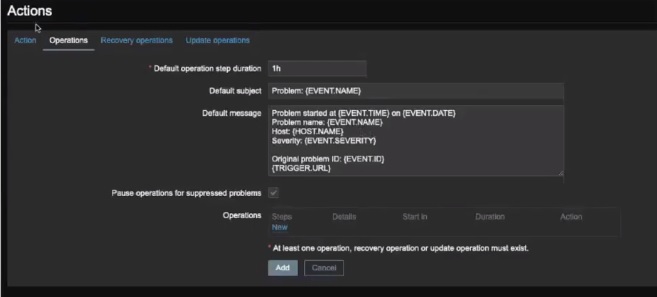 Managing templates on the action level
Now you can manage them globally on a Media type level.
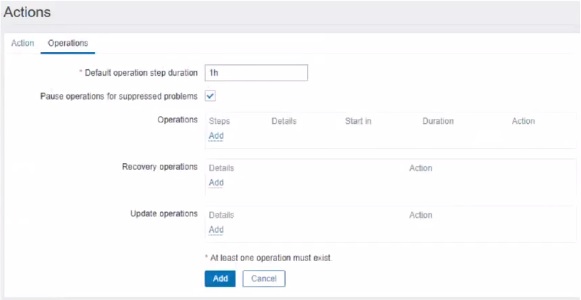 Managing templates on the action level
In case of Zabbix integration with some external system, it comes with predefined templates.
13. New CLI tool to test JS scripts was implemented as JavaScript is used for Webhooks, integrations, data transformation rules, preprocessing, etc.
To troubleshoot all those scripts, you may use a new CLI utility — zabbix_js, which executes JavaScript.
 zabbix_js
 zabbix_js examples
14. In Zabbix 5.0, there is triggers support of the text operations which allows for comparing with text constants,
{host:zabbix.version.last()}="5.0.0"
{host:zabbix.version.last()}="{$ZABBIX.VERSION}
comparing the last value with the previous one,
{host:text.last()}<>{host.text.prev()}
or
{host:text.last(#1)}<>{host.text.prev(#2)}
or comparing the values of different items.
{hostA:textA.last()}={hostB:textB.last()}
15. Automation & discovery.
- Discovery for JMX counters is now available for Java machines monitoring with new JMX check operators:
jmx.get[]
and
jmx.discovery[]
 JMX Checks
- Discovery for Windows perf counters is used to return a list of discovered performance counters, for instance, when discovering processors, file systems, or applications on the Windows server.
 Discovery for Windows perf_counter
- Better ODBC monitoring. In earlier versions, to use ODBC monitoring you had to define data sources in /etc/odbc.ini file, which cannot be accessed from the Zabbix frontend. In Zabbix, 5.0 everything can be templated and be a part of the item key: server name, driver name, port, user ID, password, or database.
 Item key for ODBC monitoring
Here, you can also use a secret macro for user name and password for extra security.
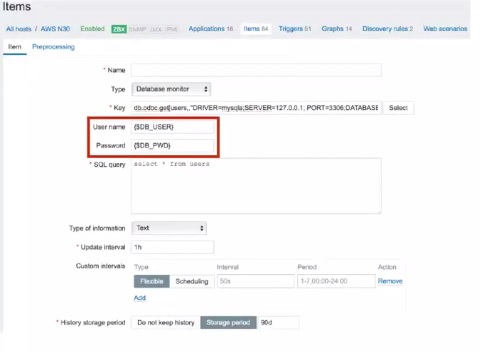 Secret macros for ODBC monitoring
- Discovery of IPMI sensors. Zabbix 5.0 provides for simple templates for hardware monitoring with IPMI protocol.
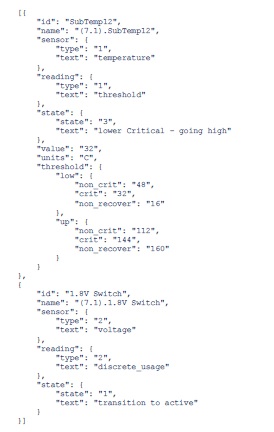 ipmi.get
16. Testing items from UI — a new feature used for host items and for templated items.
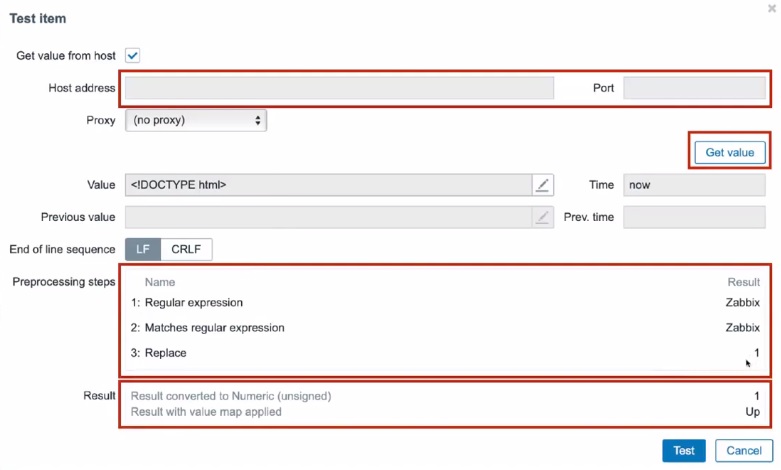 Host items testing
Any problems are now visible in Zabbix UI.
 Problems displayed in the UI
The same is true for items templates. In addition, to find out why an element is not supported, you need just to click Test.
17. Media type testing support introduced in Zabbix 4.x is maintained. It is important for Zabbix integrations with external systems, for instance, ticketing systems.
 Media types testing
18. User macros for host prototypes. We’ve implemented user macros support so you can define user macros for host prototypes and even use LLD macros in values in the description. So, you can use any value received in JSON in user macros.
 LLD-macros for host prototypes
19. Support of Float64 data type, which is normally used for very large values. The benefit of Float64 support is compatibility with Float64 data returned by Prometheus.
In Zabbix, historical tables will not be migrated to Float64 automatically. The upgrade is optional and can be launched manually by executing double.sql patch. Upgrade will require some downtime depending on the size of your database.
20. We’ve implemented scalability improvements and now Zabbix UI is ready to handle millions of devices.
- Drop-downs for host selections replaced with host search control.
- Hardcoded maximum size of Overview grid introduced.
- Redesigned Monitoring > Hosts > Graphs (multiselection of graphs, all graphs display, or pattern matching).
- Paging introduced whenever possible (Monitoring > Hosts > Web).
21. Compression for efficiency and lower cost. We’ve implemented TimescaleDB experimental support by installing TimescaleDB extension to our PostgreSQL in Zabbix 4.x. Advantages of TimescaleDB involve automatic partitioning and automatic removal of old data by Zabbix.
In Zabbix 5.0 you just need to configure settings in Administration > General > Housekeeping and Zabbix will do it for you. TimescaleDB is a performance-oriented database disregarding the size of your database.
Now you can also configure compression parameters in Administration > General > Housekeeping. Compression allows us to save disk space (almost tenfold as user experience suggests).
 Timescale DB compression possibilities
22. SNMP settings on the host interface level, which is very useful for network monitoring. There is only one item type — SNMP agent, only one template, and you can specify all security-related settings on the host-interface level, and easily switch between SNMPv2 and SNMPv3.
 SNMP settings on the host interface level
23. In Zabbix 5.0, availability monitoring will respect proxy availability, that is, Zabbix 5.0 will display a root cause of availability problems when monitoring is performed with nodata trigger:
{HostA:item.nodata(1m)}=1
 Availability monitoring will respect proxy availability
Now the nodata function respects proxy availability, and if you need strict results to warn users of no data available regardless of proxy availability, you can use strict function:
{HostA:item.nodata(1m,strict)}=1
24. In Zabbix 5.0, it’s possible to manage LLD rules globally. Now we have advanced filtering options for discovery rules to manage, for instance, Not supported discovery rules and to update them. This feature can be efficiently used for troubleshooting and mass operations.
 Filter for LLD rules
25. Ability to unacknowledge events can be used to fix mistakes and to manage workflows dependent on this acknowledgment. In addition, the unacknowledge screen is displayed in the acknowledge window now, which improves usability.
 Unacknowledging problems
26. Override for LLD rules is now supported. This feature allows for setting special processing rules, overriding triggers severity, discovering temporary file systems or not, setting different update intervals for different items, different history storage periods, etc.
 Overriding LLD rules for temporary file systems
For instance, you can change triggers priority for Oracle file systems only.
 Overriding trigger priority for certain file systems
27. Zabbix 5.0 supports new macros:
 New macros in Zabbix 5.0
28. Other improvements in Zabbix 5.0:
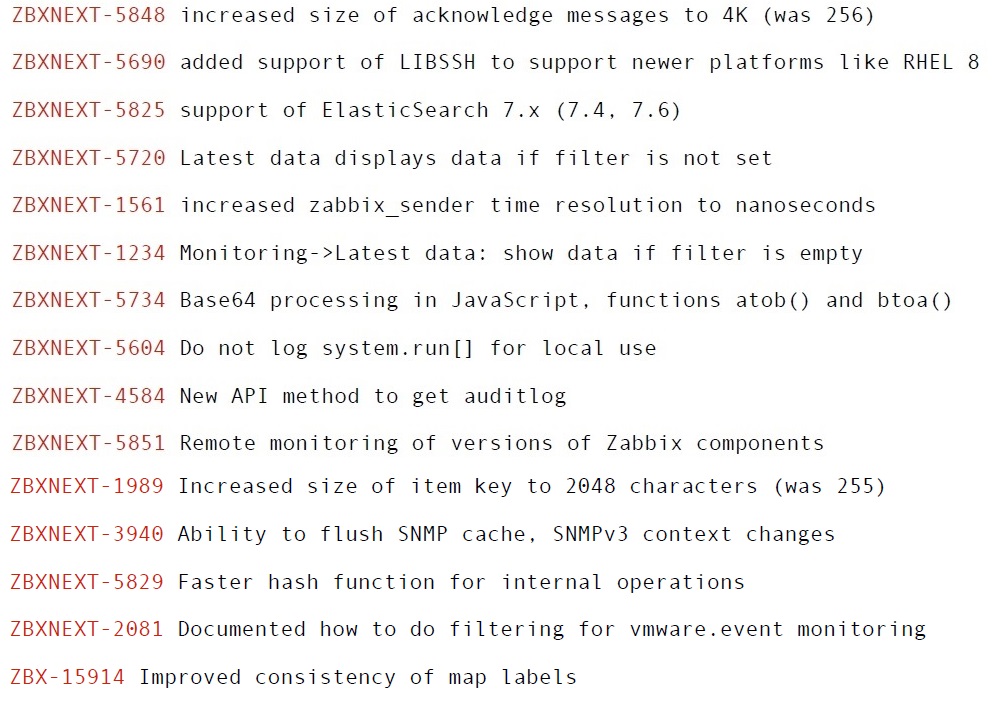
Improvements in Zabbix 5.0
29. Removing legacy to make a better product
 Dropped support of legacy features
Conclusion
Upgrade is easy as always! Just install the new server binaries and frontend files, execute them, and Zabbix will update your database. Visit our upgrade notes page for more information.
UPGRADE NOTES!
1. Upgrade to Float64 is optional.
2. TimescaleDB compressed data are read-only
3. Minimum supported version — PHP7.2.
4. DB2 is not supported anymore.