


Highlights of Zabbix Conference 2015: Day 2

October 20, 2015
Conferences
After having a brimming first day and an even more exciting night, the participants gathered their strength for another round of insightful talks, case studies and intriguing ideas, shared on the Zabbix conference.

Highlights of Zabbix Conference 2015: Day 1
September 22, 2015
Conferences
This was the 5th time we all gathered together in Riga, and we must say it was the most impressive year by far. The spirit of the Zabbix Conference 2015 still lingers in the air, as we step into a new week at the office. On the first official day of the conference the participants gathered […]
Zabbix 2.4 features, part 9 – Ad-hoc graphs
October 29, 2014
Technical
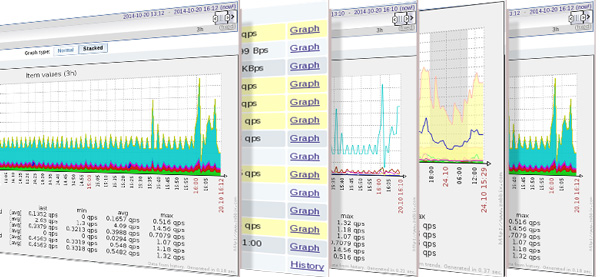
There have been two types of graphs in Zabbix until now: Simple graphs Custom graphs Simple ones were available for any numeric item, but could only display that one item. Custom graphs could have multiple items on them, but could only be created by users with administrator privileges. Zabbix 2.4 adds a capability to graph […]

Zabbix 2.4 features, part 8 – Debugging web and VMware monitoring
October 15, 2014
Technical
In the previous two blog articles we looked at really great improvements in Zabbix 2.4 to help with debugging/troubleshooting – ability to change loglevel for a running daemon (any sub-process, even) and various smaller validation and error reporting improvements. There is yet another improvement in this area, though – improved debugging capabilities for the built-in […]
Zabbix 2.4 features, part 7 – Improved troubleshooting
October 2, 2014
Technical
We already looked at one incredibly useful feature, available in 2.4 – ability to change log level while Zabbix daemons are running. Zabbix 2.4 also provides several other improvements that should help a lot with problem troubleshooting.
Zabbix 2.4 features, part 6 – Runtime loglevel changing
September 8, 2014
Technical
Historically, issues that might arise when using Zabbix have not been easy to troubleshoot. Not everything that would be useful is always logged. Log level can be increased, but those who still remember the first time they saw what DebugLevel=4 can do will understand why that option usually helped more advanced users. Besides, changing the […]
Zabbix 2.4 features, part 5 – Custom action condition formula
September 2, 2014
Technical
In Zabbix versions before 2.4, notification (action) conditions were limited to three predefined options – “AND”, “OR”, “AND/OR”. Zabbix 2.4 adds a new option – Custom expression. This results in full freedom when deciding how all the different conditions should be handled.
Zabbix 2.4 features, part 4 – Web monitoring URL limit increased to 2048
August 20, 2014
Technical
Also known as that minor improvement some people just love. We already discussed most web monitoring related improvements for Zabbix 2.4, but there’s this one tiny thing left… an increase for the maximum URL length.
Zabbix 2.4 features, part 3 – SSL verification and authentication controls
July 21, 2014
Technical
In these Zabbix 2.4 feature series we have already seen some improvements for the built-in web monitoring – the ability to specify custom headers and control redirects. Web monitoring got improved further – let’s explore the new options regarding SSL authentication. There are two of them: Verifying SSL certificates Supplying client certificate
Zabbix 2.4 features, part 2 – Controlling redirects and header retrieval for web monitoring
July 10, 2014
Technical
Continuing with the improvements for the upcoming Zabbix 2.4, there are several improvements for the web monitoring. In previous versions Zabbix always followed redirects and retrieved the full page – now both of these things can be controlled.
Zabbix 2.4 features, part 1 – Multiple LLD filters
July 3, 2014
Technical
Zabbix 2.4 is the upcoming major Zabbix version. While initially scheduled to be released in May 2014, it will be slightly delayed – Zabbix team is working hard, but there’s still a lot they would like to include in this release. While the new version is being baked, we can already start looking at the […]
Removing unfinished translations
August 26, 2013
Community
Zabbix frontend is translated in many languages. For some, the coverage is great – 2.0.7 has been 100% translated in 9 languages. For some other translations the coverage is not that great… In preparation for Zabbix 2.2, there is a plan to remove translations below some threshold.
