


If you find yourself needing additional flexibility when it comes to database monitoring, Zabbix agent 2 may be exactly what you need. Keep reading to see which features make it ideal for database monitoring and find out how to best use them for your own purposes.
Table of Contents
What is a database?
If you’ve been using Zabbix for a while, you know that a database is an organized collection of data that is stored and accessed electronically.
That data can be historical, configuration, business, social media-related, etc. A database, or rather a database management system (DBMS) allows you to store, manage, and retrieve information efficiently.
Types of DBMS
We can separate DBMS into multiple types. Depending on how data is stored, retrieved, managed, there can be quite a few, but we will try to limit ourselves to the most common four:
- Relational databases (or RDBMS) see tables and SQL.
- MySQL
- MariaDB
- PostgreSQL
- Oracle
- NoSQL databases store data in formats like JSON, key-value pairs, or graphs.
- MongoDB
- Redis
- InfluxDB
- ElasticSearch
- Cloud databases use cloud platforms for scalability.
- Amazon RDS
- Azure SQL
- Time-series databases (or TSDB databases) are optimized for time-stamped data.
- TimescaleDB
- InfluxDB
But what unites all those database engines? They can all be monitored by Zabbix!
Database monitoring
Database monitoring is important for a variety of reasons, the most common of which are to get a precise overview of database and application performance. Since databases can be a vital part of multiple departments and applications, poor performance may impact an entire company and its users, leading to unsatisfactory results on all sides.
To avoid such situations, the set of metrics we should monitor for database engines can include:
- Database environment metrics
- CPU performance
- Memory usage
- Drive capacity
- Disk latency
- Database performance metrics
- Query performance
- Transaction/operations/indexing
- Connections
- Application and/or business related data
- Amount of users
- Transactions
- Inventory
- Configuration
Why Zabbix agent 2?
Zabbix Agent 2 includes multiple features that enhance its flexibility:
- Task queue management with respect to both schedule and task concurrency.
- Concurrent active checks with threads.
- Multiple agent 2 unique metrics
- Easier to extend using GO plugins.
Plugins in Zabbix Agent 2 are written in the Go programming language and provide a flexible, native way to extend the agent’s functionality. These plugins communicate directly with databases using their native APIs or libraries, which allows for correct and efficient performance monitoring.
But agent2 provides even more flexibility when focusing on database monitoring, allowing us to:
- Limit query execution
- Control the session time
- Configure encryption between Zabbix agent and database
- Control cache mode
All database data is collected using the best approach for the monitored database.
- MySQL, monitoring relies on the Go-MySQL-Driver
- PostgreSQL integration is managed through the pgx driver
The list goes on for supported database engines:
- MySQL / MariaDB
- PostgreSQL
- ORACLE
- MSSQL
- MongoDB
- Redis
- Memcached
Monitoring SQL databases
Database environment
In this part we will focus on how to monitor and retrieve data from SQL databases and SQL database-related parameters. Monitoring SQL database environment metrics with Zabbix agent 2 is as straightforward as monitoring any virtual or physical machine with an OS. All we need to do is add the repo:
# dnf install https://repo.zabbix.com/zabbix/7.0/centos/9/x86_64/zabbix-release-latest-7.0.el9.noarch.rpmInstall the agent:
# dnf install zabbix-agent2Then, make sure that connections from Zabbix server to Zabbix agent 2 are allowed using Server parameter. In the example below, we have two addresses, 127.0.0.1 – which is essentially localhost, can be used if you’re agent is installed on the same machine as Zabbix server or proxy. And an actual Zabbix server DNS, which is used if agent is installed remotely.
### Option: Server
#       List of comma delimited IP addresses, optionally in CIDR notation, or DNS names of Zabbix servers and Zabbix proxies.
#       Incoming connections will be accepted only from the hosts listed here....
# Mandatory: no
# Default:
# Server=
Server=127.0.0.1,server-dns.example.com
Finally, link one of the many templates available out of the box:
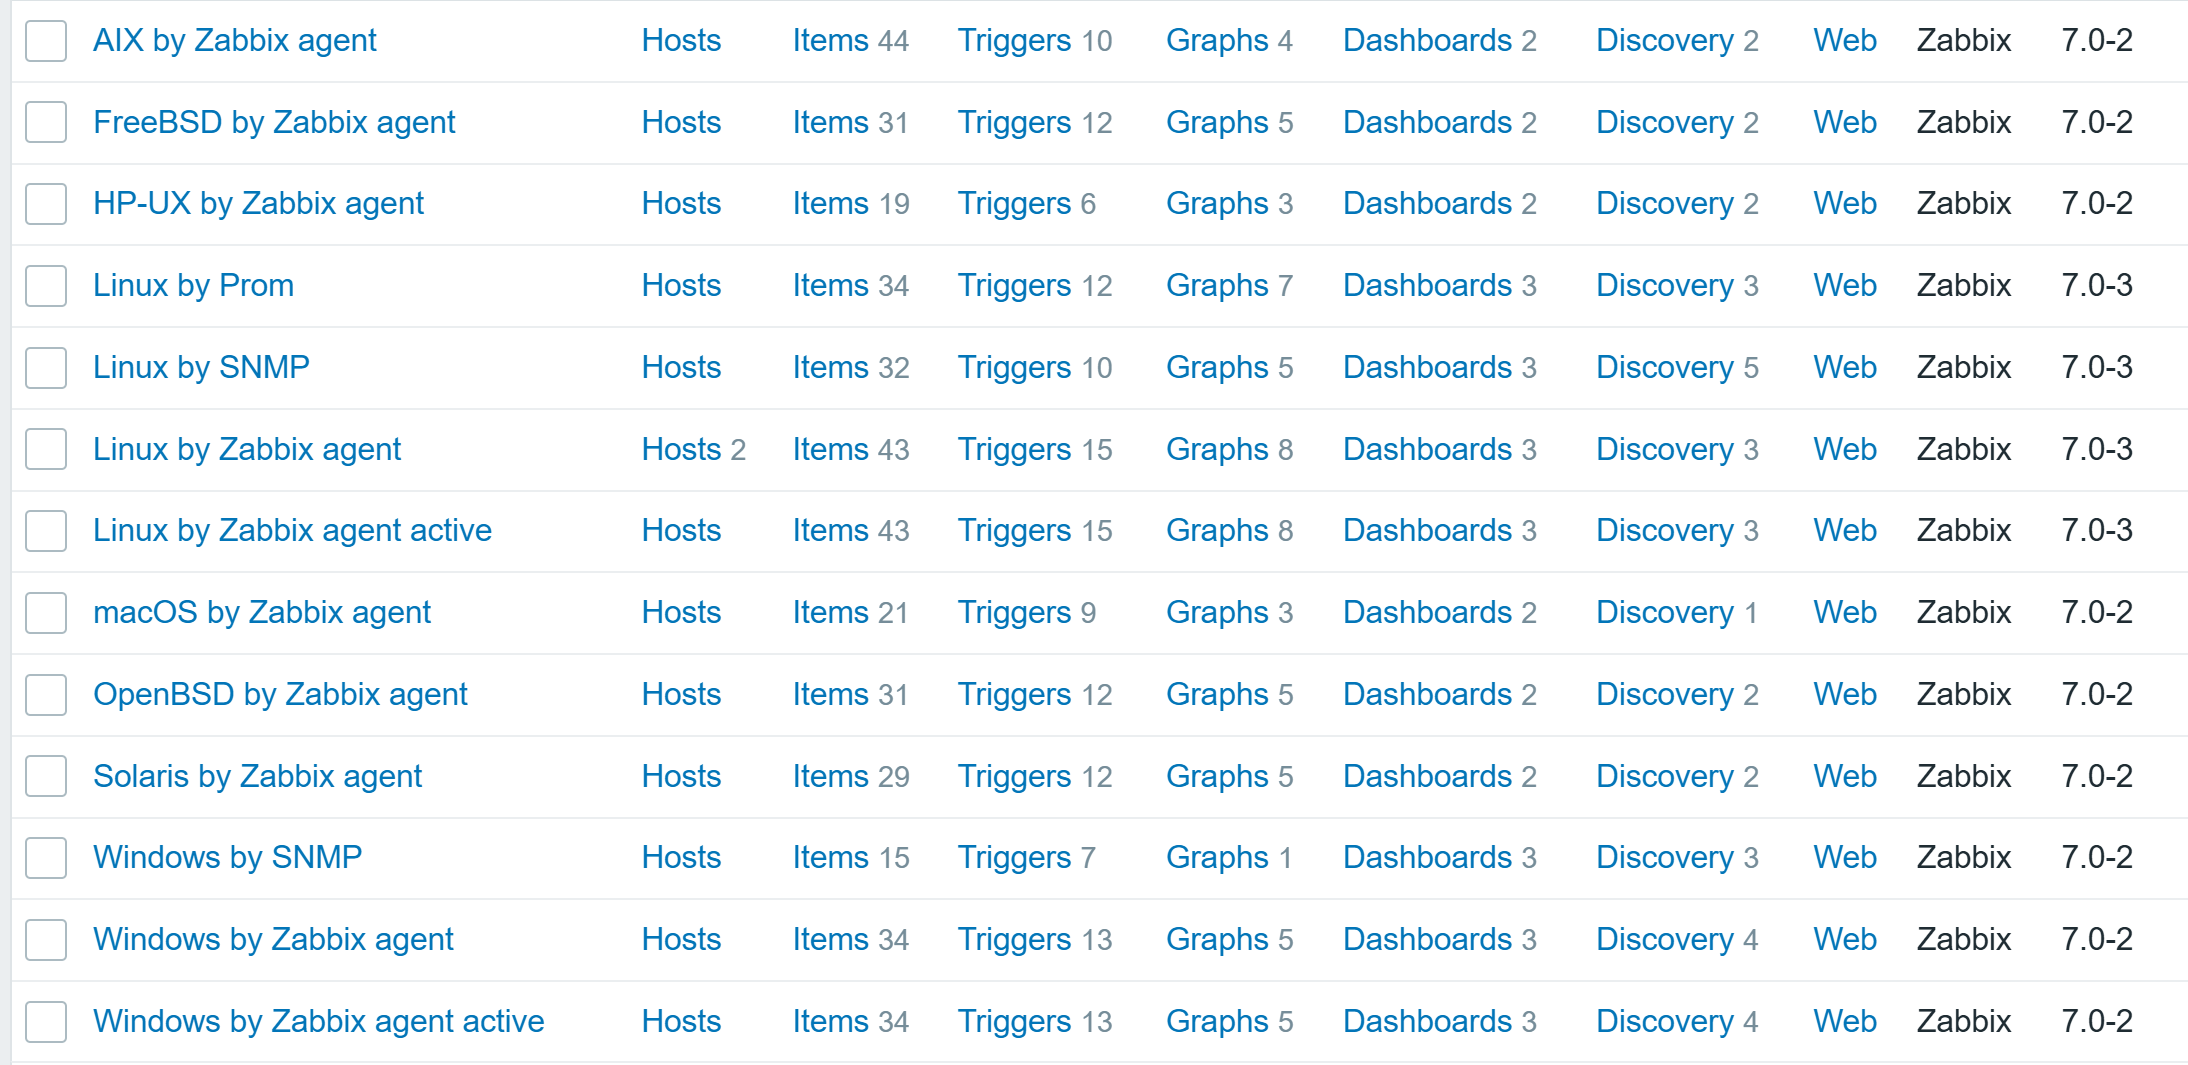
SQL database performance metrics
What about the actual DB performance metrics? There are plenty of approaches we can take using Zabbix agent 2.
Out-of-the-box templates are available for multiple databases that can be monitored by Zabbix agent 2:
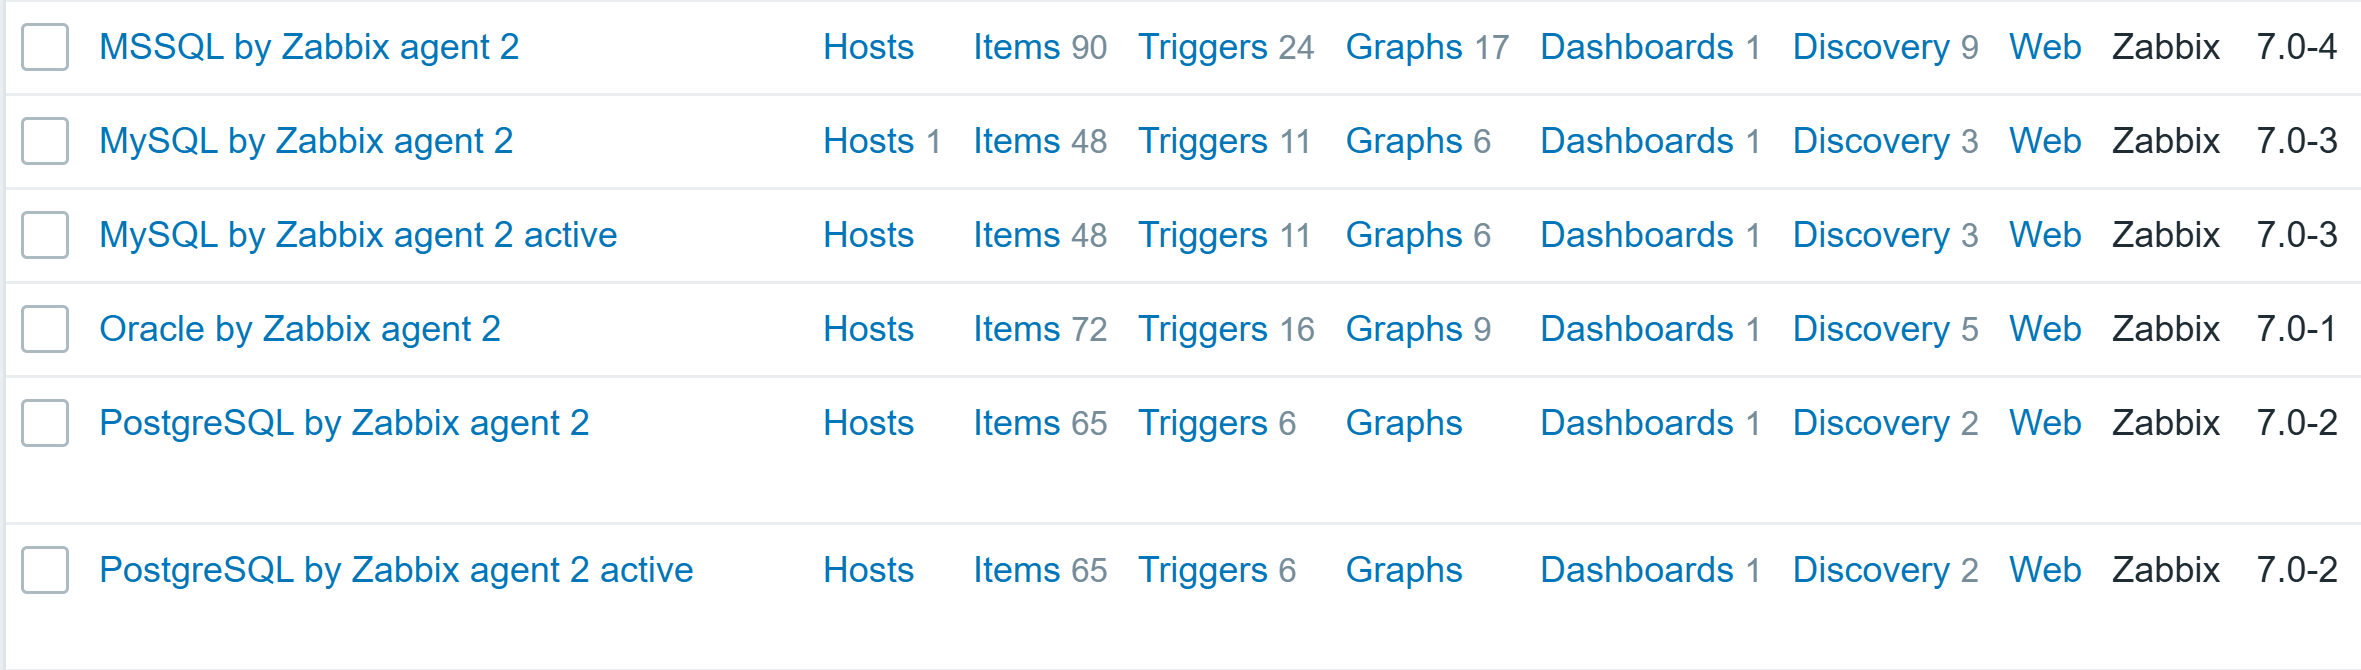
Each of the templates uses a database native way to get precise performance data, such as SHOW GLOBAL STATUS for MySQL or dbStats for MongoDB. Also, template provides instructions on how to prepare the database for monitoring. Let’s take MySQL/MariaDB for example:
Create a MySQL user for monitoring (<password> at your discretion) and give this user enough permissions for monitoring:
mysql> CREATE USER 'zbx_monitor'@'%' IDENTIFIED BY '<password>';
mysql> GRANT REPLICATION CLIENT,PROCESS,SHOW DATABASES,SHOW VIEW ON *.* TO 'zbx_monitor'@'%';
In order to collect replication metrics, MariaDB Enterprise Server 10.5.8-5 and above and MariaDB Community Server 10.5.9 and above require the SLAVE MONITOR privilege to be set for the monitoring user. The command then looks like this:
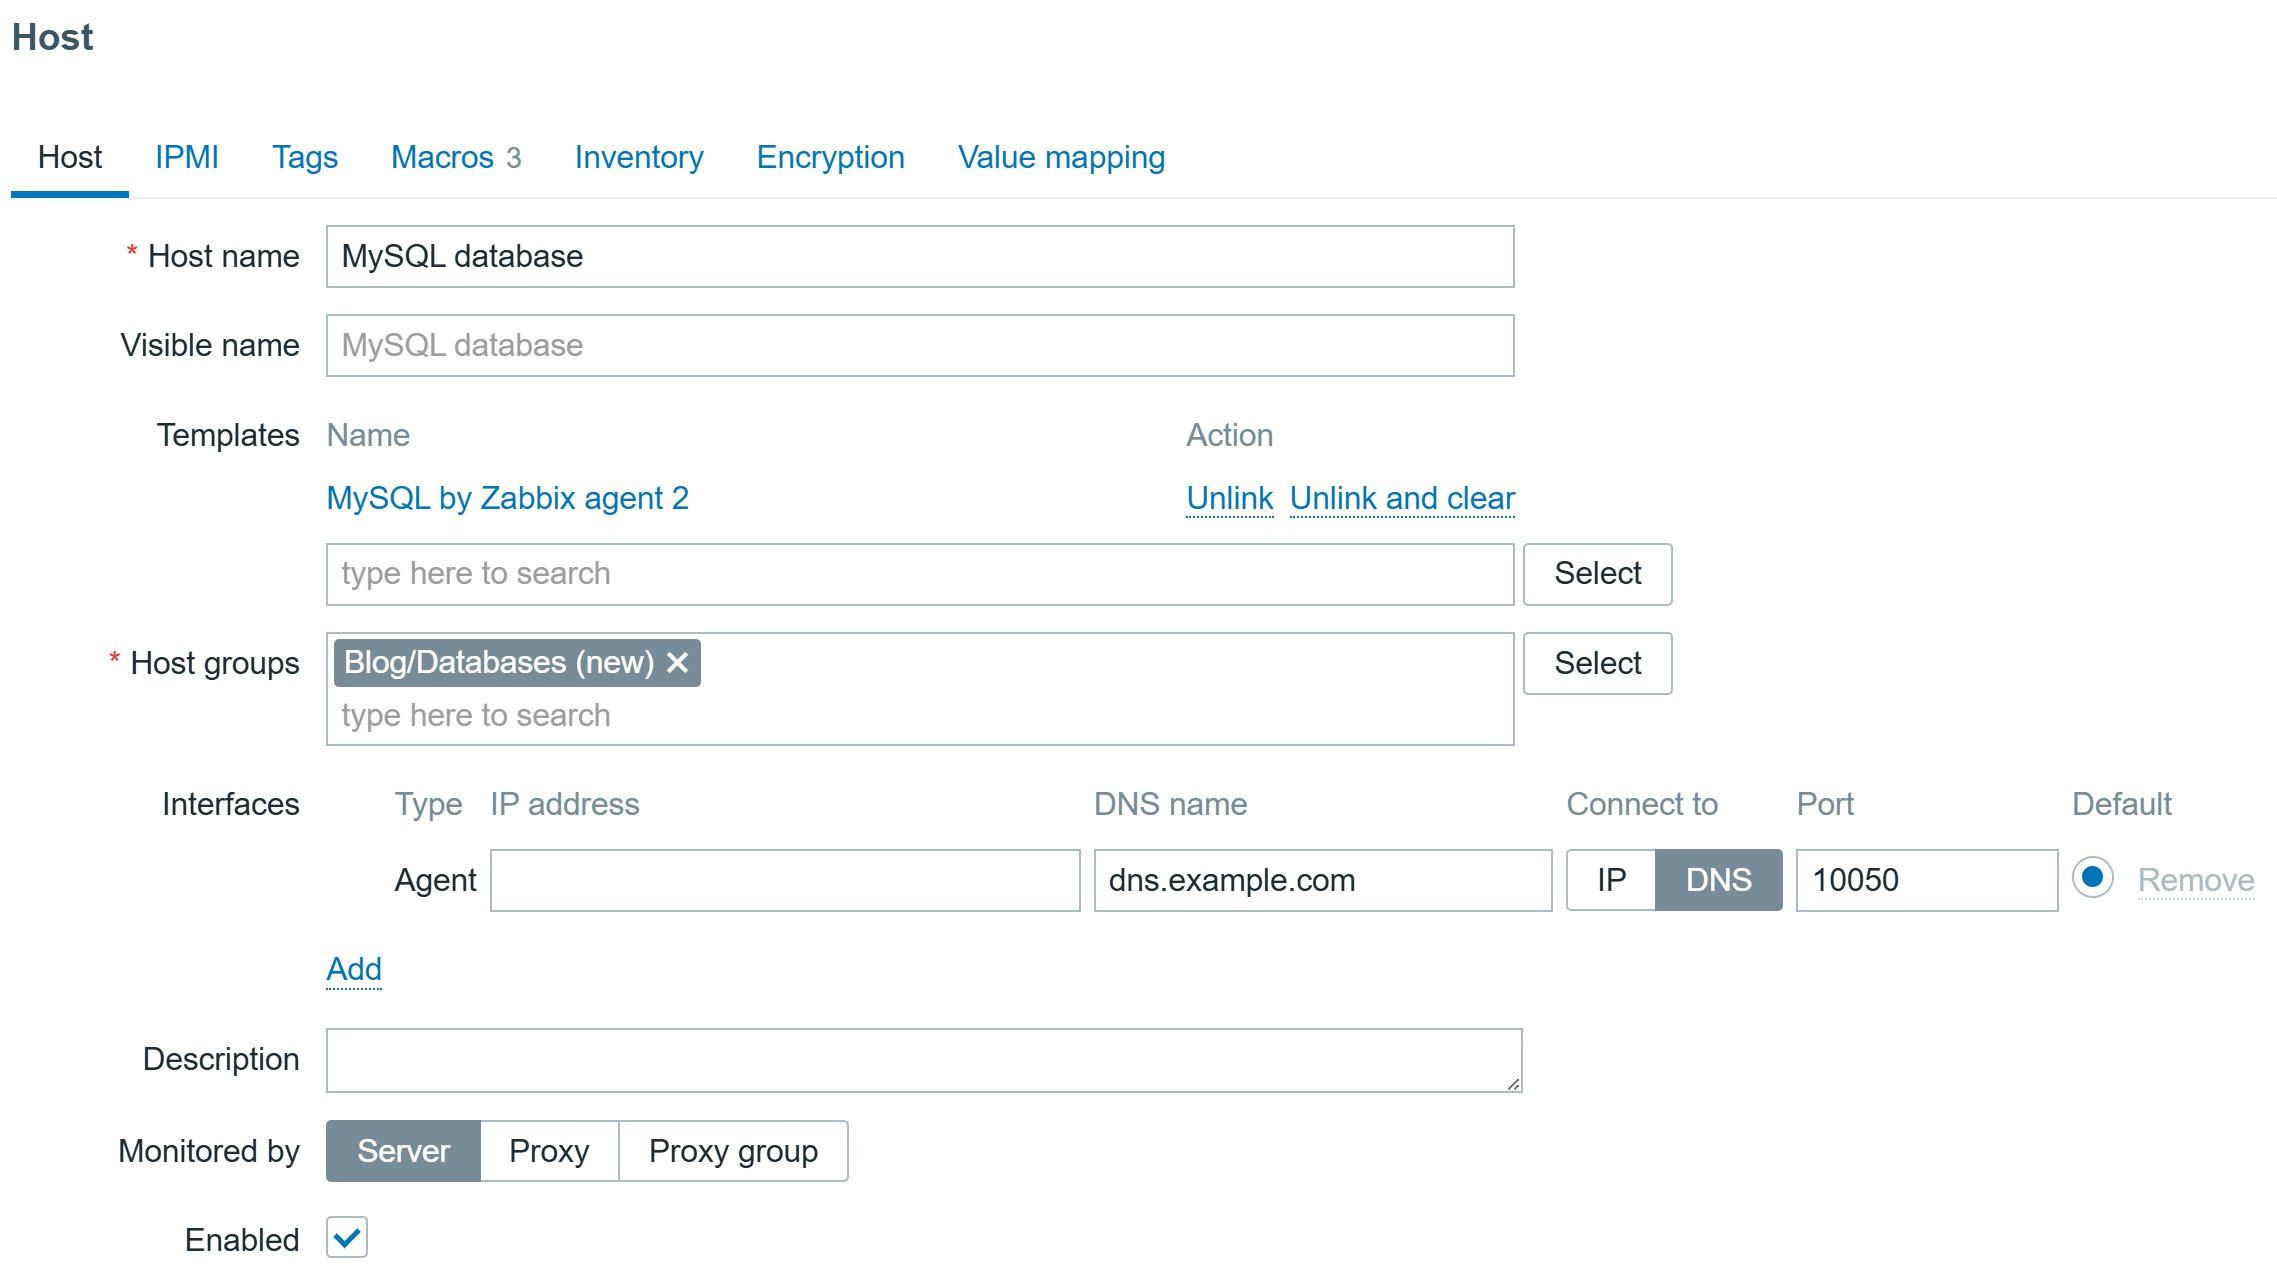
mysql> GRANT REPLICATION CLIENT,PROCESS,SHOW DATABASES,SHOW VIEW,SLAVE MONITOR ON *.* TO 'zbx_monitor'@'%';Then create a host to represent your MySQL/MariaDB server, link the “MySQL by Zabbix agent 2” template and specify IP or DNS of the server on which Zabbix agent 2 is installed:
Configure the Macros on the same host, {$MYSQL.DNS} must be set to address of the server on which database is installed, in this case it is installed locally, but can be a remote one as well, Zabbix agent 2 will be able to reach it:
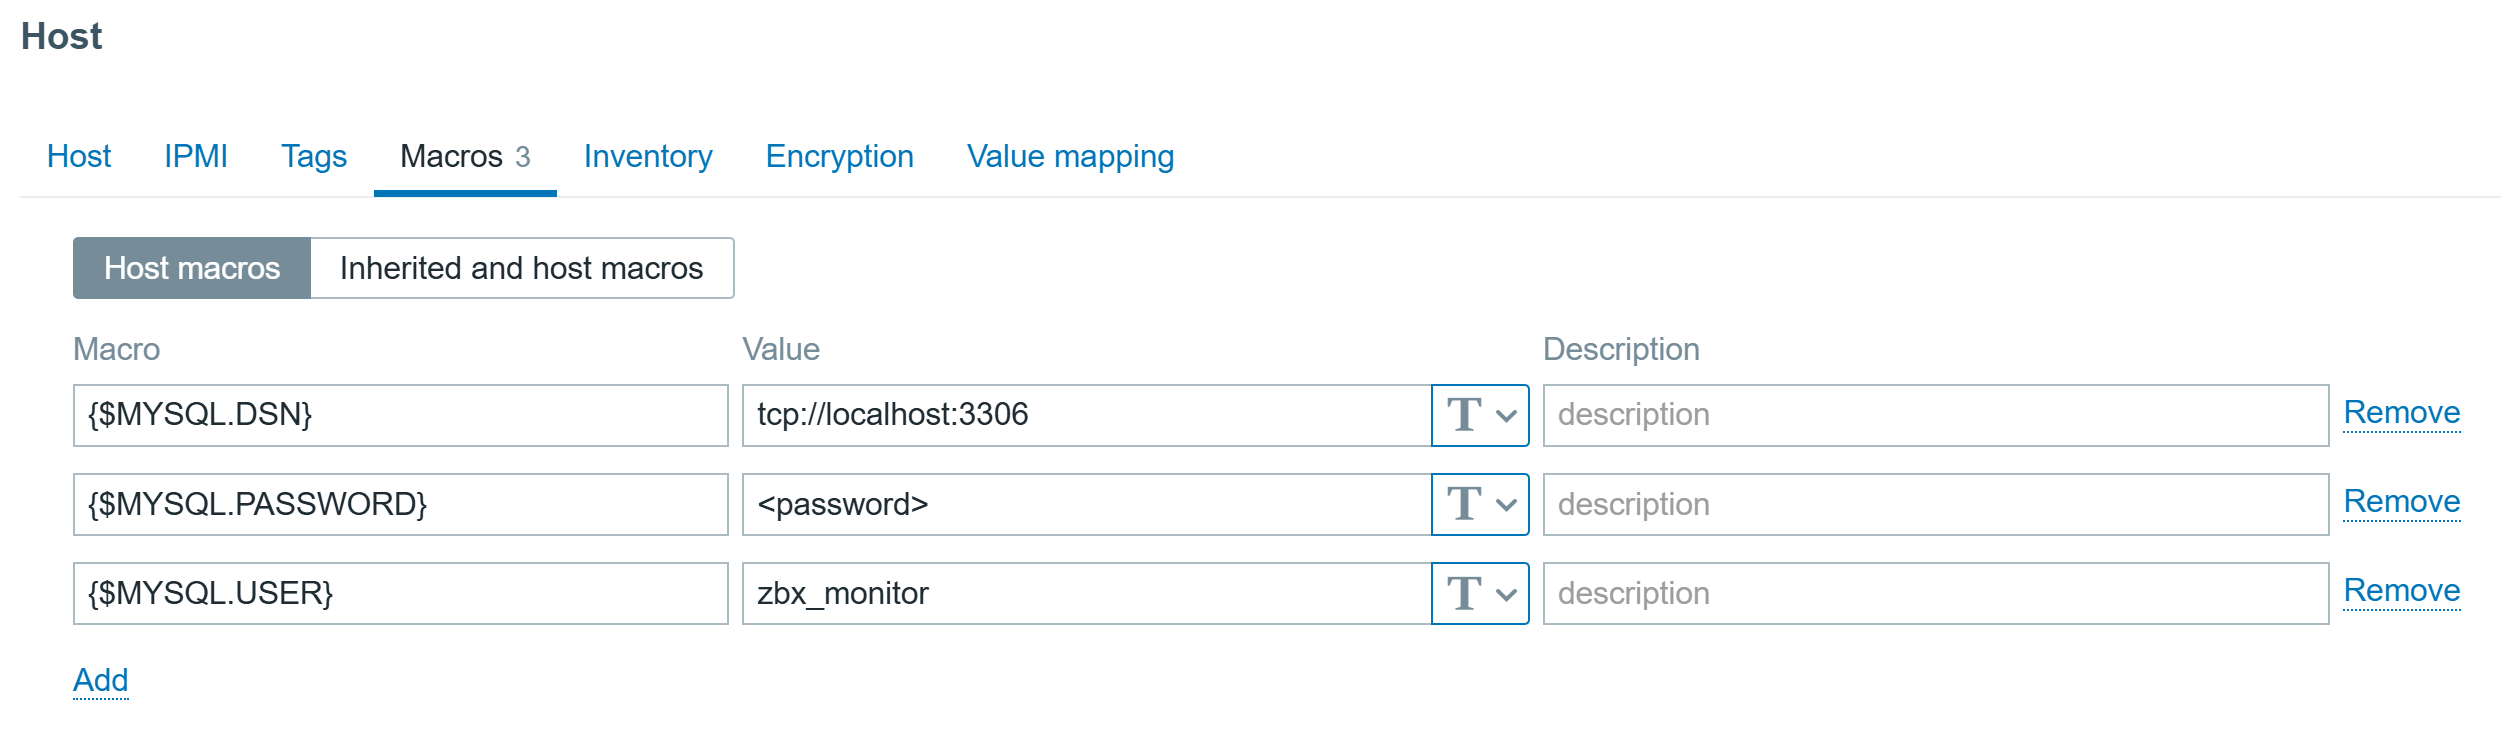
And the data will start pouring in!
You can find instruction for other databases here.
SQL database internal data monitoring
A default template will tell us a lot about performance, but what if we also need application data? Something that is stored in the database, i.e.
- Number of orders
- Logged in users
- Host count
- List of failed transactions
- Amount of media uploaded
Zabbix agent 2 lets users collect custom SQL query results with the help of configuration files and a specific item key:
<dbtype>.custom.query[connString,<user>,<password>,queryName,<args...>]:
• Dbtype – mysql, postgresql, oracle, mssql
• connString - URI or session name;
• user, password - Database login credentials;
• queryName - name of a custom query, matches SQL file name without .sql extension;
• args - one or several comma-separated arguments to pass to a query.
The main idea of this key is to construct efficient queries that can return multiple values. The values returned will be automatically transformed to JSON, which is both easier to preprocess and use for LLD creation.
I will add a simple query to find all hosts and their main interface availability in Zabbix:
SELECT hosts.host,interface.available FROM zabbix.hosts JOIN zabbix.interface ON hosts.hostid=interface.hostid WHERE hosts.status IN (0,1) AND hosts.flags IN (0,4) AND interface.main=1;First I need to create a directory for custom queries:
# mkdir /etc/zabbix/zabbix_agent2.d/plugins.d/custom_queriesNow I will create an .sql file with a query and paste the mentioned query into the file:
# nano /etc/zabbix/zabbix_agent2.d/plugins.d/custom_queries/interfaces.sql Now I will edit the MySQL plugin .conf file and set a custom queries path:
# nano /etc/zabbix/zabbix_agent2.d/plugins.d/mysql.conf
### Option: Plugins.Mysql.CustomQueriesPath
#       Full pathname of a directory containing *.sql* files with custom queries.
#
# Mandatory: no
# Default:
# Plugins.Mysql.CustomQueriesPath=
Plugins.Mysql.CustomQueriesPath=/etc/zabbix/zabbix_agent2.d/plugins.d/custom_queries/
Save the changes and restart Zabbix agent 2 to apply them:
# systemctl restart zabbix-agent2Before adding the item using the web interface, it is always a good idea to test it:
zabbix_agent2 -t mysql.custom.query["tcp://localhost:3306","zbx_monitor","<password>","interfaces"]
The output will is now a easy to work with JSON pattern (beautified here):
[
{
"available": "1",
"host": "Zabbix server"
},
{
"available": "1",
"host": "Test environment"
},
{
"available": "1",
"host": "MySQL database"
},
{
"available": "1",
"host": "MongoDB database"
},
{
"available": "1",
"host": "PostgreSQL database"
},
{
"available": "1",
"host": "Customer portal"
}
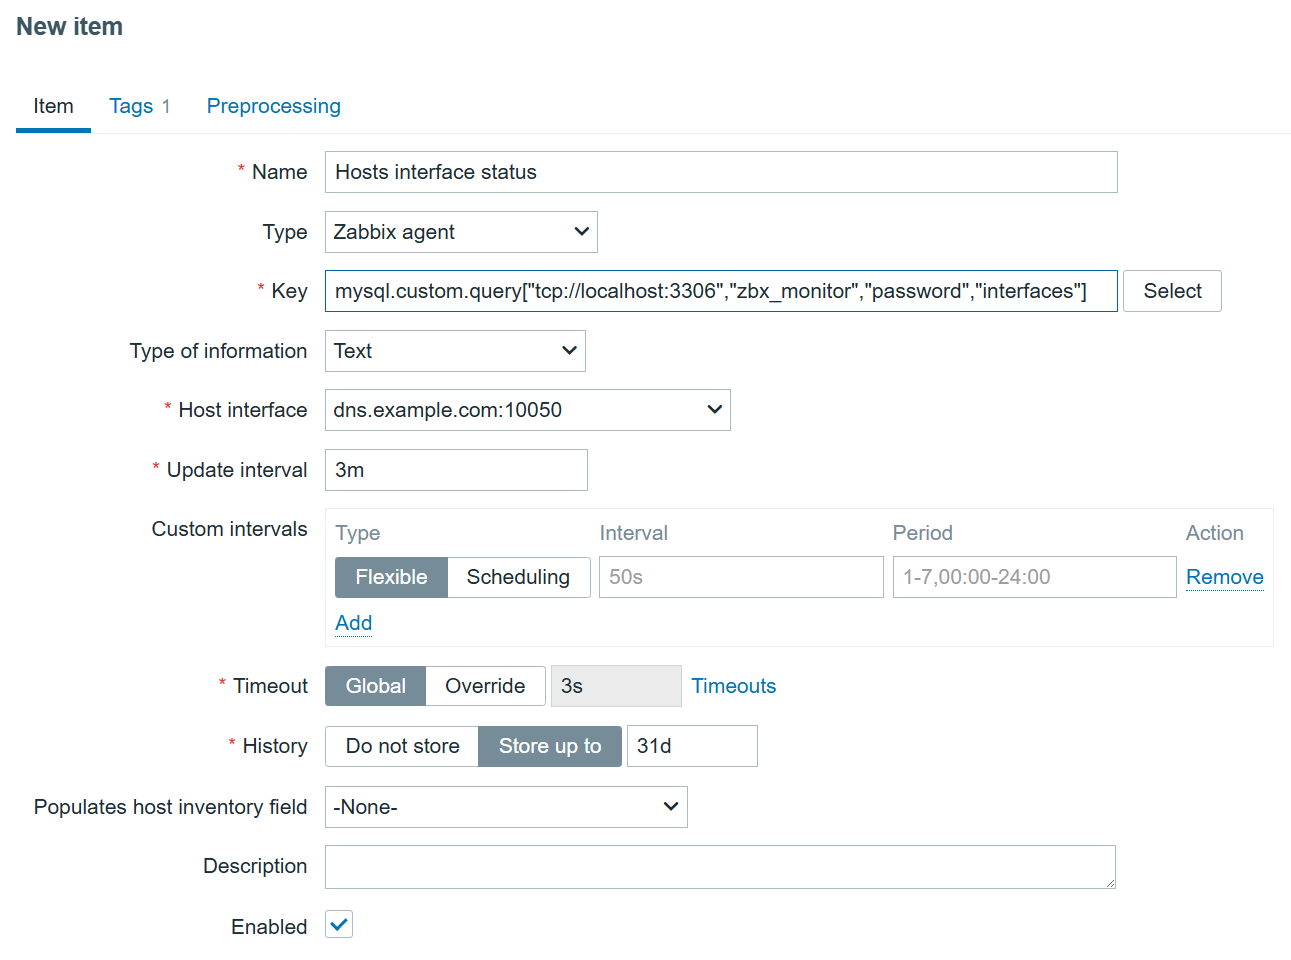
]Now, I’m sure the data is collected and can be used for LLD. I can create a new item on the MySQL database host to collect this data:
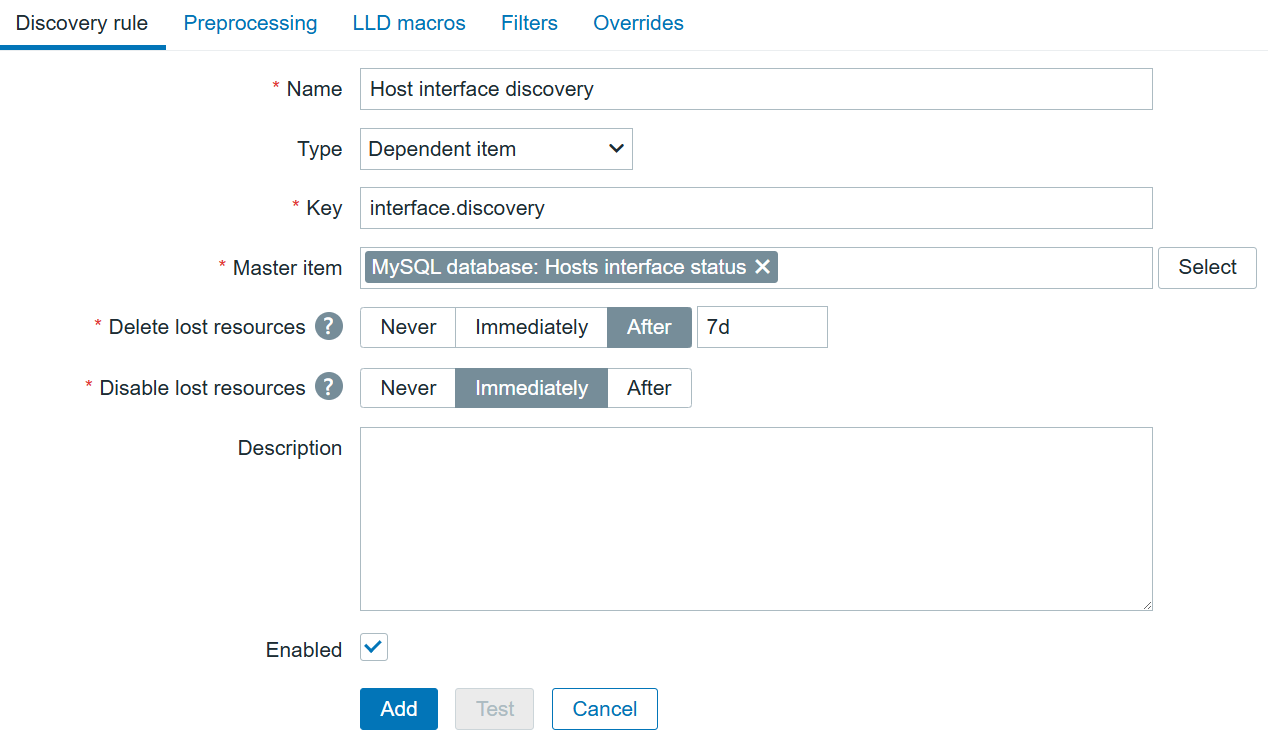
Since I know what kind of data will be returned, I can create a dependent Discovery rule on the same host:
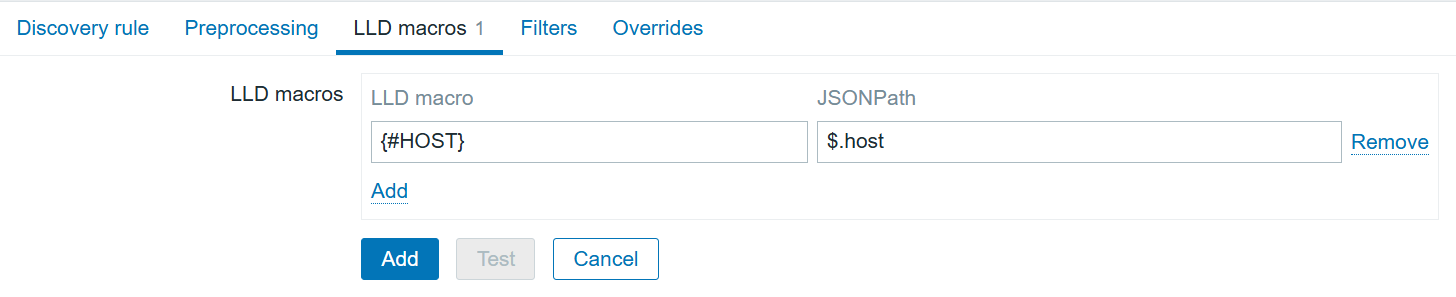
The LLD macros tab will help to transform the current JSON to the LLD-suitable JSON, replacing “host” with {#HOST}.
After adding the discovery itself, we can create the dependent item prototype, which will allow us to discover all hosts and their status:
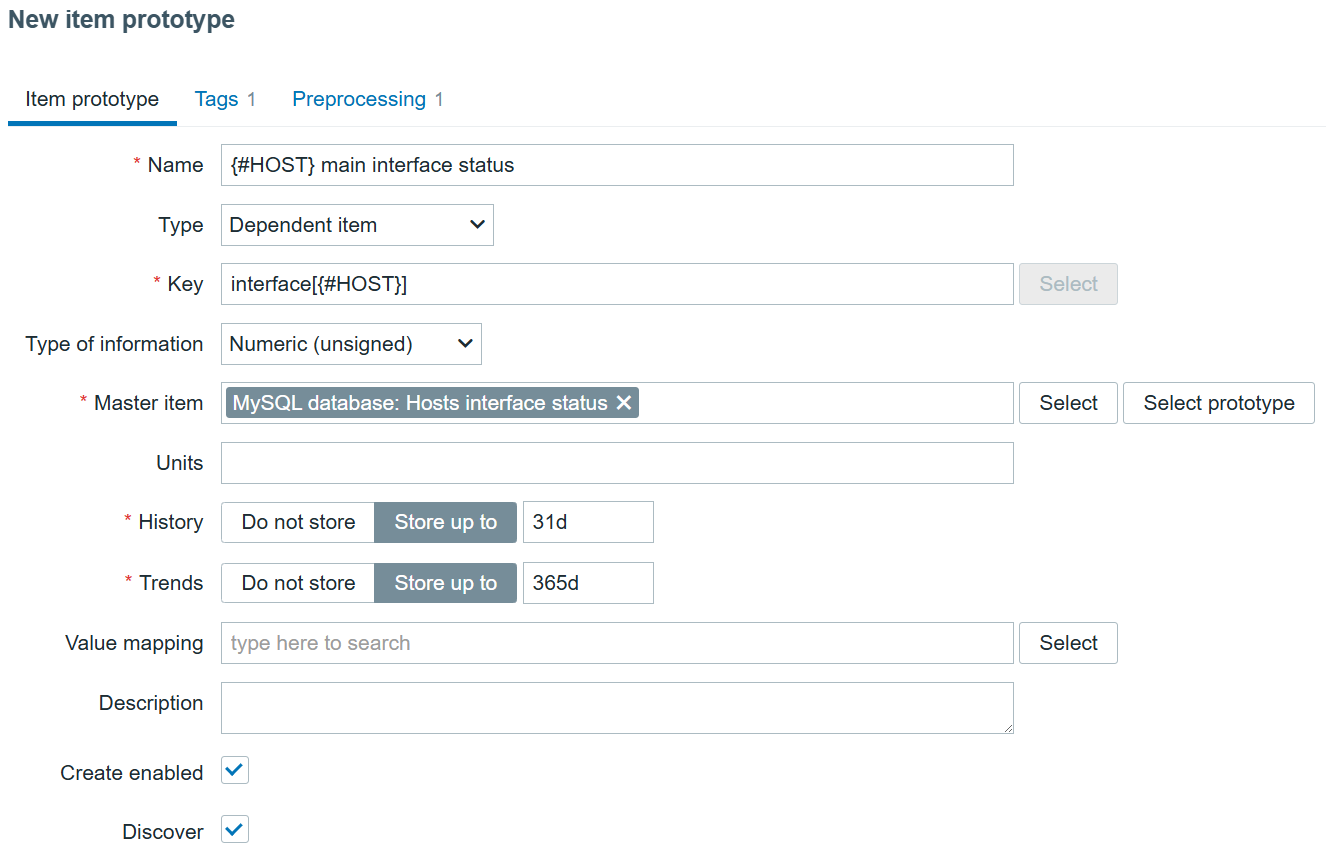
Preprocessing here is a must, and it needs to be flexible enough to extract each individual host interface status:
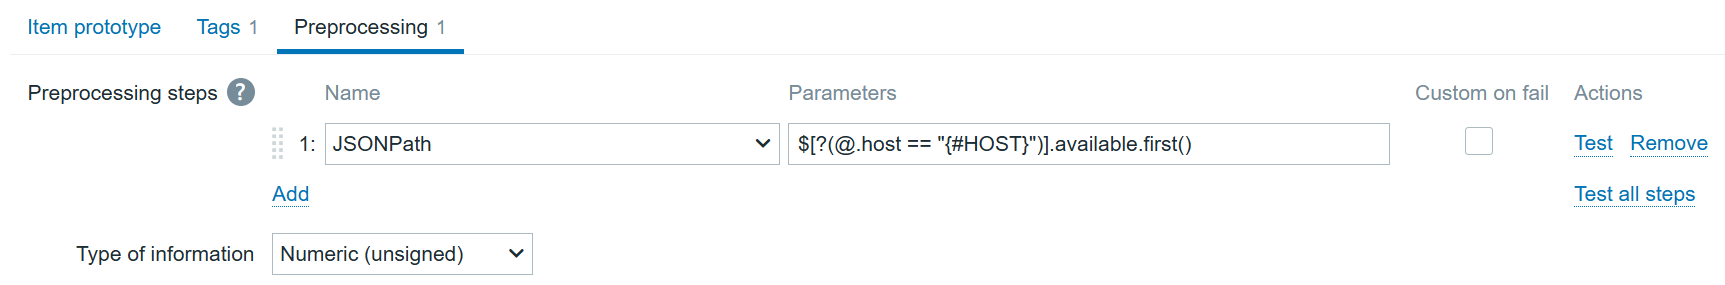
Now after adding the item prototype, we can check the results:
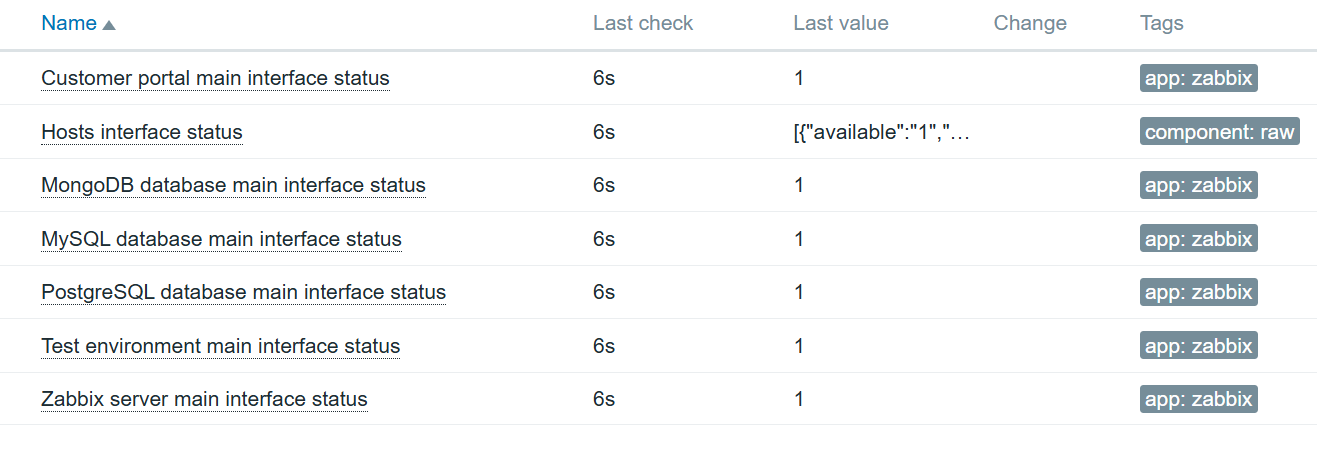
An item cam be further enhanced using value mapping, to specify that 1 means available and 0 means not available.
With this approach, any internal database data can be extracted and monitored. In part 2 we will see how NoSQL databases can be monitored for both performance and internal data using Zabbix agent 2.
If you’d like more information on database monitoring, please don’t hesitate to sign up for our training course in Advanced Zabbix Database Monitoring, which covers multiple approaches to collecting database-related performance metrics and data using Zabbix Agent 2, ODBC, and API requests, as well as optimizing data collection by introducing dependent low-level discovery for minimal performance impact.


I have configured zabbix 7 on ubuntu 22 to monitor oracle database using odbc agent2 is also installed but i need to monitor remote oracle database using ODBC only isql -v and sqlplus connections are good but on zabbix ui for all items and in zabbix logs i have this message that stos all work pls do a good search and let me know the solution cannot connect to odbc dsn [sql error] : [01000] unix odbc manager cant open lib path to oracle driver
Thank you for the question.
ODBC would require a completely different approach. If ODBC is an absolute must in your case, I recommend checking out this article on the Zabbix blog: https://blog.zabbix.com/agentless-oracle-database-monitoring-with-odbc/15589/.
The concept hasn’t changed much over the years, so don’t be discouraged by the article’s date!
I will be publishing an updated version of this article in the near future.