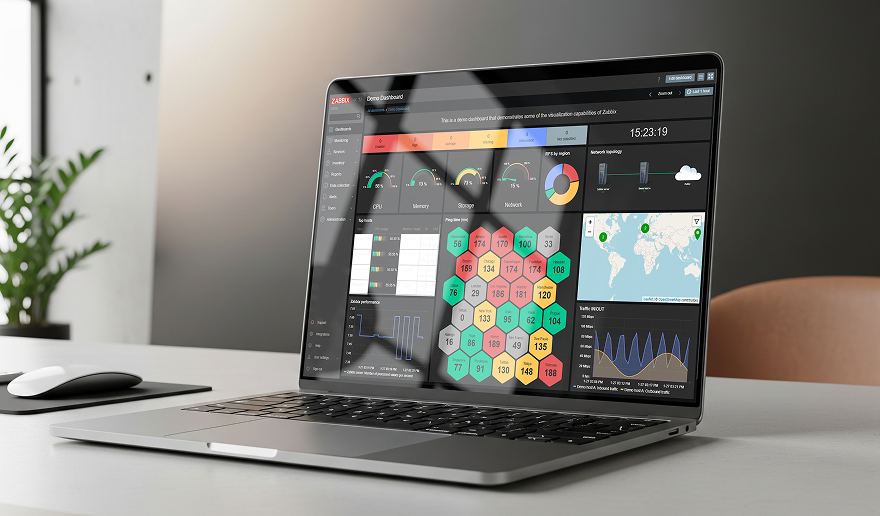
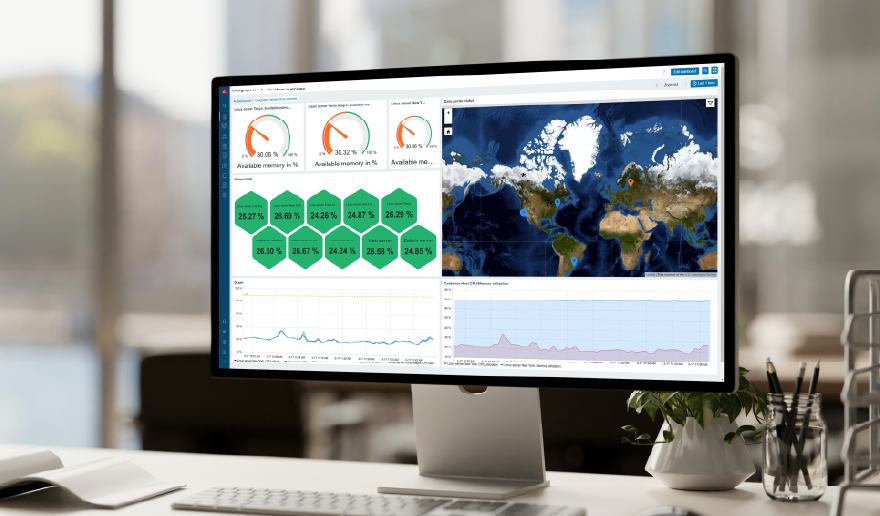
In this lab, let’s practice to create an on-screen report of the data (most recent metrics) which is very important for us.
This post represents one technique how to advance from functionality under:
“Monitoring” => “Overview”.
To create a report of the things you are fancy, we need to somehow mark those things. We need to mark items to belong under a specific application. The best way is to modify the name of an existing application and add some extra keywords inside. Please don’t create a second application. I will explain later why to not do so.
Here is a thought process of how to mark items under a single application.
Sample 1:
Total Memory
Total amount of CPU cores
Sample 2:
Current usage CPU
Current usage Memory
Sample 3:
TCP state ESTABLISHED
TCP state LISTEN
TCP state TIME_WAIT
...
It’s always only one application. Notice that each group has a common keyword: “Total”, “Current usage”, “TCP state”.
Now to list the data coming from a specific application:
- “Monitoring” => “Overview”
- Select “Data overview”
- Pick a “Host groups”
- Set an “Application”
- On the right top corner set Hosts location: “Left”
- Apply
It is always quite challenging to think of a naming system which is very independent and not overlapping. Good luck and keep “challenge accepted” running in your heart.
Of course, you can create an “extra” application for each item, for example, an application “Overview1”, but that will create a duplicate entry while browsing data under:
“Monitoring” => “Latest data”.
It’s possible to reach some limitations in the “Data overview” page if there are more than 50 entries to represent. We will see the message at the bottom of the page:
Not all results are displayed. Please provide more specific search criteria.
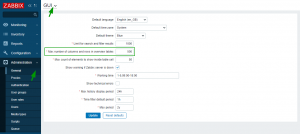
To solve this problem starting with 5.2 there is an option to configure the limit (default is 50):
On version 5.0 to customize this, have to modify ‘defines.inc.php’
# cd /usr/share/zabbix/include
# grep ZBX_MAX_TABLE_COLUMNS defines.inc.php
define('ZBX_MAX_TABLE_COLUMNS', 50);


 Prev Post
