There are a few ways one can gather custom metrics with Zabbix, for example, via user parameters or Zabbix sender protocol. While either method can work for simple metrics, creating a more wholesome approach (with data collectors, persistent connections etc) and interfacing it with Zabbix may not be as trivial.
With the HTTP agent item Zabbix can natively connect to RESTful web services, but the new pre-processing options, “Check for error” and the “Custom on fail”, take it a big step further. This allows us to create web services that can be directly used by Zabbix. To demonstrate we will create a very simple MySQL monitoring web service, returning the number of active and maximum connections.
Web service
The web service will accept POST requests containing MySQL database connection information and register the MySQL server in an internal cache. The service will periodically connect to registered servers and cache the required metrics. It will then respond with either cached metrics, empty data (if the metrics haven’t been cached yet) or an error.
Protocol
The POST request will contain the following JSON data:
{
  "username": "<mysql user name>",
  "password": "<mysql password>",
  "address": "<mysql server address>"
}
The response will have the following format:
{
  "value": {
    "connections": <number of active connections>,
    "max_connections": <number of maximum connections>
  },
  "error": "<error message>"
}
Depending on the cache state the value and error fields can be absent:
- Value is returned only if there are cached metrics (the first request will never return values because metric caching starts only after the request)
- The error is returned if metric caching has failed
Zabbix configuration
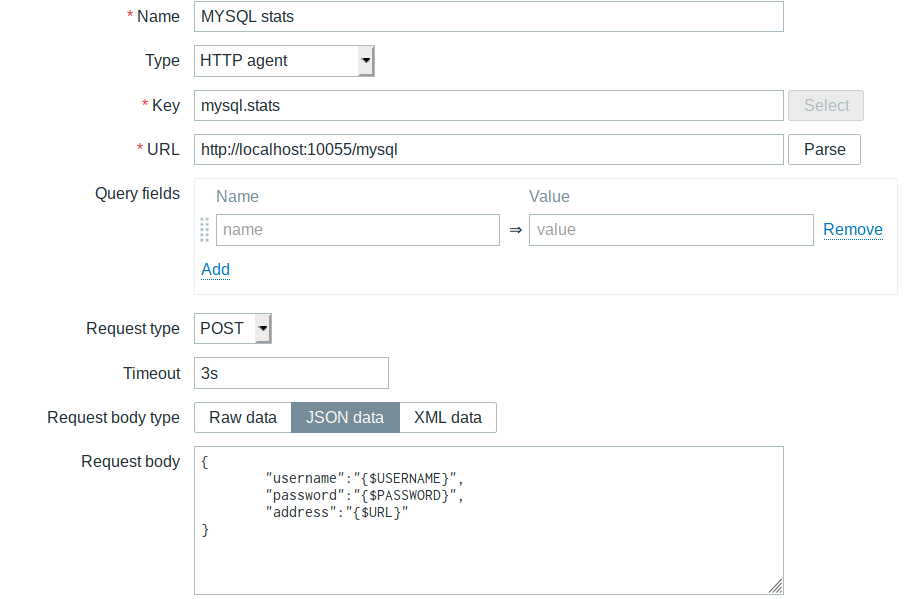
To obtain MySQL metrics you need to create an HTTP agent item ‘MySQL stats’ with URL pointing to the web service and JSON request body:
Next, we must change the type of information to at least character or text. As the data will be parsed, there is no point in keeping history of the original data, so set its history storage period to 0.

This will connect to our web service and retrieve a response. Now, with pre-processing we will configure Zabbix to parse the response contents:
- Check if the service returned an error – this is done by adding ‘Check for error in JSON’ pre-processing step
- Get the returned value – this is done by adding ‘JSON path’ pre-processing step. However, as the value is optional, we must enable ‘Custom on fail’ and set it to ‘Discard value’. Now the response without value will be simply ignored.
- Optionally, if we are interested only in metric changes, we can add ‘Discard unchanged’ pre-processing step. This will save some processing time and database space by ignoring all values that are identical to the last one.

This will properly handle our web service ‘error’ and ‘no data’ responses and return JSON formatted metrics in case of success. Now we must parse out single metrics from it.
In order to achieve that, you will need to create dependent item ‘MySQL maximum connections’ and set the ‘MySQL stats’ item as master item. Add ‘JSON Path’ pre-processing step with $.max_connections as parameter.Repeat this for ‘MySQL active connections’ item only changing JSON path to ‘$.connections’, and that’s it.