Learn how to build a geographically distributed monitoring solution based on Zabbix combined with other opensource tools like Elasticsearch, Percona, HAproxy, and PowerDNS.
Watch the video now (get the slides).
Contents
- Project goal (2:14:29)
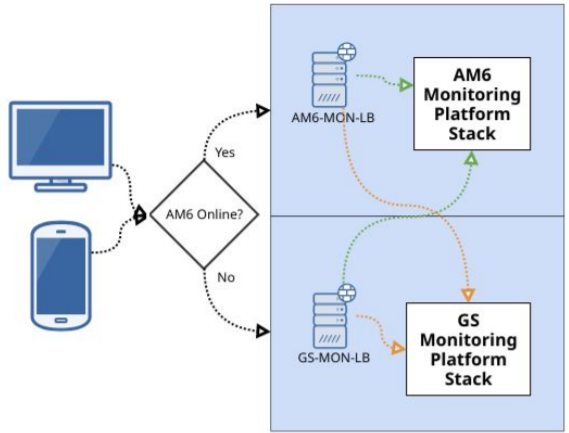
- Discovery and targeting (2:16:14)
- Plan on storage and failover (2:19:16)
- Other observations (2:37:01)
- Conclusion (2:37:01)
Project goal
I have been given a task to consolidate multiple monitoring environments in a way that supports a lot of users, less hardware, and more intelligent failover. It involves a huge number of external proxies connected to fewer servers that are divided into two data centers, and information is synchronized between those data centers. The idea is to have maximum availability by providing:
- uncompromised access;
- data duplication between two different physical locations;
- multiple components (Elasticsearch, Grafana, etc.);
- server duplication;
- failover and failback methodology;
- speed in communication.
The uptime of 99.99% seems attainable.
Project goal
Discovery and targeting
Our environment is not huge, but it is extremely diverse. When I performed initial discovery, it returned around 4,500 hosts, 650,000 items, 3 TB per year, and 250 users, but now we are on a different level.
Sentia is a leading provider in the Netherlands that consolidates smaller companies. Those smaller companies come with their own clients, mentality, applications, and different ways of seeing and asking the same things. As a result, there is the legacy of too many different products at the same time. There is a range of systems like Zabbix, Nagios, PRTG, AWS, Azure, and several сustom solutions. There are, however, no standards and no framework (e. g., ticketing, notification) to apprise everyone in the system. There is a lack of continuity and centralization, which should be addressed.
What about the characteristics that we want our system to have? One of the requirements is to use as many open-source products as possible. This way, we eliminate the need for expensive hardware and avoid creating the legacy of specific products. We want to have a fresh start and a different perspective.
The system should have all the popular features of tools like Zabbix, Grafana, Elasticsearch, Percona, and Ansible. Multiple data center and database support is also a necessity. We have to answer questions like how to keep ten years of data, how to send notifications to multiple systems at the same time, how to receive metrics from operating products, how to calculate SLA and SLR, and so on.
Finally, dashboarding is never too much. I want to be sure that data is displayed in the easiest way possible, so Elasticsearch and Grafana should enter into the mix to help with that as well. And, obviously, most of this is based on in-house integration.
Plan on storage and failover
Elasticsearch as storage
I was excited when I learned that Zabbix would be able to start writing into Elasticsearch, and I’ve spent a lot of time testing Zabbix against it. Obviously, using only Elasticsearch is not enough, there must be some other application next to it, like Percona.

Elasticsearch as storage
Failover
One method of failover is to isolate the entire platform in a single hypervisor, with all servers running at the same place. If information is kept in one data center, and the data center fails, the information should be available in the second data center. But can I be really sure that it works?
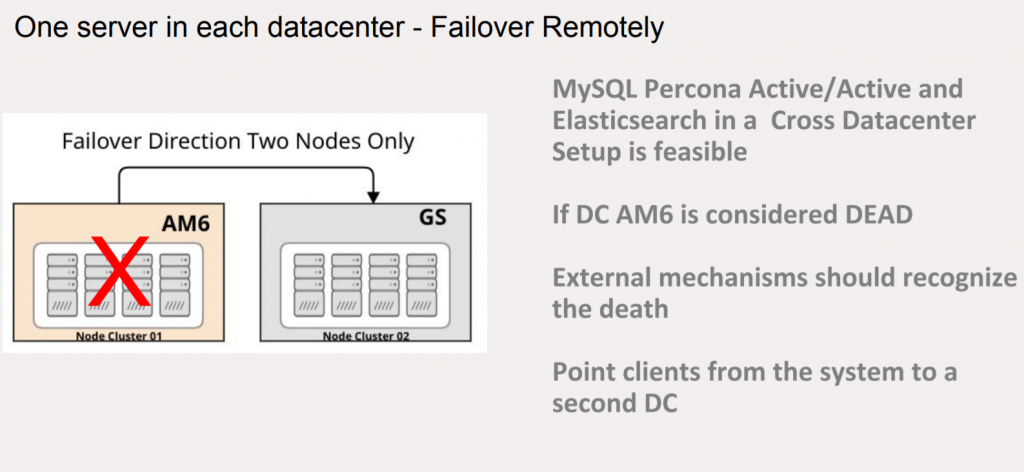
Only remote failover
The other method is to build failover in the same data center with two hypervisors. When these two hypervisors fail, the second data center is used, with two more physical services to get the data back. Obviously, it is a much more expensive solution because four large independent servers are required.

Local and remote failover
Data independence
As for data independence, if a Zabbix server writes data into Elasticsearch and Percona at the same time in one data center, it should be synchronized to the other data center with standby servers. Zabbix is unable to run Active/Active at any moment, so you should make sure that data is available at any moment and when the main server crashes you can follow back to the other set of clusters that contain the same data. That’s what we achieved.
Final setup per DC
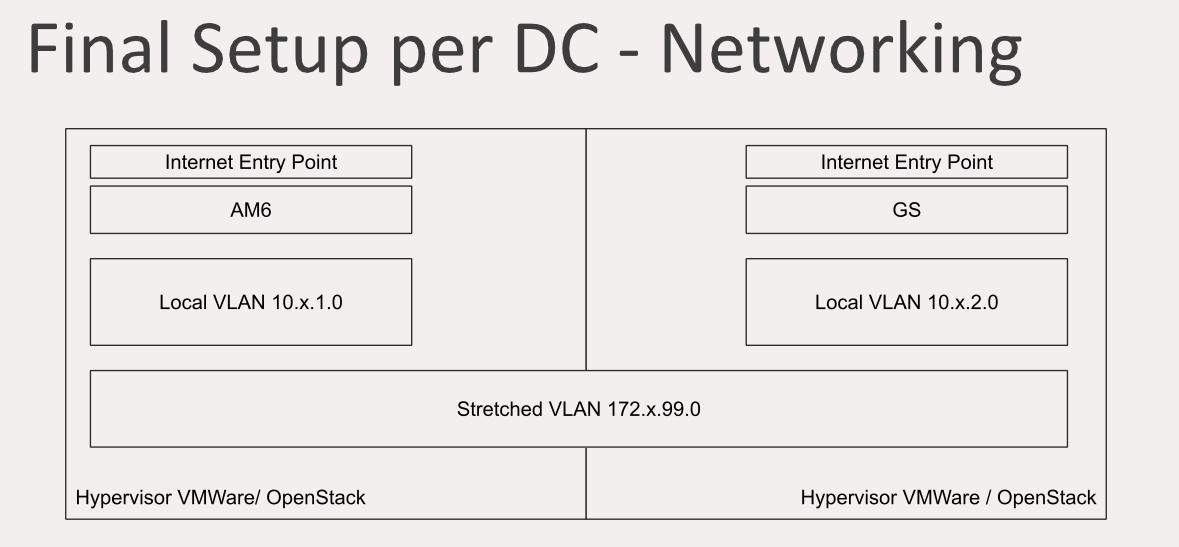
How did we do that? First of all, there is an Internet entry point in one of the data centers that have local VLAN with accessible servers. There is stretched VLAN between the two data centers where data is sent to synchronize Elasticsearch and MySQL, and all the components communicate with each other only inside the stretched VLAN. The standby data center also has an Internet entry point and its own local VLAN.
This is the point where separation starts. Only one Zabbix installation is not enough — there should be Zabbix for our own infrastructure inaccessible to clients, and there should be the Zabbix for clients with its own interface. We have a whole bunch of teams dealing with different clients at the same time. Everybody uses what we call the global Zabbix but at the same time the global Zabbix can be multiplied. So it’s feasible to have multiple Zabbix servers running concurrently.

Different Zabbix for infrastructure and clients
All the data sent to these servers is being shared on stretched VLAN synchronizing the data underneath.
Final setup per DC
Different basic MySQL DB names should be used — it’s something that is widely accepted and performed just by means of configuration. It is also possible to use custom ports, so multiple Zabbix servers running simultaneously can be separated just by changing the port number. Custom hosts can be separated in the front end depending on their paths and names.
On the other hand, Elasticsearch can only run with one server and one index by default, so two Zabbix servers would have the same name. To change it, I created a fix which you can find here. It allows adding configuration prefix in front of an index and also fixes the issue with the front end (Elasticsearch requires pointing the front end to it).
Talking about issues, what happened is errors started appearing when I put too much pressure on Elasticsearch. Some are unrecoverable but, fortunately, most are not.

Elasticsearch error log
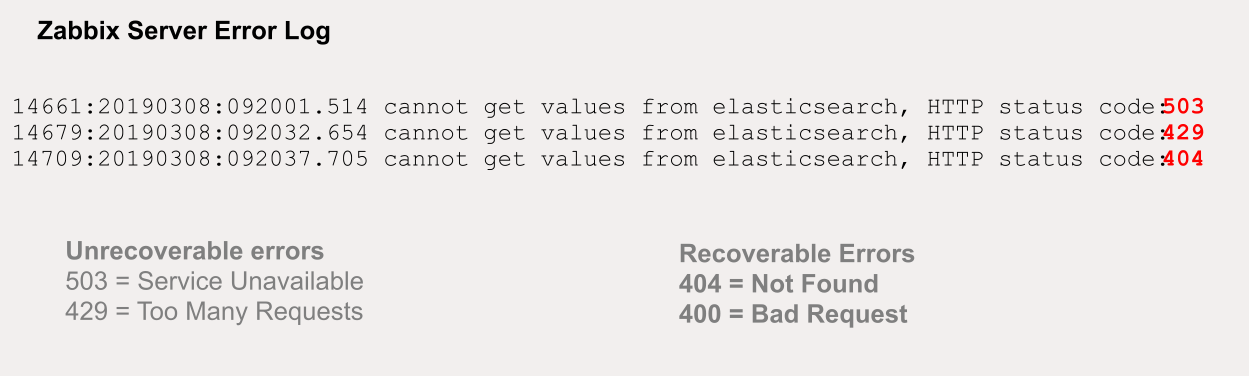 Recoverable and unrecoverable errors
How is this recoverable? Elasticsearch accepts headers with a certain specific size by default, which is 4kb. As Zabbix is dealing with large amounts of data against Elasticsearch and there might be huge queries, the header size should be increased to 16kb.
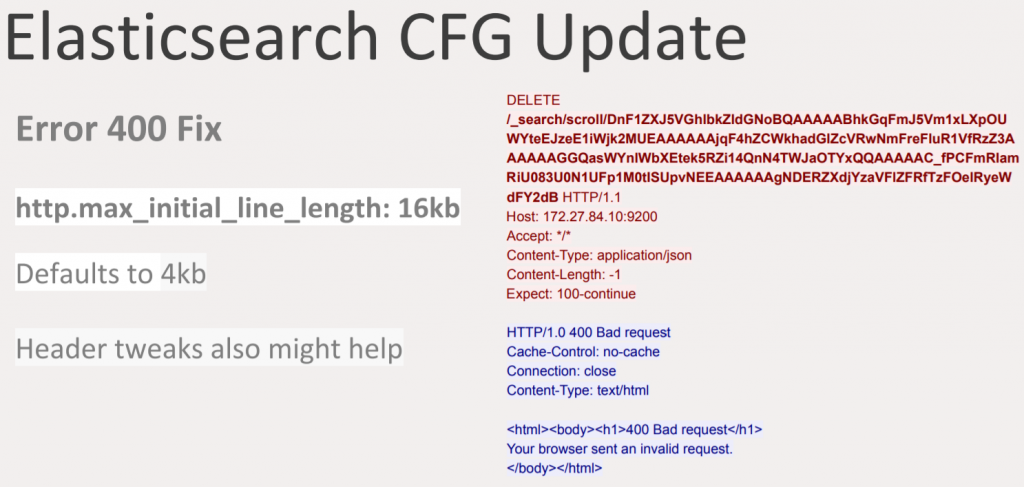 Elasticsearch CFG update
This update will help to get rid of some errors. Some errors are mostly related to the fact that Elasticsearch needs to flush the data and get the available data back to the Zabbix server, and it may take some time. However, if an error is not recoverable it will dissipate during the operation and data becomes more available.
You will also notice that bulk items will appear on the log as well, but it’ll get more stable with time.
Pacemaker
There is also the question of not allowing standby Zabbix servers to run at the same time because it would corrupt the data. Pacemaker is mostly used to manage the servers.
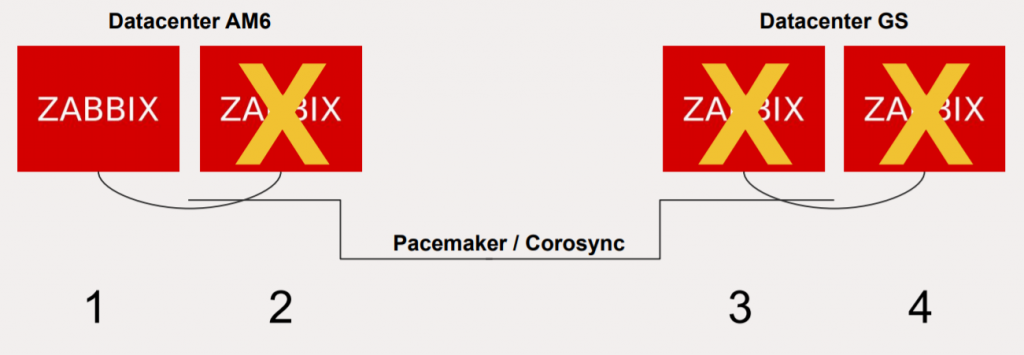
Pacemaker/Corosync management
There are two options, either to use stretched VLAN for communication inside one huge Pacemaker cluster and having the four servers discuss the priority or to use Corosync, the feature from Red Hat Linux.
Multiple front ends
Continuing with the approach of access, there are two DNS entries that follow into the HA proxy. The HA proxy recognizes the virtual hosts and delivers them to Apache servers which have the virtual hosts point to different interfaces inside the system. On the diagram below the green blocks represent a single Apache host with two virtual hosts.
In each data center, two Apache servers are running two interfaces per type. It is possible to run more than two because virtual hosts can be simply replicated with different names, but new directories should be created.
 Multiple front ends
However, it doesn’t work out of the box. To configure that, follow the instructions below (for version 4.0.3).
 Zabbix front end changes
If you are using my patch for Elasticsearch, do not forget to add the history prefix. It will allow separating each index from the specific front end it collects information from.
Front end access layer
This is one of the most important things.
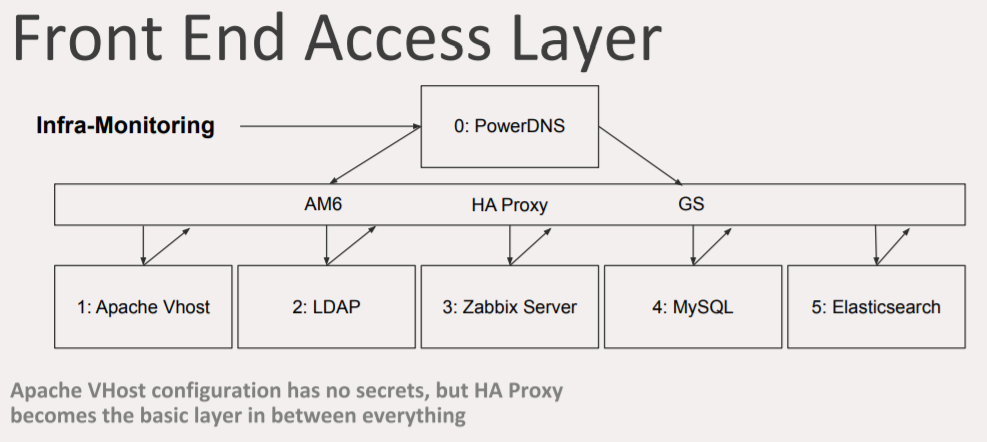 Front end access layer
There is the DNS entry and two data centers underneath it. Many people think that load balancing means to have a DNS entry with two IP addresses. In this case, it will take five seconds to change between A and B again and again, but this is not a viable solution for failover.
Instead, I have a DNS entry, called the LUA address, using PowerDNS. PowerDNS is a DNS server with advanced features, a database, APIs, and also LUA RR support. If you are using an HA proxy, you can utilize the LUA monitoring feature which allows you to add certain specific entry with accounting logic. For example, PowerDNS with LUA will change the IP address if the health check on your servers is bad. Compared to f5 GTM, this solution is also completely free, which is an advantage.
 PowerDNS with LUA
There is also the HA proxy layer. There can be two independent HA proxies communicating with each or one HA proxy that stretches between two data centers. The idea is to separate them to have independence. Every device you communicate with will communicate back to the HA proxy using technologies similar to PowerDNS to figure out which server is up and which is down based on DNS addresses.
MySQL Percona
MySQL Percona can operate in three modes: Active/Active, Active/Passive, and Active/Slave. In the Active/Active mode, the data is written to both systems at the same time, and failover is quite transparent. In the Active/Passive and Active/Slave modes, the data is not written simultaneously, and failover requires a bit more work.
There is a problem when using Percona XTraDB, however, called the BF-BF X lock conflict. The problem is very random. I was not able to figure out where it comes from, although I didn’t investigate it a lot. I assume it has something to do with deleting rows.
 MySQL Percona XTraDB problem
My solution to this was using Percona in the Active/Passive mode to decrease the pressure. Data synchronization is still undergoing, but the difference is that using the Active/Active cluster implies that the data are checked to be totally similar.
Migration steps
In our case, the migration plan looked like this:

Migration steps
Other observations
While building and operating a large multiple data center environment, I also made the following observations.
- Running multiple Percona nodes requires an Arbiter per group of clusters.
- One Pacemaker can be stretched between data centers, or two Pacemaker clusters can be created controlled by a Booth Cluster Ticket Manager.
- Elasticsearch can run in CSS (cross-cluster), or if the latency is very low one cluster can be stretched.
- Kibana, Grafana, Zabbix front end, and other web services can run on the same server as multiple instances.
- All communications for the internal components are done via stretched VLAN.
- Servers and configurations can be deployed using Ansible for ease of management.
- MySQL load balancing via the HA proxy required advanced techniques for node availability checks.
- Ingestion pipelines can help with new methods of Elasticsearch index rotations.
- Grafana has compatibility issues with Elasticsearch.
Conclusion
To sum it up, a working multiple data center environment is feasible. This setup can help multiple forms of failback thanks to flexible configuration. Remember to make small changes to the architecture to quickly recover if you don’t like the result. Elasticsearch works better for environments with less data. Percona in the Active/Active mode is not perfect, but it is promising. Increasing all proxy buffers will help avoid data loss with changes on the server, failing over or doing changes for updates and unpredictable load changes. Make sure that all the data centers are as independent from each other as possible.
Thank you for your attention!