


Monitoring large and distributed networks poses relevant challenges to Zabbix administrators as it requires to analyze different and complex failure scenarios. Simple approaches can help to improve default templates to get rid of notification floods, false positives, and other misleading alerts, and to let Zabbix driving you to the right root cause.
Contents
I.Introduction (0:29)
II. How to (2:43)
1. How to determine if the server host is alive? (2:46)
2. How to detect Zabbix proxy failure? (11:28)
3. How to detect Zabbix Server connectivity issues? (13:35)
III. Conclusions (15:13)
1. Lessons learned in MSP environments (15:33)
Introduction
From this post, you’ll find some solutions to problems, which arise in distributed environments such as a flood of notification, false positives, and flapping alarms based on a three-year project with Bitech — an Italian managed service provider.
Bitech, as well as any monitoring provider typically deploys a single central Zabbix Server instance to monitor several independent remote customers.
 Typical MSP scenario
Each customer has one or more Zabbix proxies deployed into their local network. Often these are “active” proxies connecting to the Zabbix Server over the Internet or some other unreliable connection. This model is often known as Monitoring-as-a-Service (MaaS) model.
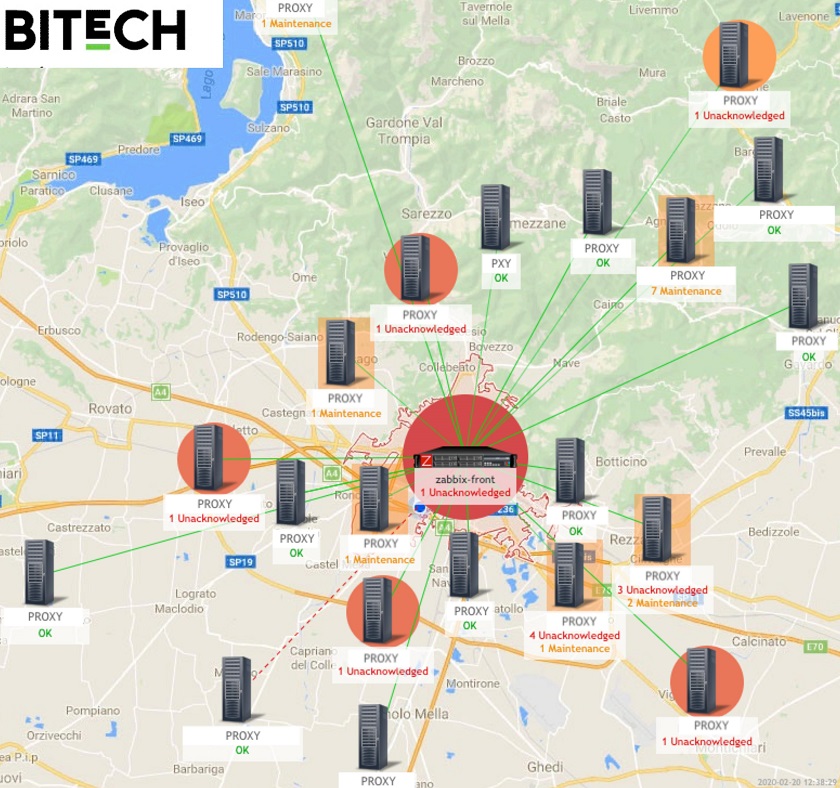
 Bitech monitoring scenario
False positives and notification floods
Customers need to receive notifications when problems arise. However, if more than five or ten percent of total notifications are false positives, users generally stop trusting information from Zabbix. Most likely, they will create inbox filters to get rid of Zabbix messages.
- False positives undermine monitoring system reputation among your users.
- Notification flood makes your monitoring system inefficient.
To address these issues we need to start from the very beginning.
How to…
How to determine if the server host is alive?
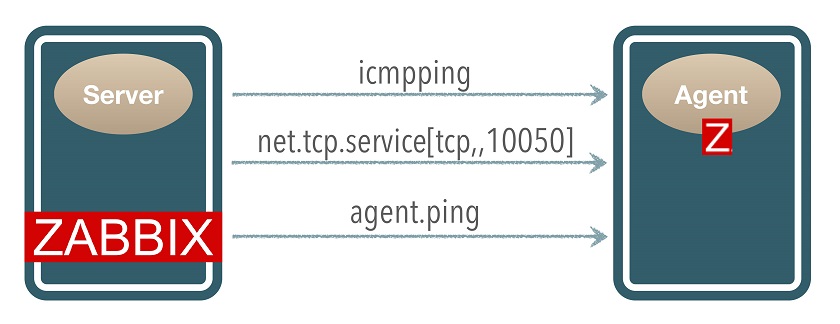
In most monitoring systems, you need to ping to find out if a server host is up or down. In default Zabbix templates, agent.ping is used to check a host availability.
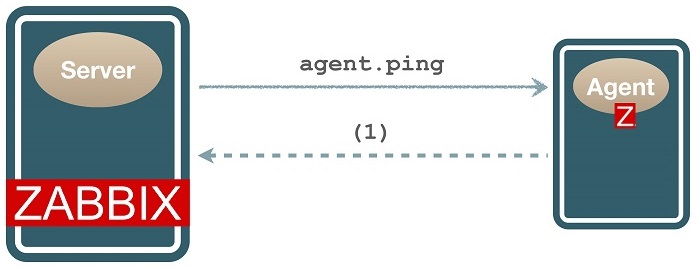
agent.ping
Here, we need a nodata function to detect problems, so that is if no data is received, for instance, for 5 minutes, the alarm is triggered.
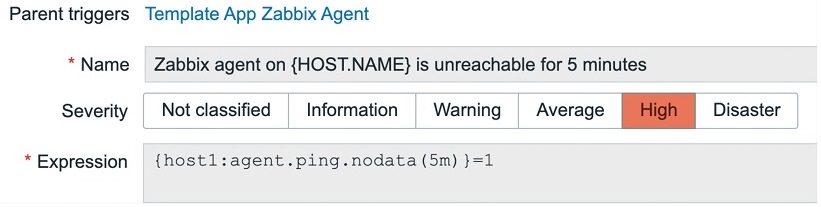
Nodata function
Actually, this trigger allows for catching many problems: the host is down, the agent is down, the agent is up but unresponsive, and so on. So this method looks better than pinging, as it allows for catching a lot of problems with one single check, however, the root cause remains unclear.
Moreover, if a Zabbix proxy, which is monitoring many agents, goes down, this trigger will fire for all monitored hosts, generating a notification flood.
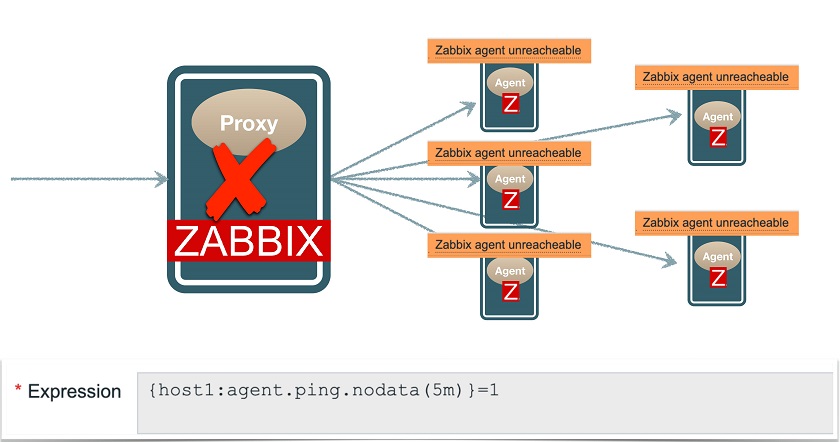 Triggers fire when proxy is down
The problem is that agent.ping.nodata( ) function also triggers in case of non-agent problems. For example:
- if Zabbix Proxy is down,
- if Zabbix Server has connectivity issues, or
- if Zabbix Server has performance issues.
There are different solutions to this problem:
- Triggers dependency, though it requires a lot of manual work;
- Implicit trigger dependency (ZBXNEXT-1891);
- Hosts dependency (Zabbix > 5.0);
- Event correlation.
A combined approach
But we don’t have to deal with complex solutions. We can make things easier, for instance, by using multiple items to check what’s happening.
 Multiple items
Combining data from these three items we can determine the source of the problem.
 Combined approach
Moreover, separated triggers allow us to send notifications to the right people.

Notification targeting
Note the situation in the gray row, which was causing the notification flood: here it won’t notify anyone.
Triggers
Let’s see how to implement in Zabbix the triggers described in the previous section. I will assume you already created the three items in your template.
1. ‘Host is unreachable’ trigger

The trigger expression: {host:icmpping.max(3m)}=0 and{host:net.tcp.service[tcp,,10050].max(3m)}=0
Note thai in case of failures, icmpping and net.tcp.service return a ‘0‘ value, so you don’t need to use nodata().
2. ‘Agent service is down’ trigger

Trigger expression: {host:net.tcp.service[tcp,,10050].max(30m)}=0
NOTE. You need to configure a dependency with the ‘Host is unreachable‘ trigger to avoid duplicated alerts.
3. ‘System is overloaded or frozen’ trigger

- We can connect to the agent TCP port. → the host must be up, the agent must be up.
- We do have data for icmp item. → the proxy/server chain is working.
- We have no data from the agent. → the agent is unresponsive: the system must be blocked or overloaded.
Problem expression:
{host:net.tcp.service[tcp,,10050].min(1h)}=1
and {host:icmpping.nodata(3h)}=0
and {host:agent.ping.nodata(3h)}=1
Recovery expression (recommended);
{host:agent.ping.count(30m,1)}>10
we need to receive at least 10 ping from the agent in 30 minutes to recover this trigger.
NOTE. Remember to choose large time intervals in trigger expressions to avoid flapping and some unobvious race conditions.
How to detect Zabbix proxy failure?
So far we have prevented notification floods from agents when a proxy goes down. However, we still need to be informed that the proxy is down.
Detecting active proxy failure
A remote active proxy often sits behind a firewall and doesn’t accept direct connections from Zabbix Server. If a proxy is unreachable, we simply observe a lack of data.
 Proxy is unreachable
Zabbix provides the internal item: zabbix[proxy,{$PROXY_NAME},lastaccess] (not used in default templates), which returns the last access time your proxy is connected to the Zabbix Server. So, you can process it with the fuzzytime() function to trigger if, for instance, the proxy is not available for more than 1 minute.
![]() ‘No connection from proxy’ trigger
‘No connection from proxy’ trigger
Trigger expression: {proxy1:zabbix[proxy,{$PROXY_NAME},lastaccess].fuzzytime(1m)}=0
Of course, it could mean that:
- Proxy host is down, or
- Proxy service is stopped, or
- Proxy site is unreachable (network or power outage).
Remote proxies: best practices
1. Keep the proxy host itself monitored, using the agent.
2. lastaccess requires a proxy name parameter. I recommend to use macros, and ensure that the item gets evaluated, i.e.:
{myproxy1:zabbix[proxy,{$PROXY_NAME},lastaccess].nodata(24h)}=1
=> Trigger: “Cannot determine proxy last access time”
3. Monitor proxy connectivity: ping its router from Zabbix Server for rapid troubleshooting.
4. Use passive proxies, if allowed by security policies.
How to detect Zabbix Server connectivity issues?
We addressed agent and proxy failures. What about server failures? What could you expect, for instance, if the Zabbix Server connectivity goes down? In this situation, a lot of “No connection from proxy” alarms will be triggered. Of course, the Zabbix administrator, which receives all the alerts and has the “big picture” could easily guess that there is an issue on Zabbix central server. However, individual customers will get this notification as a false positive, because actually there are no issues on their networks.
 Zabbix Server connection problem
The idea is to make Zabbix server auto-detect connectivity issues by pinging three different hosts, for example, its LAN gateway, its WAN gateway, and a third-party public host on the internet. If two of them are down, you might say that the Zabbix Server is isolated from the network, and it should not notify connectivity issues regarding proxies.
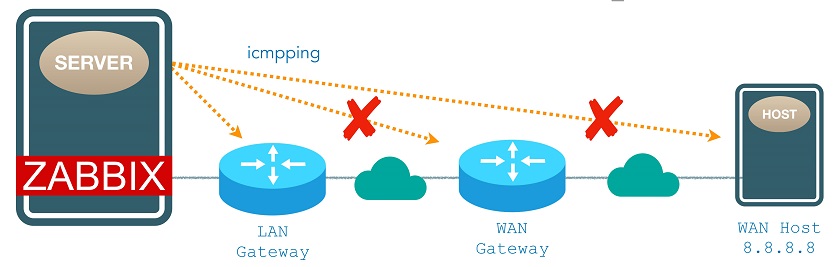 Zabbix Server pinging hosts
The trigger expression will look something like this:
{zbxsrv:icmpping[{$WAN_GATEWAY}].last()}=0
and {zbxsrv:icmpping[{$WAN_HOST}].last()}=0
Now you simply need to configure a dependency between the Zabbix Proxy template trigger and Zabbix Server template trigger:
 Zabbix proxy trigger dependency
NOTE. In many cases, an isolated server will not be able to send out notifications. However, depending on mail system configuration, mail notifications might be queued and sent later when connectivity is restored.
Conclusions
- A simple yet robust approach
- Tested on a wide range of deployments for 3+ years
- All logic stored into templates (no manual configuration or tuning needed)
Main benefits:
- More precise notifications
- Reduces false positives
- Prevents alert floods on distributed environments
Lessons learned in MSP environments
1. Do not overwhelm users
- PKI: Number of alerts /per user /per day
- Recommended (human-sustainable): < 20
2. Inform users about changes
- Users expect a predictable and consistent behavior
- Keep them informed about changes to monitoring service:
• New hosts (auto-registration)
• New discovered entities (LLD)
• New triggers
• New thresholds
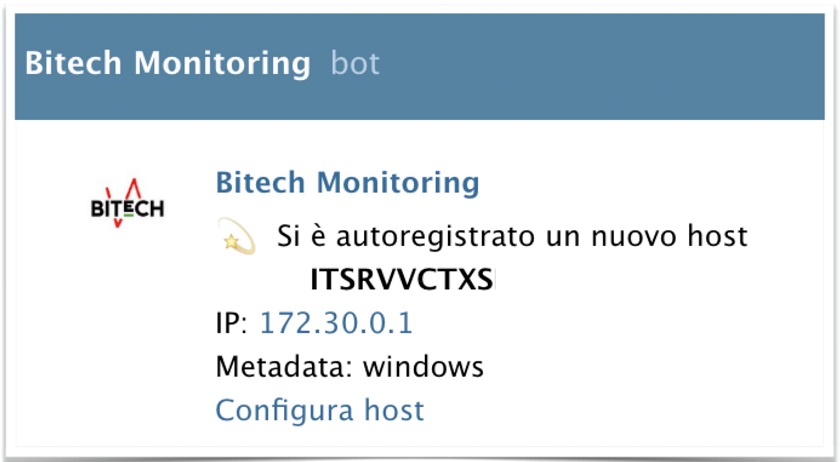
Informing customers
3. Adopt a consistent severity classification
- Applied through all your templates.
- Based on “objective” criteria.
- Associable to intervention priorities.
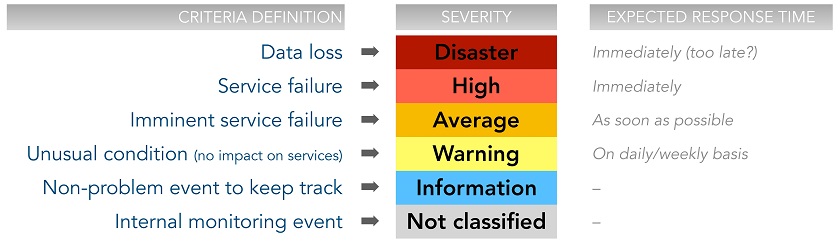 Consistent severity classification
Thank you for your attention!


Hello Thank you for this information. I found it very helpful. But I am having a problem when trying to create the trigger “System is overloaded or frozen”. When I click add I get the error “Trigger ‘System is overloaded or frozen’ belongs to templates with different linkages.” and am unable to save it. Do you have any idea how to fix this issue and have you experienced it yourself?