


How Netco Technology automated the deployment and management of multiple Zabbix installations.
Watch the video now.
Contents
- Introduction (00:08)
- Installation (08:05)
- Configuration (10:11)
- Host management (14:53)
- Maintenance (19:17)
- Item cleanup (23:06)
- Dependencies (24:53)
- Alerts (26:33)
- Reports (28:21)
Introduction
I want to tell you how we worked out a way to fully automate our Zabbix installations. We are currently using a lot of different Zabbix machines, which prompted the need for a more automated installation process. I’d like to explain how we did it and why, and what you might learn from our experience.

Netco is a network infrastructure provider, which means that we build and maintain networks for various customers. A couple of years back, we started building networks for some of the bigger retailers that need wide-area networks (WAN) to interconnect hundreds of devices across many different sites. They also want to connect into networks for third parties, like suppliers or head offices, so a centralized WAN is necessary to manage the network traffic.

Our networks were so popular that we started marketing them separately as Retailstekker, which in Dutch means ‘a retail plug’. The idea behind the name is that we plug customer locations into our network and take care of managing them. Payment transactions, printing, point-of-sale devices, etc. are all interconnected within the network.
Technology overview

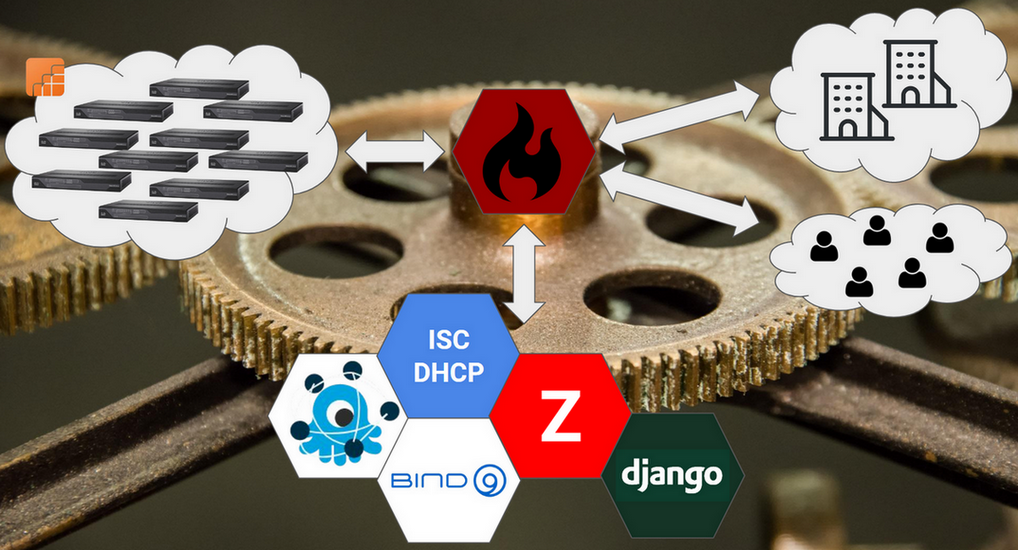
The tech stack that we use to build Retailstekker networks is based on the technical components you can see in the picture above, with the addition of Python scripting. We use SaltStack as our main automation engine and orchestration tool, but I’ll try to give a high-level overview so that you can do the same things using Ansible, or Puppet, or any other tools.
Retail network
A Retailstekker network consists of hundreds of locations. All those locations have a router device, typically a Cisco router. The routers make up a WAN that is connected to our central data center. There is a central firewall that secures all incoming and outgoing connections. From there, a link can be established to your head office or a third-party supplier. Also, VPN access can be provided to users so they can access all devices on-premises.
All this is made possible thanks to a tech stack comprising different products. FreeRADIUS is used for location authentication, DHCP and BIND serve to provide network services to the locations, and monitoring is performed by Zabbix. On top of Zabbix, we built a Django-based dashboard that the customer uses to get an insight into their current network status.
Client dashboard

Client dashboard
The dashboard shows the number of locations that are currently running on a normal DSL or fiber uplink. It also displays the number of locations using 4G fallback or LTE in case those locations cannot establish a DSL or a fiber connection. To visualize this information, we display a map of all locations and color-code the status of each site.
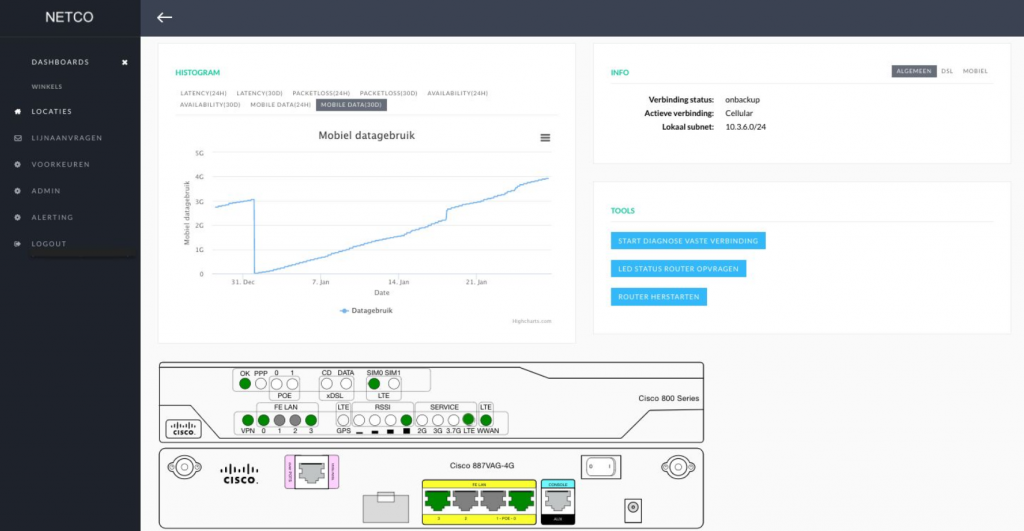
Location status dashboard
If the customer wants to know more about a certain location, they can click on it to see the latency status of the on-site device, the amount of 4G data used, and also run various diagnostic tests. The graph shows how long the selected location has been using the cellular connection, allowing the customer to keep an eye on their paid data usage.

Party monitoring
Some time ago, we also integrated party monitoring into the dashboard. Now, when a customer has suppliers that they need to keep in contact with over a VPN tunnel, we can provide Zabbix monitoring, so they can quickly check the status of specific suppliers. This way, we have a high-level overview of whether the connections are in order.
NOC dashboard
All customer locations are interconnected in the WAN, and the WAN is monitored by Zabbix. In fact, each customer gets their own network and their own Zabbix server, which means there are multiple setups. To keep an eye on all of the Zabbix servers from our NOC, we use Grafana as a single dashboard to fetch the metrics, see alerts, and monitor the Zabbix servers.

VPN dashboard
This is the dashboard that we use to monitor the number of VPN nodes that are currently up and those that are down or in maintenance. As you can see, all alerts for all Zabbix servers are displayed on one screen.
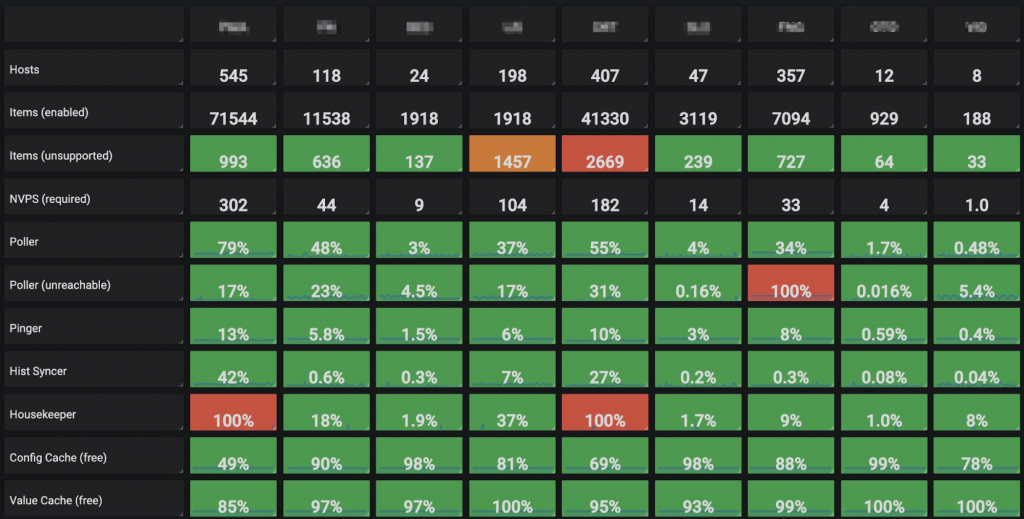
Zabbix servers dashboard
We also monitor the Zabbix servers themselves from Zabbix. On this page, each column represents a Zabbix server, displaying the processes and cache data, the number of items, etc. This is how we keep an eye on Zabbix instances that we are building for our customers.
Installation
This was just a little bit of background so that you know the reason behind having so many Zabbix servers and to give you a better idea of why we need automation.
If you have tens of Zabbix servers, maintaining them by hand is going to be a hassle. This is why we set up all of the automation to install the Zabbix server, configure, and then tune it.

Installation
For the installation, we wrote a Python script that asks for:
- customer’s name,
- environment number (used to differentiate between customers),
- IP addresses, etc.
It will then automatically generate passwords that will be used in the environment.
Once the data is input into the script and the deployment is confirmed, the SaltStack server starts talking to one of the KVM machines that then starts up a Zabbix instance, among other things.
Once the Zabbix server is booted, it will contact the SaltStack server, establishing an agent-server relationship. The SaltStack server will make the Zabbix server:
- register with Katello (package management system),
- register with FreeIPA (identity management system),
- start installing the Zabbix software.
Once that is done, we pull in our custom code from GitLab to sync to the local disk.
Configuration
This leaves us with an installed Zabbix server. Now we want to start digging into the Zabbix system itself and start configuring it fully automatically.
One of the first things to do is set up FreeIPA as the authentication mechanism for the servers. Additionally, LDAP is set up as the user back-end, so that our customers can use a regular password. All this requires a SQL update. Once a SQL update is supplied, and we run this from SaltStack, the customer can start using LDAP from the Zabbix web interface.
Enable Zabbix LDAP authentication:
mysql_query.run:
- database: zabbix
- query: "UPDATE config SET authentication_type=1,
ldap_host='ldap://{{ ldap.host }}', ldap_port={{ ldap.port }},
ldap_base_dn='{{ ldap.basedn }}', ldap_bind_dn='{{ ldap.binddn }}',
ldap_bind_password='{{ ldap.password }}',
ldap_search_attribute='{{ ldap.search }}'"
With the authentication back-end in place, we can start defining the media. This is done via a SaltStack file, which tells the server to set up an email media type.
Configure Zabbix email media type:
$ cat /srv/salt/zabbix-server/mediatypes.sls
zabbix_mediatype.present:
- name: 'Email'
- mediatype: 0
- smtp_server: localhost
- smtp_helo: {{ salt['grains.get']('id','localhost') }}
- smtp_email: '[email protected]'
We then proceed to configure different user groups — Admin and User. The Admin group comprises API users and Support (our engineers). And then there is the Users group, which is used to give the customers access to Zabbix. Of course, our customers use our dashboard instead of the actual Zabbix front end, but we use this group e.g. to assign media types to users.
People using Zabbix with LDAP can find it a bit of a hassle that each user still needs to be created in the Zabbix front end. We’ve automated this process with a SaltStack command that uses getent to fetch all users in a Zabbix user group, then loops around all of those users, creating each one automatically.
$ cat /srv/salt/zabbix-server/users.sls
 {%- for username in salt['cmd.run']("getent group \
'grp-zabbix-users'").split(':')[3].split(',') %}
Zabbix user {{ username }}:
zabbix_user.present:
- alias: '{{ username }}'
- passwd: ''
- password_reset: False
- usrgrps:
- Support
- medias:
- mediatypeid: {{ salt['zabbix.mediatype_get'](name='Email') }}
sendto: '{{ username }}@example.com'
active: 0
severity: 63
period: '1-7,00:00-24:00'
{%- endfor %}
After that, SaltStack will install all of the external scripts and notification scripts from a GitLab repository. That means that once a new version of a script is committed, it’s automatically deployed to all of the servers.
$ cat /srv/salt/zabbix-server/scripts.sls
external-scripts:
git.latest:
- name: https://gitlab.local/zabbix/external-scripts.git
- target: /opt/zabbix/scripts/external
- force_reset: True
- require:
- pkg: git
The same trick is used for synchronizing templates. Every template is put in the GitLab repository; and whenever SaltStack is run on the server, the Git repository is pulled into the local file system on the server disk. If there are changes, then a Python script is used to import all of the templates recursively.
$ cat /srv/salt/zabbix-server/templates.sls
templates:
file.directory:
- name: /opt/zabbix/templates/
git.latest:
- name: https://gitlab.local/zabbix/templates.git
- target: /opt/zabbix/templates/
- require:
- pkg: git
cmd.run:
- name: /opt/zabbix/scripts/template-import.py -v -T /opt/zabbix/templates/
- runas: zabbix
- onchanges:
- git: templates
The specific directory structure shows us which templates are loaded first, making it possible to import various levels of templates recursively. If there is a template that uses another template interlinked, we walk through the directories one by one to make sure that the templates are all imported correctly and in the order.
Host management
This leaves us with a Zabbix server that is running all of the Zabbix software and has all scripts and templates. The next thing is to set up hosts for monitoring.

Host groups
Host groups must be defined before adding hosts. There are two categories of host groups pushed from Salt into Zabbix. Standard groups, written in white, are used for a variety of purposes. For instance, Branches would contain any hosts that are located in branch offices, and Servers would include the Zabbix server itself intended for monitoring. The blue ones (Predeployment, Maintenance, Offline) are used for maintenance. There are also the Device groups, which contain all devices in the customer’s locations.
Hosts can be added to Zabbix using SaltStack. After the host is defined in SaltStack, it is created in Zabbix. We can also push macros and templates so that each time SaltStack runs, any host that is missing from the system is added automatically to Zabbix.
zabbix.hosts:
- name: google-public-dns-a.google.com
label: Google DNS1
ip: 8.8.8.8
groups:
- 3rd Parties
macros:
- '{$TIMEOUT}': 180
template: "t_availability_ping"
Lower-level host management
The previous approach is mostly used for branch offices or third parties. For the hundreds of separate shops, there is a quicker method that involves a Python script named infrabuilder. The Python script uses an HTTP API call to our central configuration management database (CMDB). The CMDB contains the locations of all hardware that we have for this Retailstekker product.
The script fetches the locations of a customer, using this information to:
- create DNS records,
- create FreeRADIUS records,
- create DHCP,
- grab configuration files for switches and put them on the TFTP server,
- communicate with Zabbix.
Every host in the CMDB is eventually pushed into Zabbix. If a host is removed, e.g. because the contract is canceled, it’s automatically removed from Zabbix by the same script.
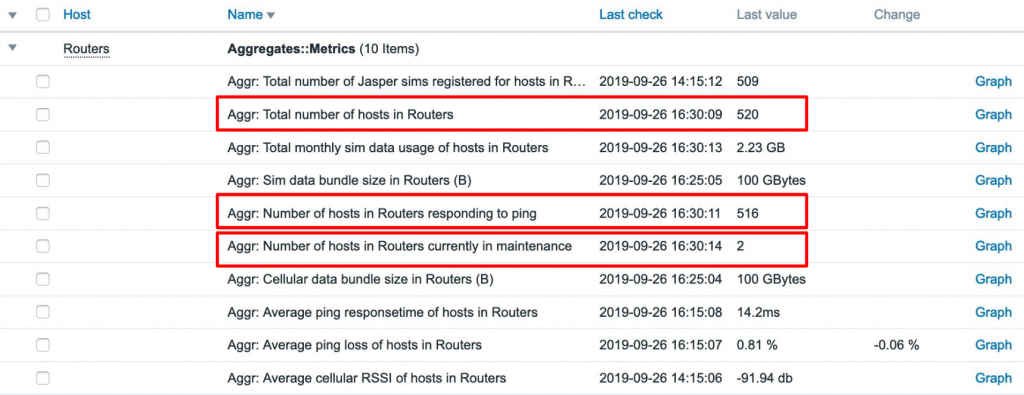
Aggregates
Finally, there is also the Aggregates host category. SaltStack creates an aggregate for each of the device groups; so creating a device group for routers automatically creates an aggregate host, tracking the number of routers in the group. Zabbix will start to monitor how many of those are responding to ping and how many are in maintenance. This gives us a high-level overview of the status of each separate shop.
Maintenance
With a fully functional Zabbix system in place, it is important to minimize further human input and potential issues. This is achieved by automating the maintenance of the system too.

Maintenance periods
There are three maintenance periods in Zabbix, each with data collection. Putting a host in one of them means that it’s being monitored, but will not send alerts.
What is the purpose of having three different maintenance periods? Once a host is imported by infrabuilder, the script puts it directly into the Predeployment maintenance. That means that every new location can be set up for monitoring in Zabbix immediately, even if the router is not delivered yet. Because new locations are in maintenance by default, our engineers will not receive any alerts.
This gives us time to ship a router to a location, usually eight hours. If a router has been up for more than eight hours, it’s automatically removed from the Predeployment maintenance. This way, we can put new hardware into Zabbix and know that it will start monitoring as soon as the connection is up.
Then there is the Offline maintenance. There is a script running in the background to double-check if a host is not responding to ping for a predefined time. We found out that a lot of our customers will turn off their equipment for purposes like redecoration, without informing us, and we kept seeing shops that were down for a month, hogging up resources and indicators on the dashboard, when in fact nothing was wrong. These hosts are put into the Offline maintenance instead after seven days, and their status on the dashboard is set to unknown. When a shop comes back online, it is removed from the Offline maintenance.
The third type of maintenance is for our engineers. When an engineer is working on an issue with a router, the router is put into the Maintenance group, so that the customer won’t get any alerts on the host. Once the issue is resolved, the engineer removes the host from the group manually.
Item cleanup

Item cleanup
For every unreachable host monitored with SNMP, Zabbix will still try to read metrics, system information, etc. If there are hundreds of such hosts, Zabbix will have to spend a lot of time trying to figure out if the items are still reachable.
This prompted us to create a Python script that checks if a device is pingable. And if the device is not pingable for a specific time, the script will disable all polling items for SNMP, HTTP, agent, etc., except for ICMP and trapper items. This frees up the poller so it’s no longer trying to reach an unreachable host. And if the host starts responding again, the polling is enabled through the same script.
Dependencies
Picture the following common scenario: there is a shop where the customer has a router, with a switch behind it, and a few access points used to provide Wi-Fi connection in the shop. When the router is down, we want Zabbix to only alert us once, without sending any alerts that the switch and the access points are down as well. This means that we need to define dependencies, but this is typically done manually.
Instead, we wrote a script for this process. From our CMDB, it syncs things like contract numbers for each location, so every device on that location in Zabbix has an inventory field storing the same value. This inventory field shows that all of these devices are in the same location, eliminating the need for network discovery.

Assigning dependencies
Based on the contract number, we know that the access point is always going to be connected to a switch, and then a switch is always dependent on a router. The script will create trigger dependencies automatically between all of these types of devices.
Alerts

Alerts
Customers want to be alerted when a large portion of their locations goes down. But they want to get a notification quickly, via an SMS or a text.
There is a drop-down list in the dashboard allowing the customers to select the threshold value for such an alert. This will create a user macro on the selected aggregate host. The customer then can enter their email or phone number, which is assigned to a ‘customer’ user, which has no other rights except for reading.
Reports
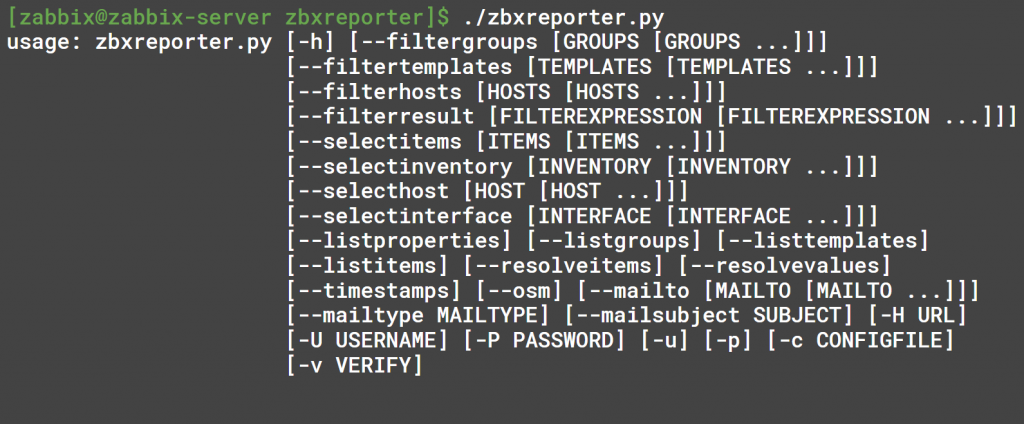
Setting up reporting
As for reporting, we wrote a script that creates automated reports on items, item values, and inventory fields. For instance, there is an SNMP item that pulls in the serial number of the device, storing it as an inventory value.

Reporting script running
The script will output the report with the hostname, listing serial numbers and any other requested item types. This report can be sent every month to our financial department, which can use it to cross-reference to check if we’re actually charging the correct number of routers with the right serial numbers, etc.


