Zabbix 6.0 LTS comes with a complete redesign of the service monitoring. From improved business service scalability to advanced service status calculation logic and alerting. Let’s take a look at the Business Service monitoring feature and how you can use it to ensure full transparency for your business services.
The full recording of the speech is available on the official Zabbix Youtube channel.
Business services can be quite complex. They tend to consist of many different moving parts with redundancy and failover mechanism in place, all of which need to be taken into consideration when we wish to analyze the current status of our services.
Table of Contents
BSM Checklist
Let’s take a look at what needs to be done so we can successfully define and monitor our business service:
- First, we have to define what exactly is our business service and what components does it consist of?
- We need to understand what are our expectations when it comes to service uptime. When should the service be up and running? What are the acceptable downtimes? Should it run 24/7/365 or maybe it’s a service that is critical only during our working hours?
- Once we know what needs to be monitored, we need to make sure that we are collecting the data that reflects the status of different service components.
- Finally – we have to find a suitable tool to track and measure our service.
Define your business
Let’s take a look at how a business may look like. As I mentioned before – business services can consist of many different components. Let’s take a look at an example of how business services may look like:

The tree structure here represents our Business services. We can see that we have classified the services into two branches – Internal services and User services. The User services consist of components such as Websites, Helpdesk services, Phones. These general services are based on lower-level components such as the actual physical phones for the phone service, underlying software for the Website and Helpdesk services, and so on.
This can make things quite complicated since usually, organizations will have many more components to take care of. That’s why, let’s see how we can simplify this tree and define our services in a more simple manner, like the service tree below:

Now we are left with only 3 levels for our services. Let’s take a look at how we can move this to Zabbix:

Here we can see a high-level view of our services. Once again we have our Internal services and User services. These here high-level services consist of child services and define what these components consist of and what their SLAs should be. We can also define tags to provide additional details to our services – which customer uses the service, the type of service, maybe even the location that the service is used in – this part is completely up to your imagination.

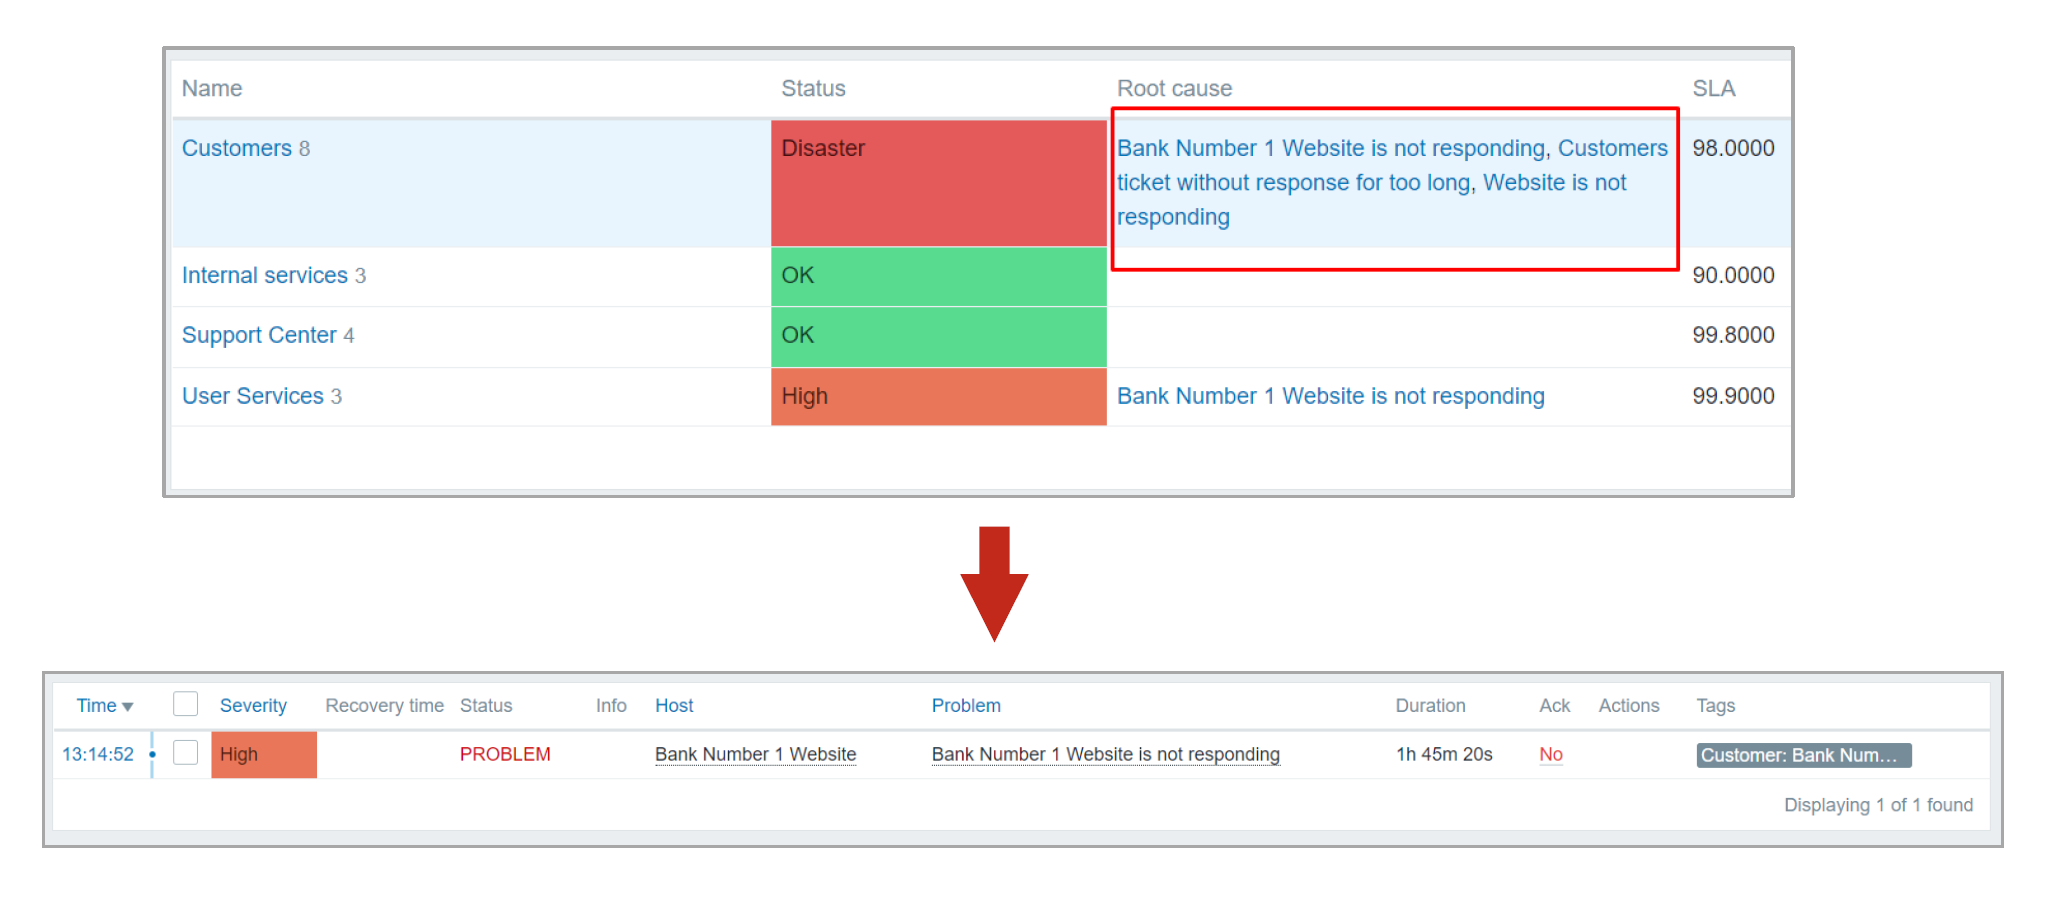
Once you have defined the services, their respective components and have linked them to the problems by using tags, you will finally be able to see the full picture. Zabbix will display not only the status of the service but also the root cause of the problem. This way we can provide service status information not only on the service owner level but also provide information that your technical staff can use to fix the issue.
Configuring SLAs
Configuring Business Service monitoring can be done from the Monitoring – Services section. In Zabbix 6.0 LTS you are not required to start defining the service tree from the root service. Now you can define your own root level services. To create a service, all we have to do is switch to the Edit mode by clicking the Edit button in the upper right corner of the services screen and click the Create service button right next to it. We have also made some additional changes to the service section UI/UX. Now you also have multiple fast edit buttons next to each service. You can use them to Add a child service, edit an existing service, or delete an existing service.
Next, let’s take a look at the actual service creation steps.
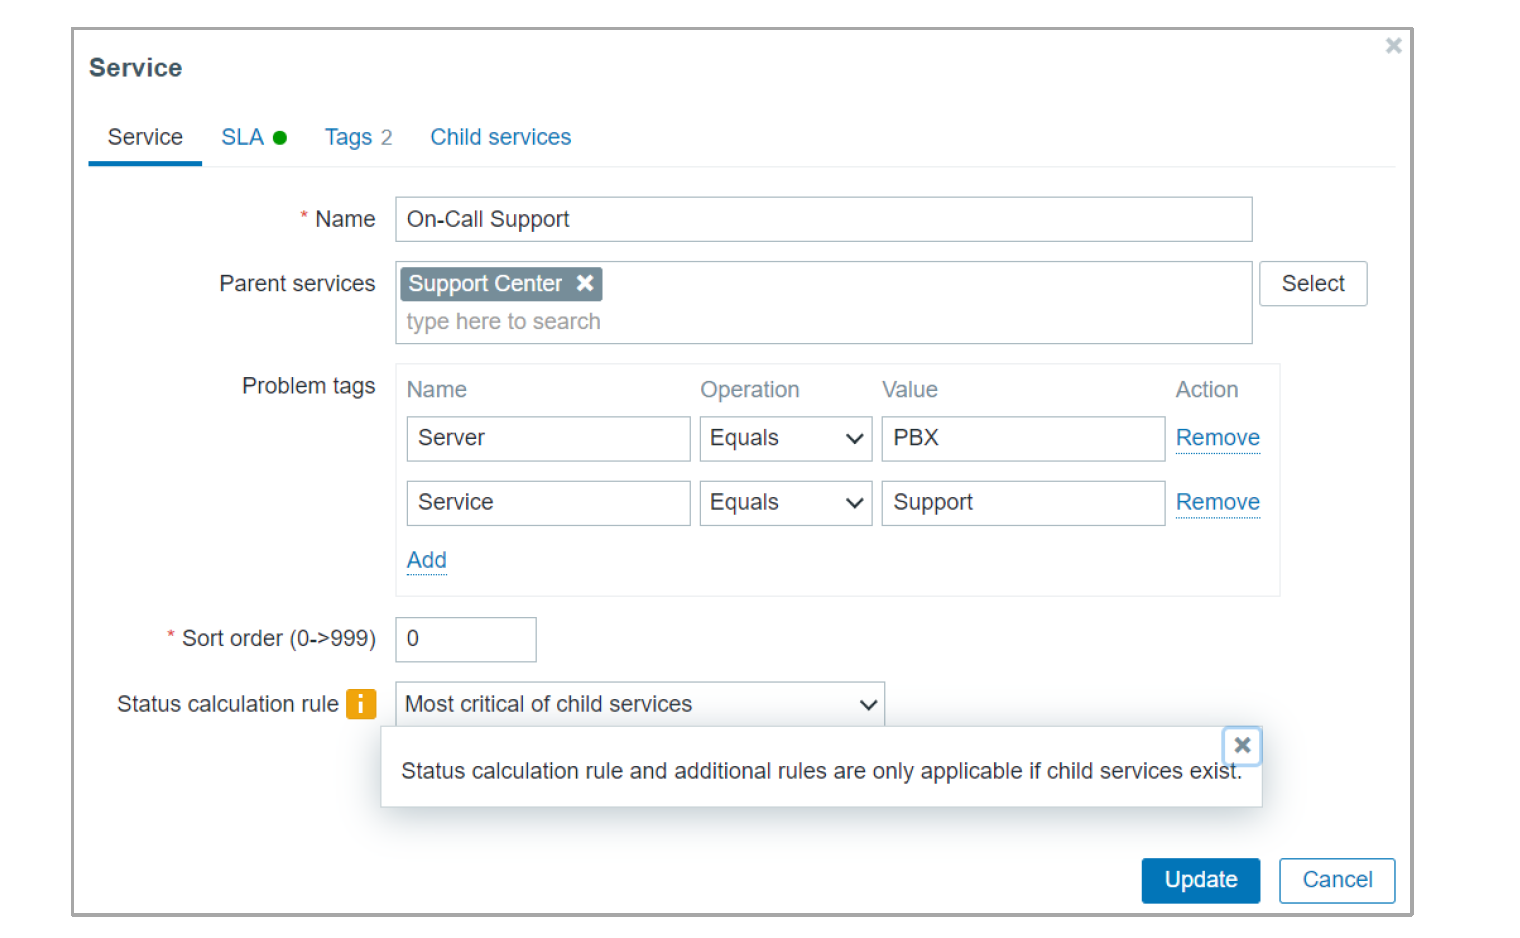
- We need to provide a name for our service
- If the service is not a top-level service you have to select a parent service
- Define problem tags. Problems tagged with the matching tags will affect the service status
- Define the status calculation rule
Major improvements have been made to status calculation rules. We still support the old logic of the Use the most critical of child services / Most critical if all children have problems / Set status to ok, but there are also many advanced service status calculation rules.

- Now we have the ability to select a specific status (Warning, Average, High, and so on) for our service in case of a problem
- Select the number of children, More than/Less than N children, Percentage of children that should be affected for the parent service status change to take place
- Define weights for child services and perform status changes based on the weight of the affected child services
Child services can also apply different propagation rules for the parent service
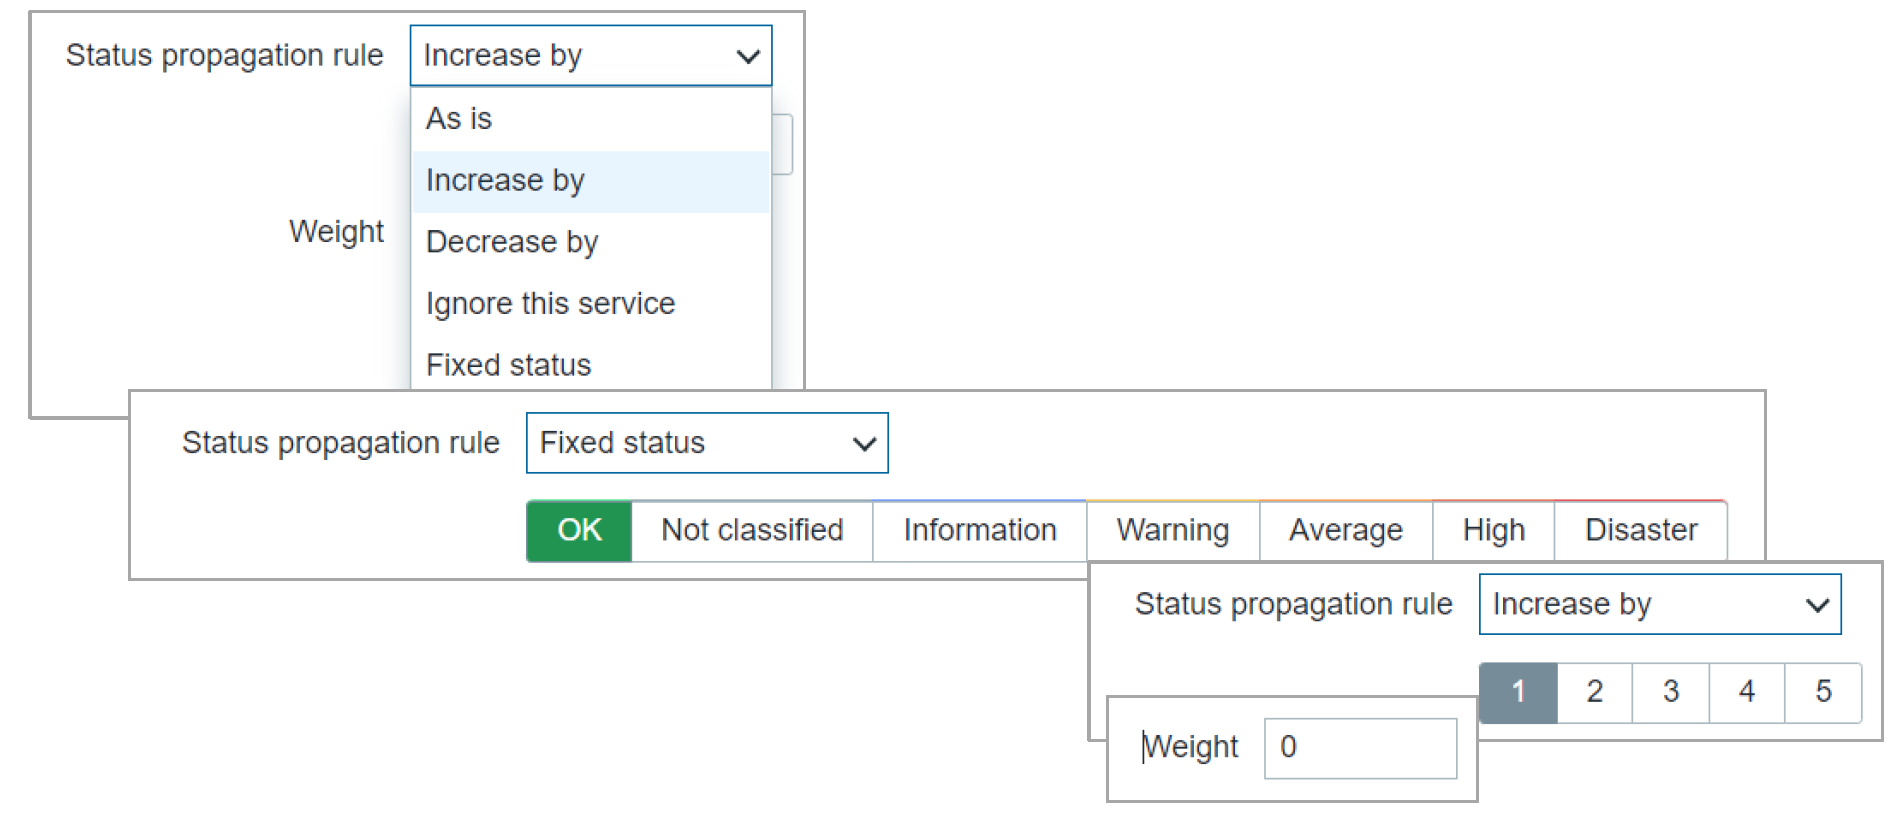
- Child services can Increase or decrease the parent status service status by N severities, ignore the child service, apply a fixed status or apply the status depending on the problem severity
For our example let’s use an HA cluster use case. HA clusters consist of multiple nodes – for our example, we will use 3 nodes.

- First, we define that the HA cluster consists of 3 nodes – 3 child services.
- Each node will have equal weight – 1
- On the parent service, we will define multiple status rules
- If the weight of the child services is 1 (1 node is down) – the parent service will change its status to Warning
- If the weight of the child services is 2 (2 nodes are down) – the parent service will change its status to Average
- If the weight of the child services is 3 (all nodes are down) – the parent service will change its status to Disaster
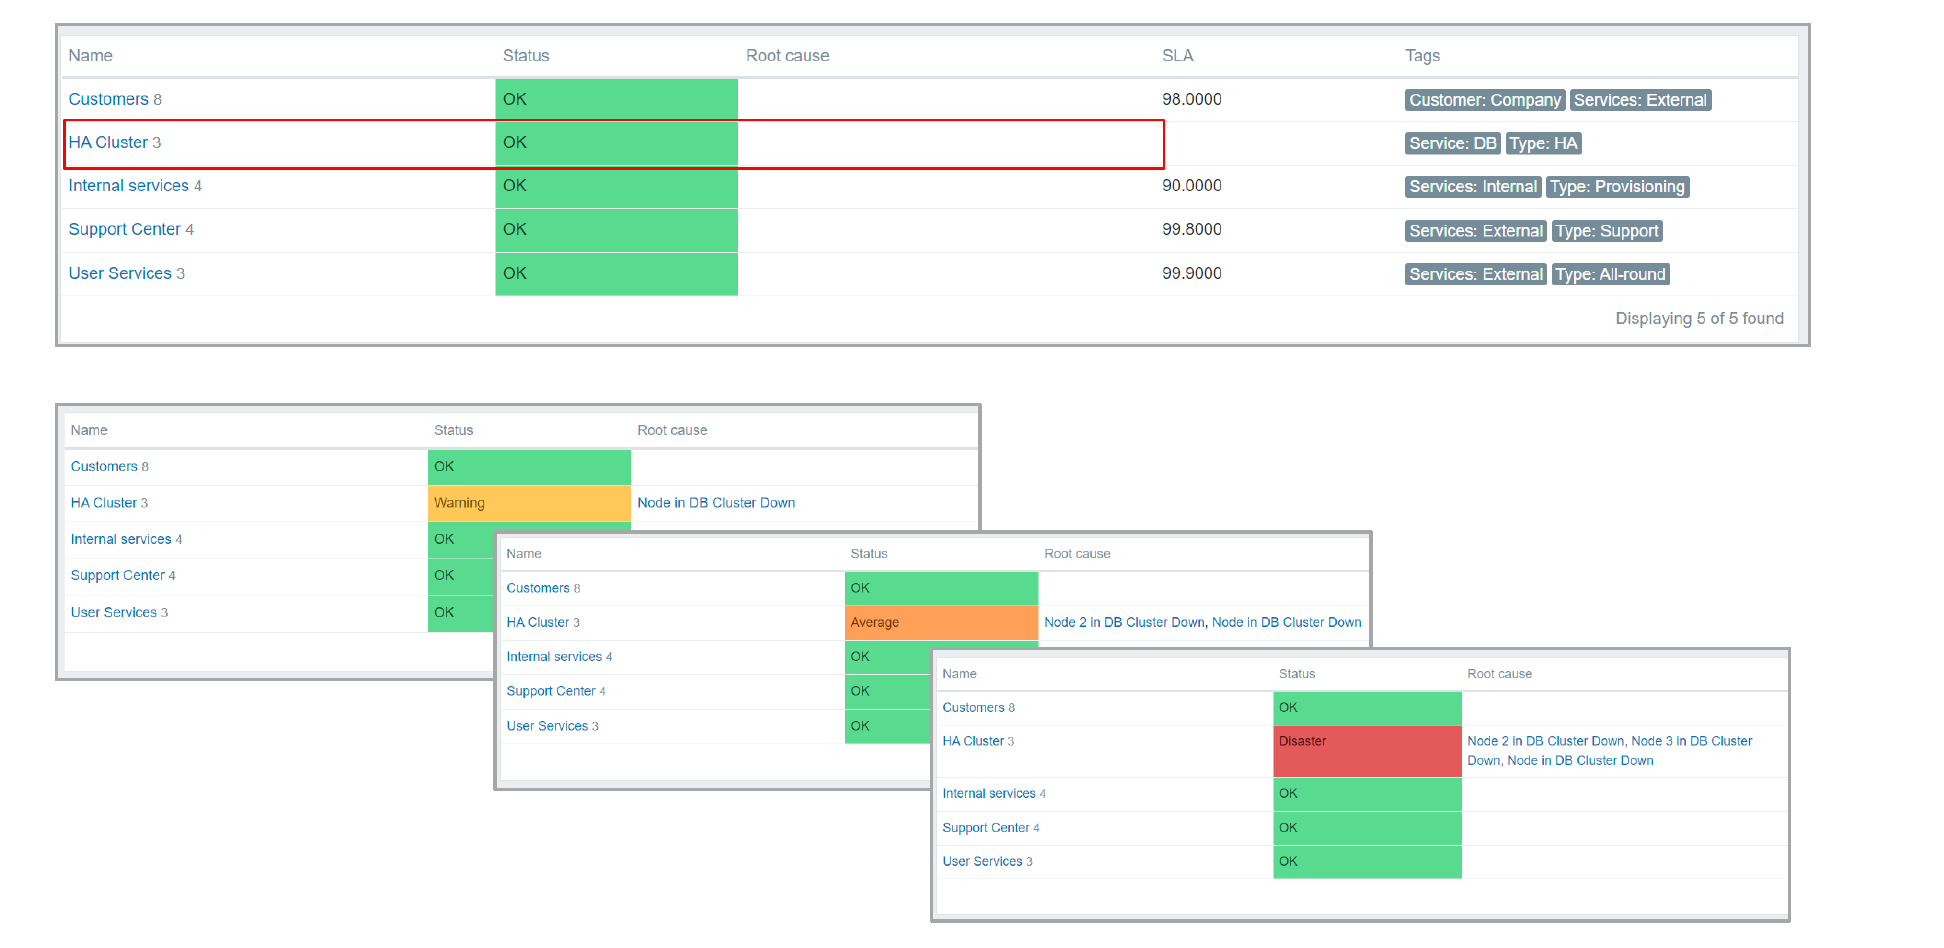
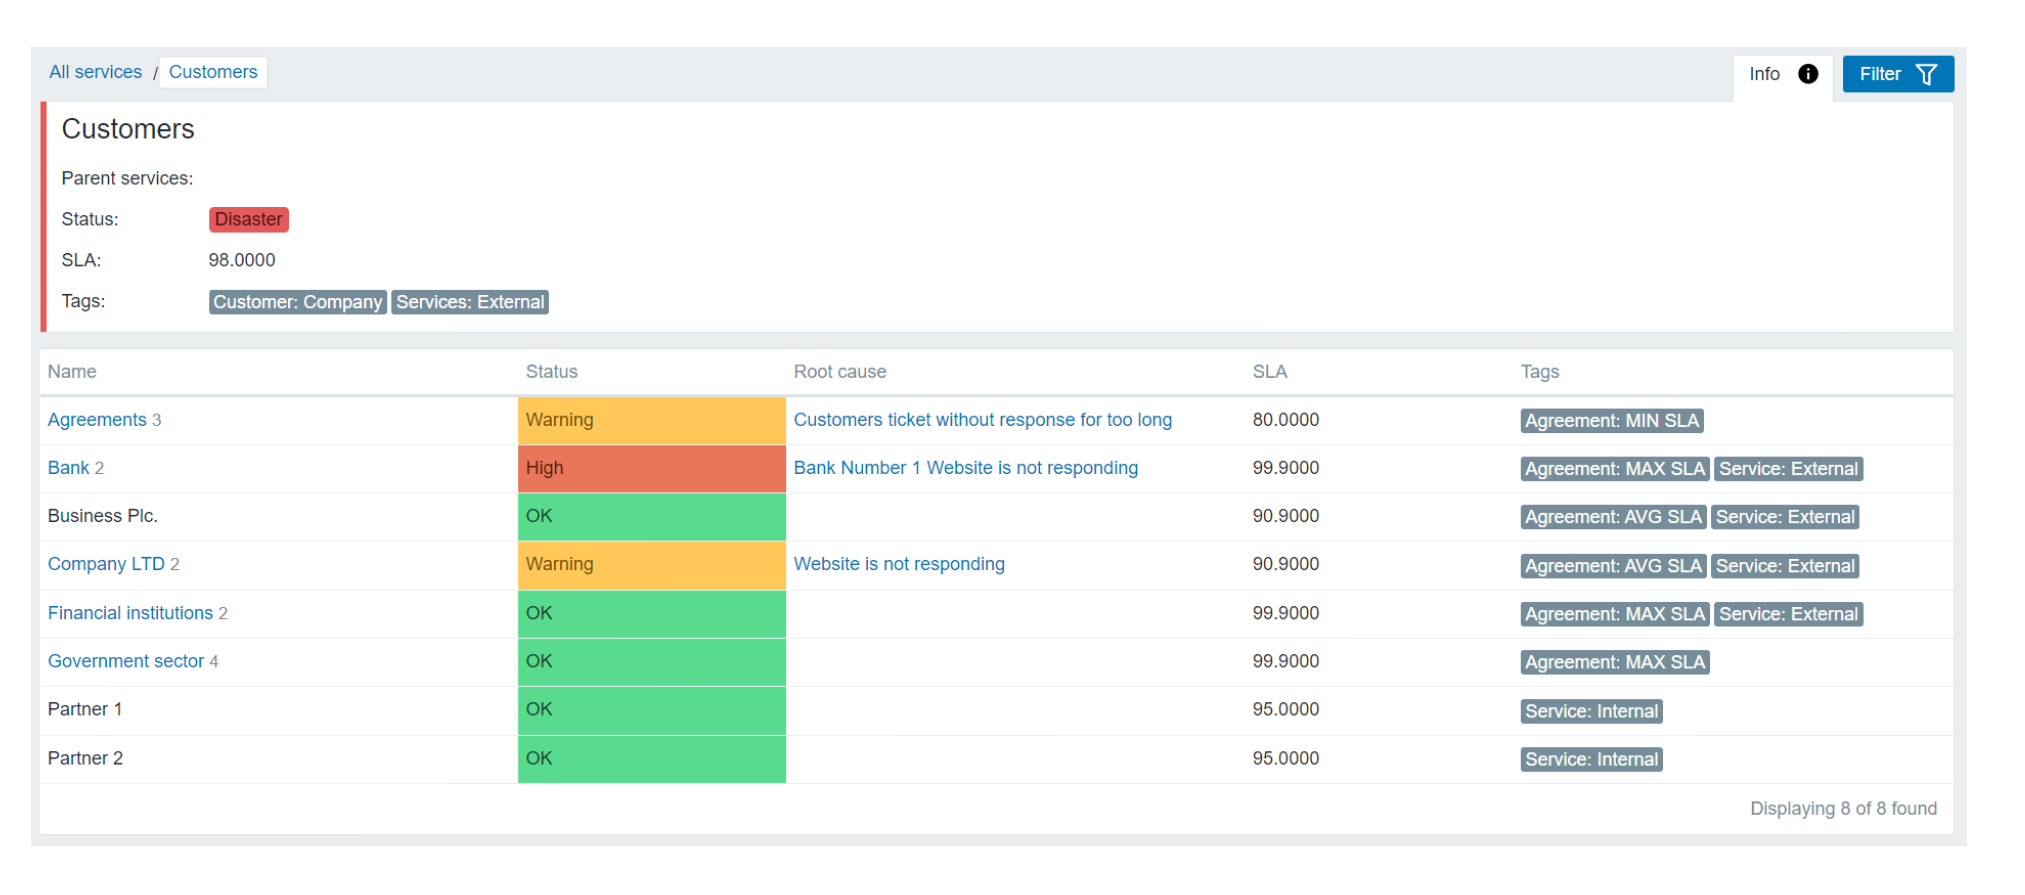
In the above image, we can see how the corresponding status change will look like in the Services section. Note that we can also see the root cause of the parent service status change in the Root cause column.
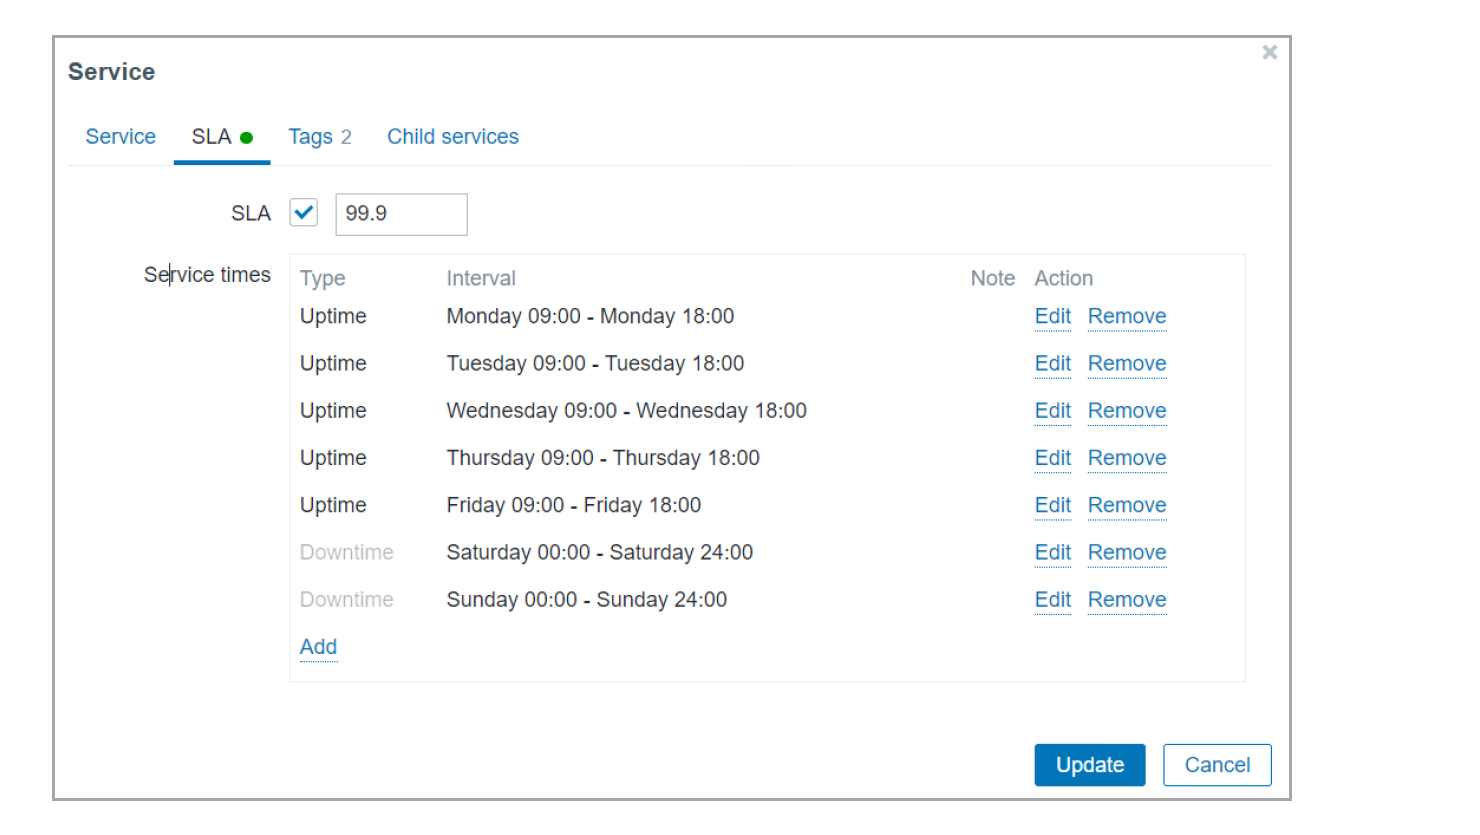
We also have the ability to define the acceptable SLAs as well as SLA calculation uptime and downtime periods for our services. We have the option to define scheduled uptimes and downtimes, during which SLA should or shouldn’t be calculated (Such as weekends, for example), as well as one-time downtimes for one-time maintenance purposes.
Services can utilize tags to provide additional information about your services, such as the service type, service customer, service location, and more. On top of that, tags can also be used in the Service action condition logic, so you can define granular alerting logic for your service status changes.

The Child services tab allows you to quickly look at the related child services, their problem tags, and status calculation rules.
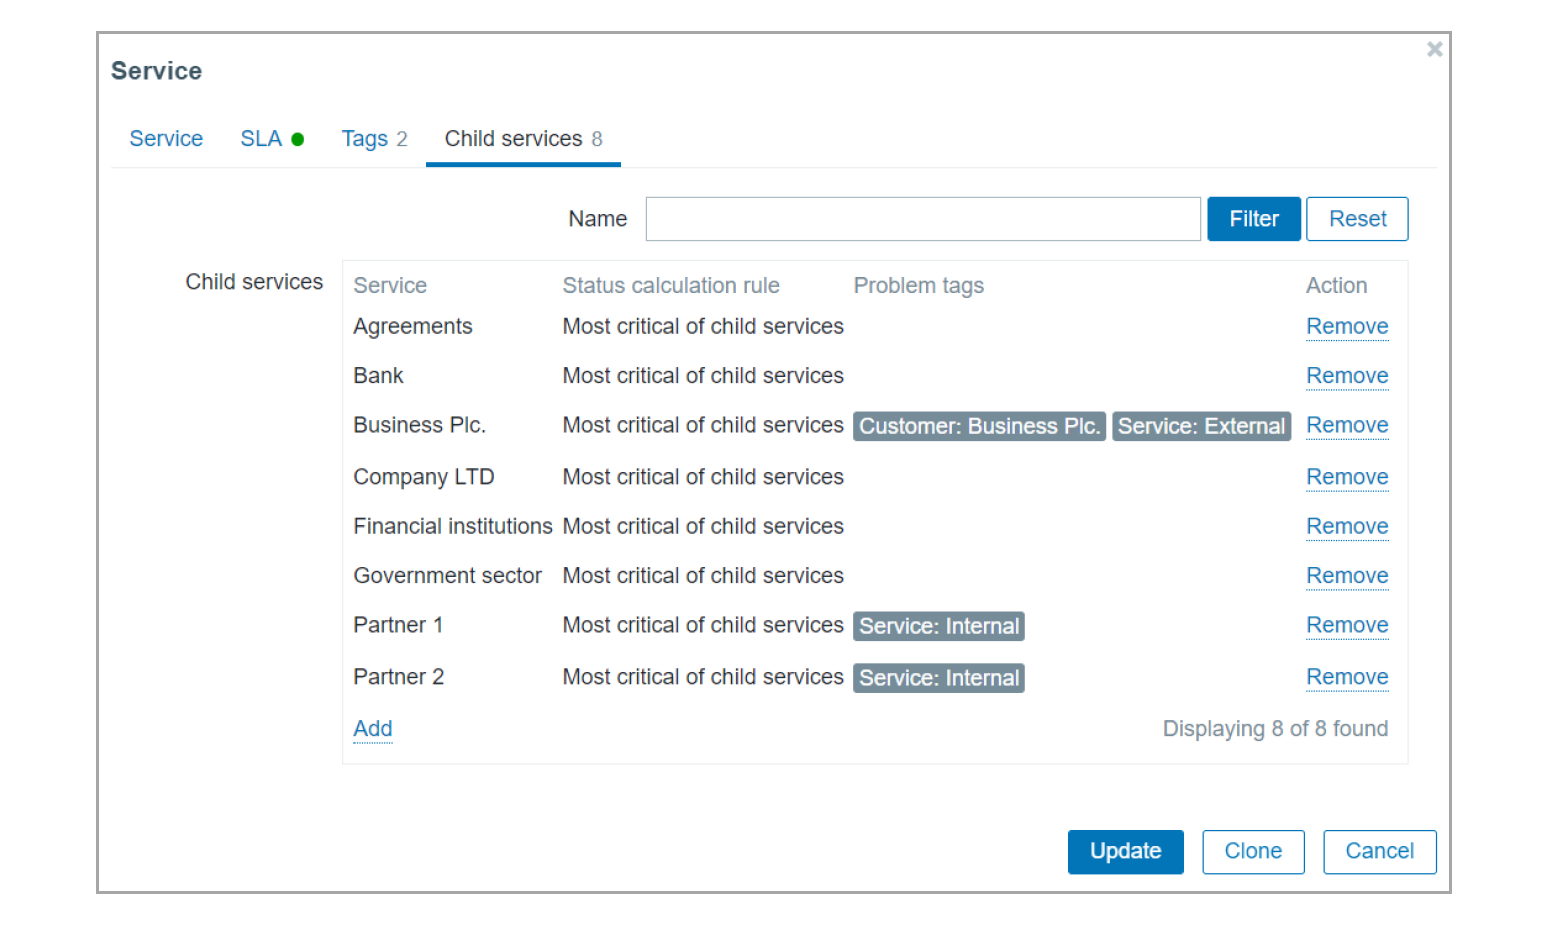
Child services can also be crosslinked between multiple parent services. This means that you don’t have to duplicate and recreate child services if they are used as a component of multiple parent services.

Track, solve and measure
Once we have configured our service, what remains is keeping track of our service statuses, SLAs and staying notified about service status changes and their root cause.
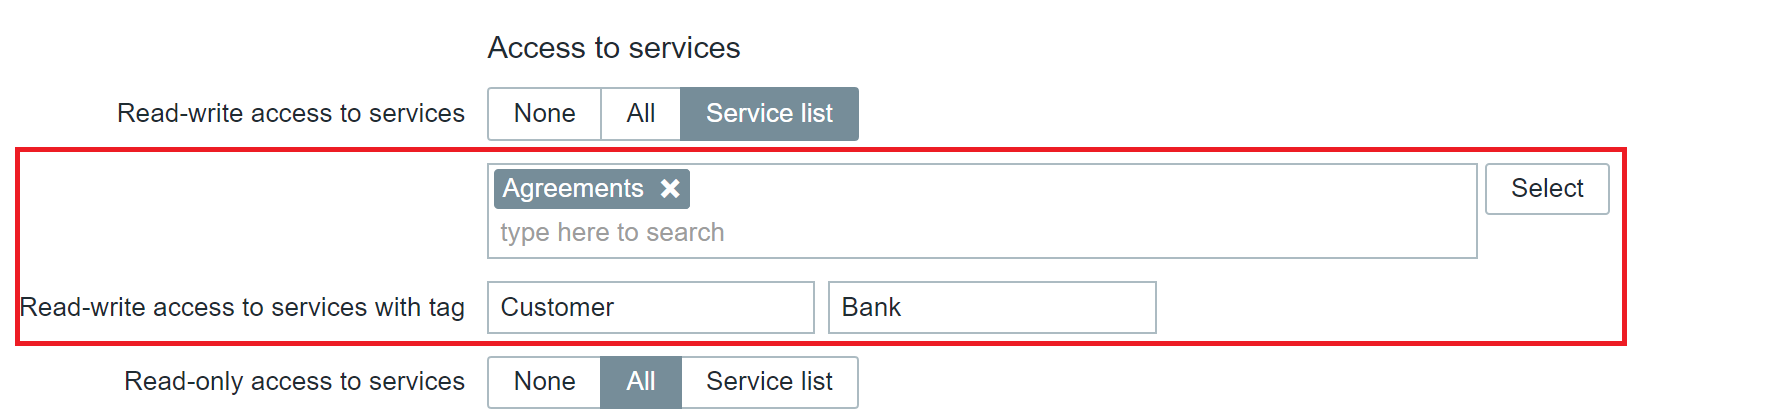
For this purpose, it is vital to secure access to our services. This is especially critical for MSPs, which may have multiple customers and each customer should have access only to the services related to that particular customer. To that end, the Roles section has also received an update related to the Service permissions. We can now define Read-Write and Read access to either specific services or services marked with a particular tag.
The Root cause section displays the root cause problems that affected the service status change. You will be able to click on the root cause problem and open it in the Problems section for further analysis of what caused your services to change their status and which host has been affected by it.
Previously I mentioned alerting on service status change, so let’s dig deeper into that. In Zabbix 6.0 LTS we have added a new type of action – Service actions. Zabbix can now react to service status changes and notify you when a service changes its status. The Service action conditions can analyze if a status has been changed on a particular service, a service that matches or contains a specific string in its name, tag, or tag value. If the conditions are true, Zabbix can send out an email, deliver a phone call or an SMS, create a ticket in your helpdesk system or perform any other alerting and notification workflow.

Many other BSM features are coming as we continue the development of Zabbix 6.0 LTS:
- SLA graphical visualizations with support for over 100k services
- Daily, Monthly, Weekly SLA reports
- New service tree and SLA reporting widgets available from the dashboard
- Service tree import and export
- Impact analysis – see which service affects other related services in what way.
Questions
Q: Will the existing services be migrated to Zabbix 6.0 LTS?
A: The existing services will be migrated to Zabbix 6.0 LTS during the upgrade. All of the configuration for the existing services will stay intact after the migration.
Q: Does host maintenance suppress service calculation in Zabbix 6.0 LTS?
A: Host maintenance will not affect the service calculation. If you wish to define maintenance periods for your services – use scheduled or one-time downtime options when configuring an individual service.
Q: How are the Fixed status and Ignore this service calculation rules going to work?
A: Fixed status services will not change their status no matter what happens to the child services – the service status will remain fixed. As for Ignore this service – the service status change will be ignored and will not affect the parent services.