


Maps — one of many visualization options inside the Zabbix, a way to display your collected data, show the problems and create your topology. A map is more than a simple picture. It includes many small but very useful key features.
Watch the video now.
Contents
I. Introduction (0:05)
II. How to (2:27)
1. Creating a new map (2:27)
2. Configuring a new map (6:59)
3. Linking map elements (13:41)
4. Triggers (15:06)
5. Breaking lines (16:24)
6. GIFs (19:43)
Introduction
Maps functionality is not something complicated that you need to do in Configuration, or to collect data from your host, etc. Maps inside Zabbix — one of the visualization options used inside the frontend to visualize what is currently happening in your monitoring environment.
In this demonstration, I will use Zabbix 4.4 including Zabbix frontend 4.4.3. Its functionality remains mainly the same except that in Zabbix 4.2 animated GIF support was added.
I’ve created four dummy hosts with all of them pointing to my virtual machine.
 Four dummy hosts
NOTE. Maps configuration is available for the simple Zabbix users, but the users should have permissions on all of the elements included inside the map.
How to
The first step is to create a map by defining its general parameters and then you can fill the actual map with elements.
Creating a new map
To create a map in Zabbix, go to Monitoring > Maps and click Create map.
NOTE. You can also click Clone and Full clone in the configuration form of an existing map to create a new map.
Define the needed attributes in the Map tab:
1. Type Name of the map.
2. Decide on Width and Height to specify the size of your map. Usually, the size is adapted to the screen on which the map is planned to run.
3. Select Background image. By default, the background is white or grey with nothing on, but you can add a custom background. To import your background, go to Administration > General > Images,
 Importing custom background
change Type of Image from ‘Icon‘ to ‘Background‘ and click Create background. Choose Name, click Choose File, and click Add.
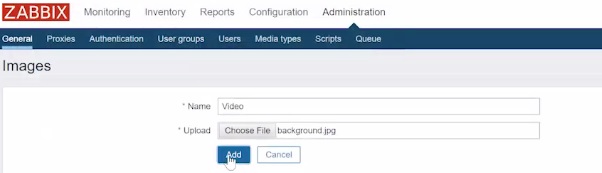 Adding custom background
4. Automatic icon mapping allows mapping certain icons against certain host inventory fields.
Inside Maps, there are pictures that you can assign to your hosts or other elements. So, with automatic icon mapping, you can define a default picture based on Inventory field of the host.
Go to Administration > General > Icon mapping to define Inventory field of Mappings and to select default icons based on Inventory field values.
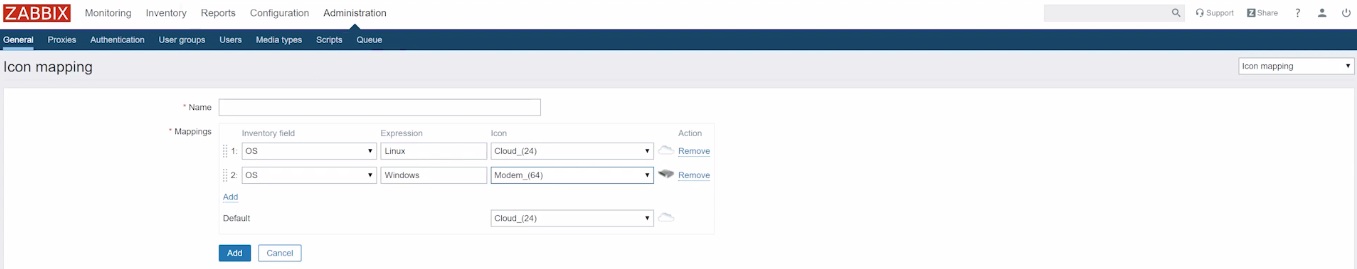 Default icons for Inventory field values
5. Icon highlight and Mark elements on trigger status change modify visualization of the element when the trigger goes to the problem state.
6. In Display problems you can define how problems are displayed with a map element. You can specify whether to Expand single problem, Number of problems or display Number of problems and expand most critical one based on the problem severity.
7. In Advanced labels and Map element label type you might specify all available macros.
8. Map element label location defines how you see the design of the map.
9. In Problem display, you define if you want to display ‘All‘, ‘Separated‘, or ‘Unacknowledged only‘ problems.
10. In Minimum severity, you define the severity level you want to visualize in your map. So, problems below the defined minimum severity level will not be displayed. For example, if you create something for critical problems only, you don’t want to see anything less than ‘High‘. In our example, we’ll leave this as default — ‘Not classified‘.
In the Sharing tab, you can define the security measures and make the map ‘Private‘ and delegate permission to see the map to some users or you can make it ‘Public‘ and available for everybody.
 Map parameters
Click Add.
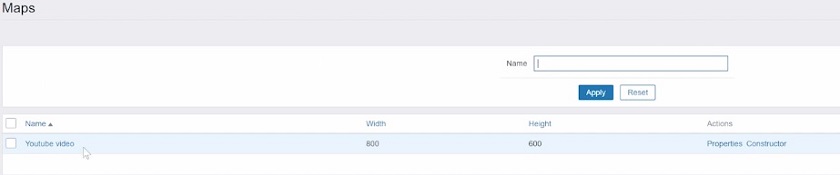 New map created
Configuring new map
Click the new map name to open your new background. Now you can populate the map with elements such as hosts, host groups, triggers, images or other maps.
NOTE. If the background picture is bigger than the map size, go back
to the Properties Constructor and adjust it. You also can resize the background picture.
Configuration of maps is full of tips and tricks and small pitfalls you need to consider to create something meaningful.
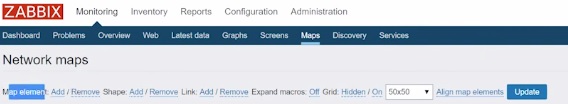
1. Open the map and click Edit map.
 Opening map editor
In the settings window, you can start adding elements.
 Map elements
2. Click Add in Map element to add a new element. Then double click on it to define the Map element parameters.
3. You can select Type of the map. So, ‘Map‘ allows for creating a map inside the map.
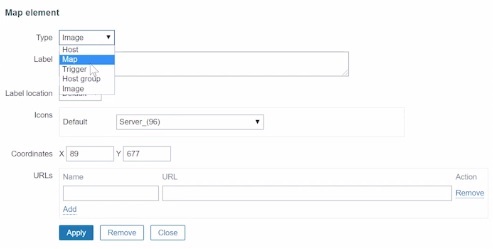 Selecting map label
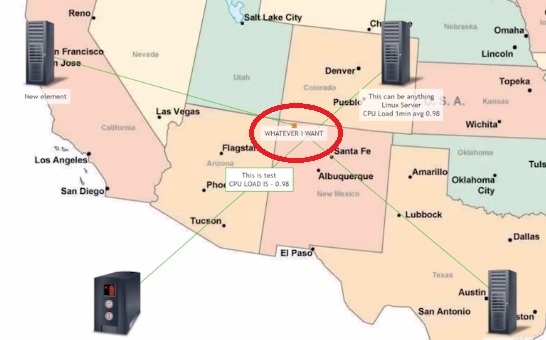
For example, in the first-level map of the United States, you can have some elements in Phoenix. In case of a problem in Phoenix, you can double-click on it to open a more detailed map with offices in Phoenix. In case of a problem at Phoenix DC inside the second-level map, you can double-click on Phoenix DC to see a detailed data center map.
You can also visualize problems with hosts, triggers, or host groups, or just a simple image without any meaningful information.
For our example, we’ll pick ‘Host‘. I’ll select one of the four previously created dummy hosts — Linux server.
 Selecting host
4. Label is the most interesting field. You can type a static text or use macros. But as we are in the editing menu, to Apply changes you need to click On in Expand macro first.
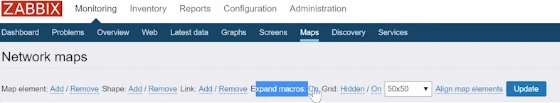 Expand macros
You can use any other macro from inventory or host description. Macros defining how to display the actual values of the elements might be interesting. The macro syntax includes a part very similar to the trigger, then the key, and the function:
{{HOST.HOST}:key.func(param)}
- To pick a key, go to Configuration > Hosts, select a host, click Items, and copy the key you need as it’s case-sensitive. Then paste it to the Map elements window.
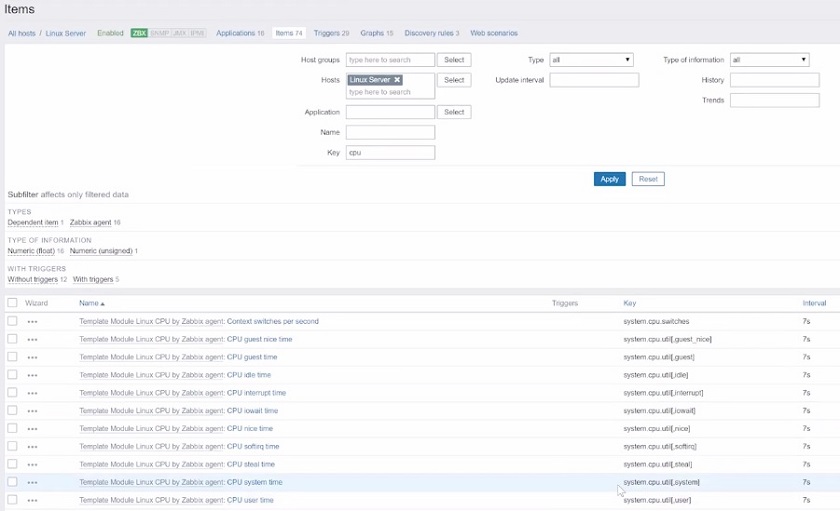 Selecting key
- Then we need to write a function. The function defines which value to display, for example, an average or the last received value.
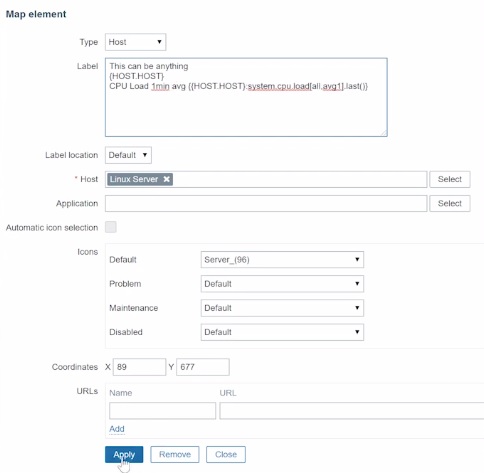 Map elements
NOTE. Don’t use quotes around the key.
Click Apply to see the actual value which is not just the static text. The map background will refresh if the item receives a new value.
Linking map elements
Once you have finished adding the elements, you can start linking them. To link two elements, you need to drag around the two hosts or select them holding a Ctrl key. Then click Add next to Link.
 Adding links
With a link created, the Mass update elements form will contain an additional Links section. Click on Edit to edit link attributes.
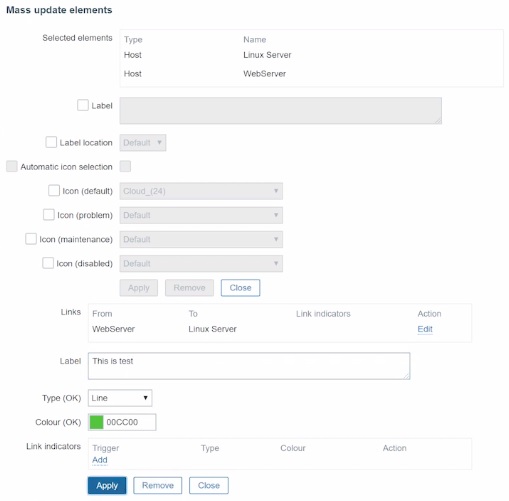 Adding link attributes
After you type the name in the Label field and click Apply, the link will appear between elements on the map.
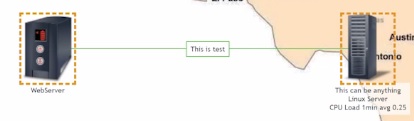 Label on top of the link
The Label field also allows for displaying values from hosts on the map. You can not use the {host.host} format in this field, as the link is made out of two or more hosts and Zabbix won’t be able to identify the value from which host you actually want to display.
In this case, you need to specify the host from which you want to show the value as follows: {host:key.func(param)}.
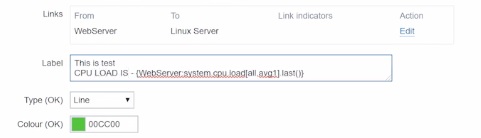 Specifying host to display its value
Triggers
We can also define triggers for the links. In the Mass update elements form, select Link indicators and click Add under Triggers.
 Setting up triggers
Here you can also select the color of the link in an OK state and if a problem arises, as well as style of the line.
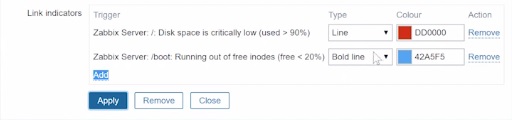 Defining line details
You can make the color of the line to match your background so that you see the link only when the problem arises.
Breaking lines
Now that you have set up the link, every time you move one of the elements, the label also moves. It is a limitation as labels on two or more different lines can collide.
To avoid this, we need to use a nasty trick — create a one-pixel image.
1. Create a one-pixel image.
2. Go to Administration > General > Images > Create icon. Click Choose file, select this new image and click Add.
3. Delete the link between the needed hosts and in the Map element window select your newly uploaded image in the Icons field. Then refresh the page.
4. Add a link between the one-pixel image and each of the needed hosts.
5. In the Label field of the new element, you can type the needed text or use a macro from any of the needed hosts.
 Breaking the line
NOTE. Don’t forget to click Update to save changes.
 GIFs
GIFs
You can also add GIF files to your map, for example, to display a problem state.
To do that:
1. Add a new element.
2. Double-click on the new element to open the Map element window.
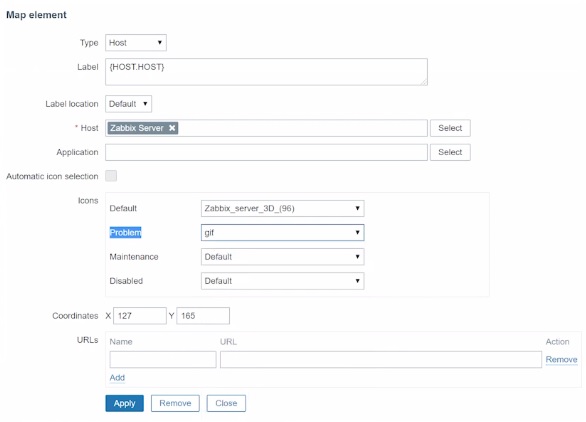
3. Click Select against Host and choose Default image for Icon and a GIF file for Problem.
4. Click Update.
NOTE. To upload a GIF file, you need to go to Administration > General > Images > Create icon. Click Choose file, select the needed GIF file, and click Add.
 Setting GIF file
If you set the trigger to ‘0’ in the CLI, in the map you’ll see your GIF for the problem state.
![]() Setting trigger to Problem state
Setting trigger to Problem state
In the monitoring view, you can click on GIF, as well as on any other icon, and execute the frontend script.
NOTE. You can also add your own frontend scripts and quick links.
NOTE. Remember that each of the elements on the map can also be another map. It is also possible to define custom URLs for the elements, which allow forwarding the user, for example, to internal instructions if a problem arises.
That’s all for today on Zabbix Maps. You are welcome to like, comment, and subscribe.


Hi,
Is there anyway to create a map with element and links automatically when a host is added to zabbix server using some kind of script? I’ve been searching for one and unfortunately found nothing.