


Tag:
visualization

Keeping Latvia Connected with Zabbix and LMT

July 22, 2025
Case Study
LMT is a mobile GSM/UMTS/LTE operator in Latvia. Founded on January 2, 1992, it was the first mobile network operator in the country. In addition to providing mobile network and ISP services, LMT uses innovative technologies and solutions to develop and maintain a variety of IT solutions for public and private organizations. Currently, LMT is […]
Enhancing Visualizations in Zabbix with the ECharts Module

April 17, 2025
Handy Tips
One of the great advantages of Zabbix is its extensible and modular architecture. This allows the platform to be enhanced with third-party modules, significantly expanding its functionalities without compromising the stability of the core system. The ECharts-Zabbix module is an excellent example of this flexibility in action.
Monitoring a Complex Infrastructure Environment with Zabbix

October 30, 2024
Community
Inviting the members of our global community to share their Zabbix dashboards with us prompted a flood of fascinating responses, and we’re highlighting a few of the most interesting submissions here on our blog. This week’s entry comes to us from Nyein Chan Zaw, who is based in Bangkok, Thailand and works as an Infrastructure […]
Handy Tips #14: Gain new insights into your metrics with the Graph widget

December 2, 2021
Handy Tips
Group, aggregate, and visualize your collected metrics with the Graph widget to obtain additional insights. Sometimes simple graphs may not be sufficient – we may need to visualize data trends, display all metrics matching a pattern, or define custom draw styles for specific metrics. The Graph widget allows you to visualize your metrics in an […]

Zabbix 6.0 LTS at Zabbix Summit Online 2021
November 16, 2021
Community
With Zabbix Summit Online 2021 just around the corner, it’s time to have a quick overview of the 6.0 LTS features that we can expect to see featured during the event. The Zabbix 6.0 LTS release aims to deliver some of the long-awaited enterprise-level features while also improving the general user experience, performance, scalability, and […]
Handy Tips #6: Organize your dashboards and create slideshows with dashboard pages

October 7, 2021
Handy Tips
Create clean multipage dashboards, run them as slideshows, share dashboards with specific users, and stay in control of your monitoring data. Previously, Zabbix had two different functionalities – Screens and Dashboards. With Zabbix 5.4 Screens have been completely replaced by Dashboards. In Zabbix 5.4, Dashboards support multiple new functionalities: No need to switch between screens […]

How to Use Zabbix Maps for Better Visualization

May 5, 2020
How To
Maps — one of many visualization options inside the Zabbix, a way to display your collected data, show the problems and create your topology. A map is more than a simple picture. It includes many small but very useful key features.
Configuring Grafana with Zabbix
November 4, 2019
How To
Integrate Zabbix with Grafana in just a few steps. Visualize collected data not only in native Zabbix frontend, but also in Grafana. Watch the video now.
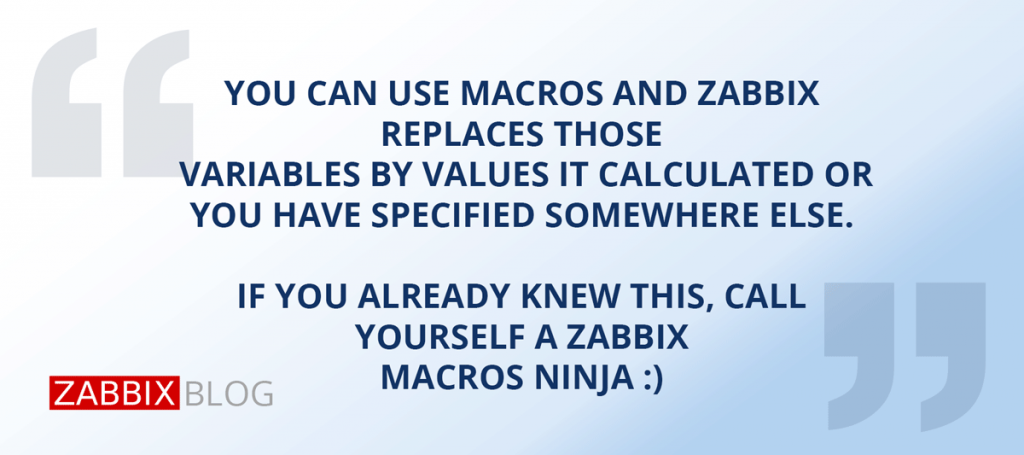
New macros supported in Zabbix network maps

March 29, 2019
News
Zabbix 4.2 comes with the long awaited support of multiple macros for map element labels and URLs. In this blog post we will discuss what new features Zabbix provides and how to use them to make Zabbix network maps more awesome. For starters though, let me remind you what is a macro in Zabbix and […]
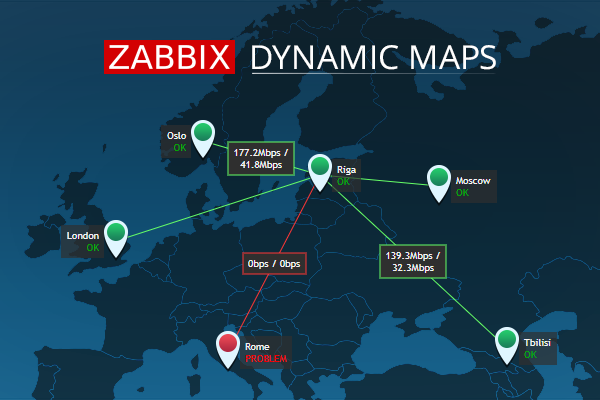
Zabbix 3.4 – Dynamic Maps

May 3, 2018
How To
Zabbix 3.4 impressed with its graphical, easy-to comprehend and improved way to access all the gathered data resulting in more interactive, dynamic and visually pleasing network monitoring.
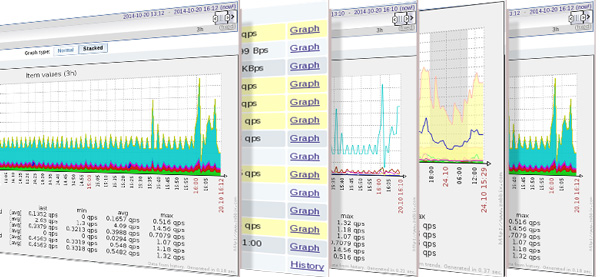
Zabbix 2.4 features, part 9 – Ad-hoc graphs

October 29, 2014
Technical
There have been two types of graphs in Zabbix until now: Simple graphs Custom graphs Simple ones were available for any numeric item, but could only display that one item. Custom graphs could have multiple items on them, but could only be created by users with administrator privileges. Zabbix 2.4 adds a capability to graph […]