Monitoring a Windows server helps verify and keep track of reboots, disk space, memory, CPU, communication loss, and high bandwidth consumption within the server – in fact, anything unusual that may require attention. In this post, we’ll see how to install and configure the Zabbix server and Zabbix agent on Windows, highlighting the key points that will keep your system running smoothly.
Check Zabbix server version
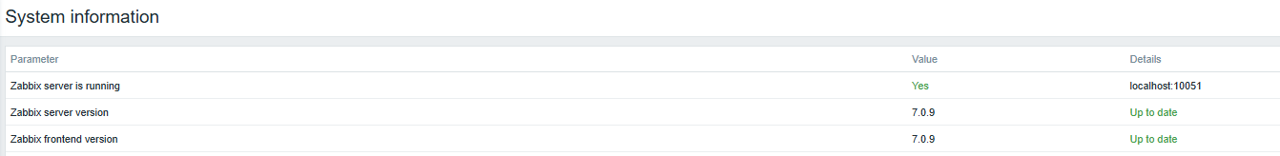
First, check which version of Zabbix server you’re using. This can be verified from the frontend in Reports > System information. In this example, we use version 7.0.9.
Before you begin, head over to your Windows server and verify the name and type of architecture.
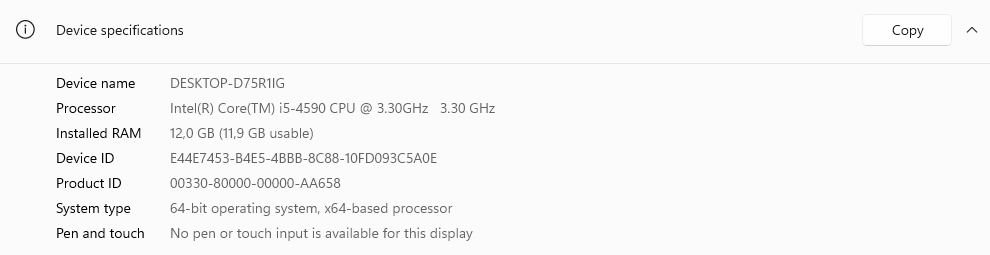
This is critical to selecting the right agent during deployment.
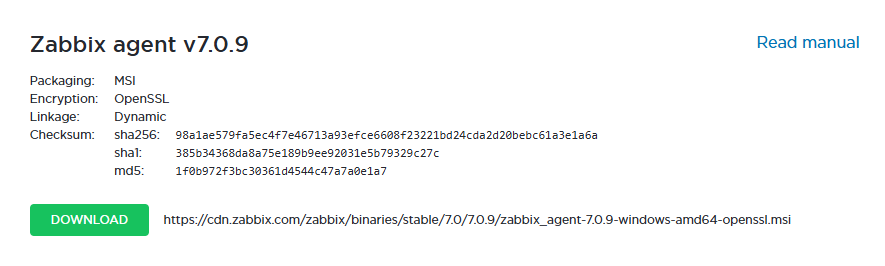
Download the Zabbix agent
From the official Zabbix website, download the corresponding agent, taking into account the operating system (in this case, Windows), the hardware architecture (64 bits), the version of Zabbix server (ensuring compatibility with the version used), encryption (using OpenSSL as an encryption method), and the installation format (selecting the MSI file).
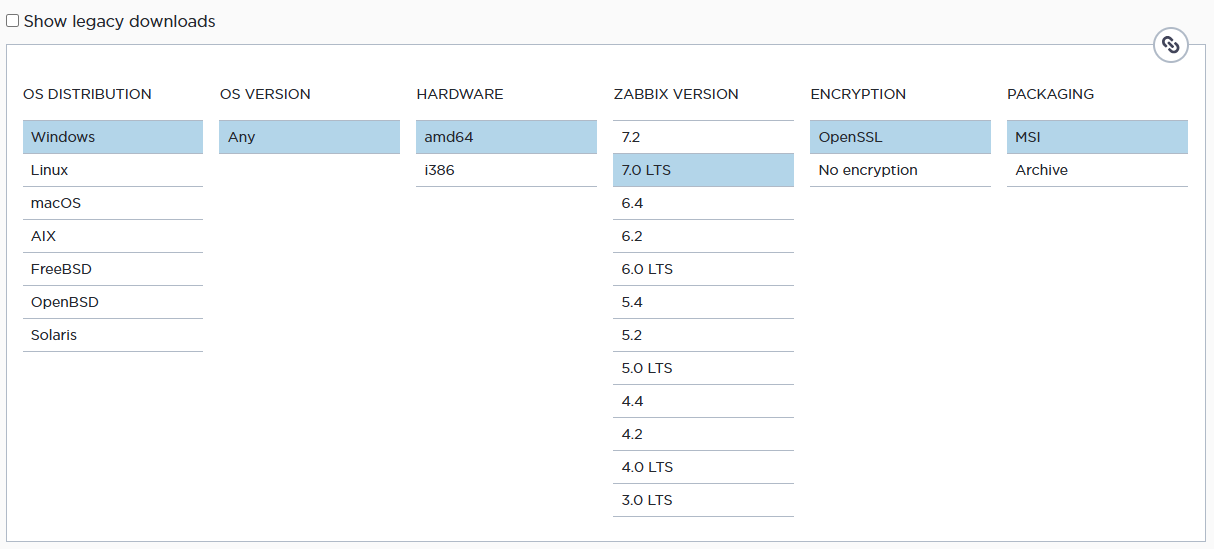
Select the current version of the release and download.
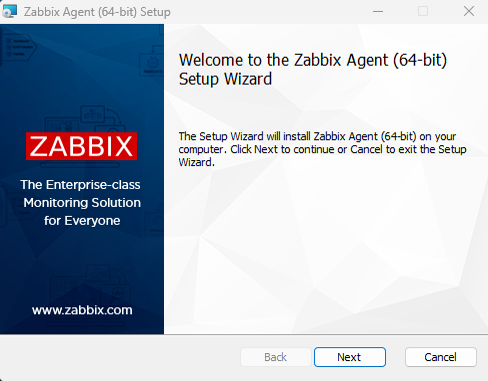
Install the Zabbix agent
Start installing the Zabbix Agent on the Windows server.
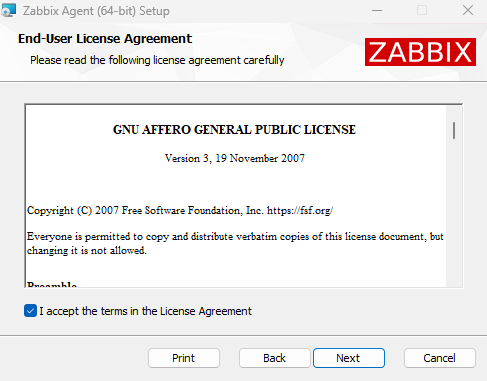
Accept the terms and conditions.
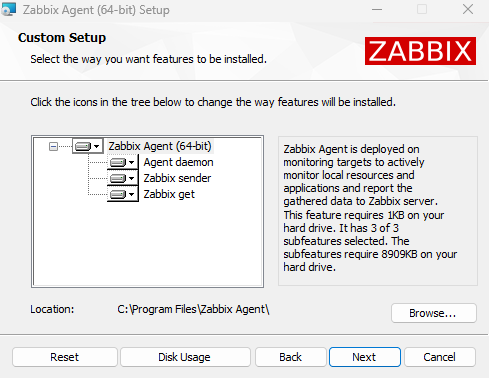
Check the components to be installed. You’ll need at least 8.70 MB of disk space.
The default installation path is C:\Program Files\Zabbix Agent\.
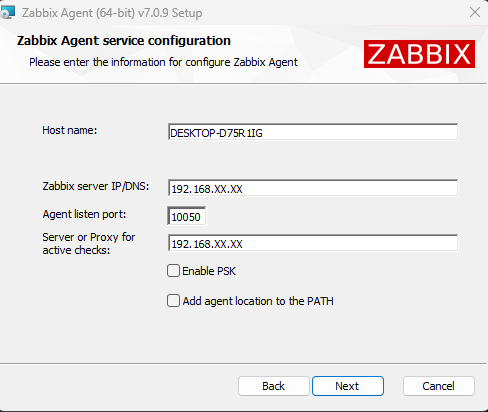
By default, the installer detects the name of the server. Enter the IP of your Zabbix Server. You can also use pre-shared keys.
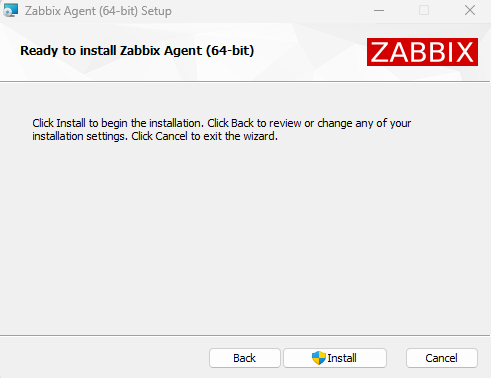
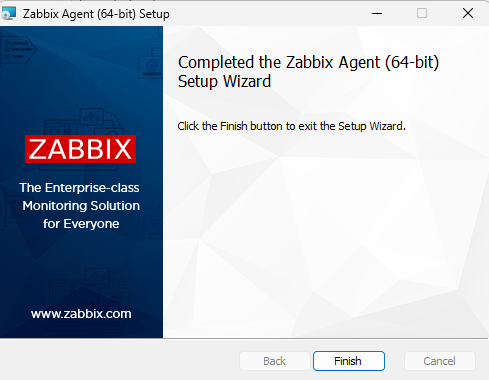
Start the installation and wait for it to finish.
Configure host in Zabbix Server
To set up a host on Zabbix Server, go to the Zabbix frontend and go to Data collection > Hosts.
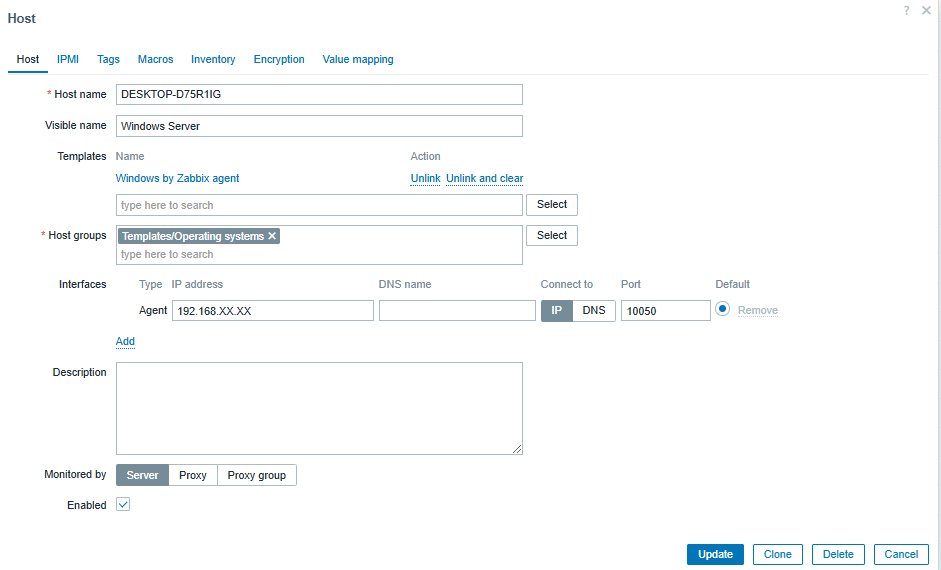
Then, click Create host (located in the top right) and configure the following details:
• The hostname (DESKTOP-D75R1IG)
• An identifying display name (such as ‘Windows Server’)
• The template (select ‘Windows by Zabbix Agent’)
• The group (assigns the server to an appropriate group)
• The interface (choose the agent monitoring option and enter the IP of the server)
Monitoring and visualization
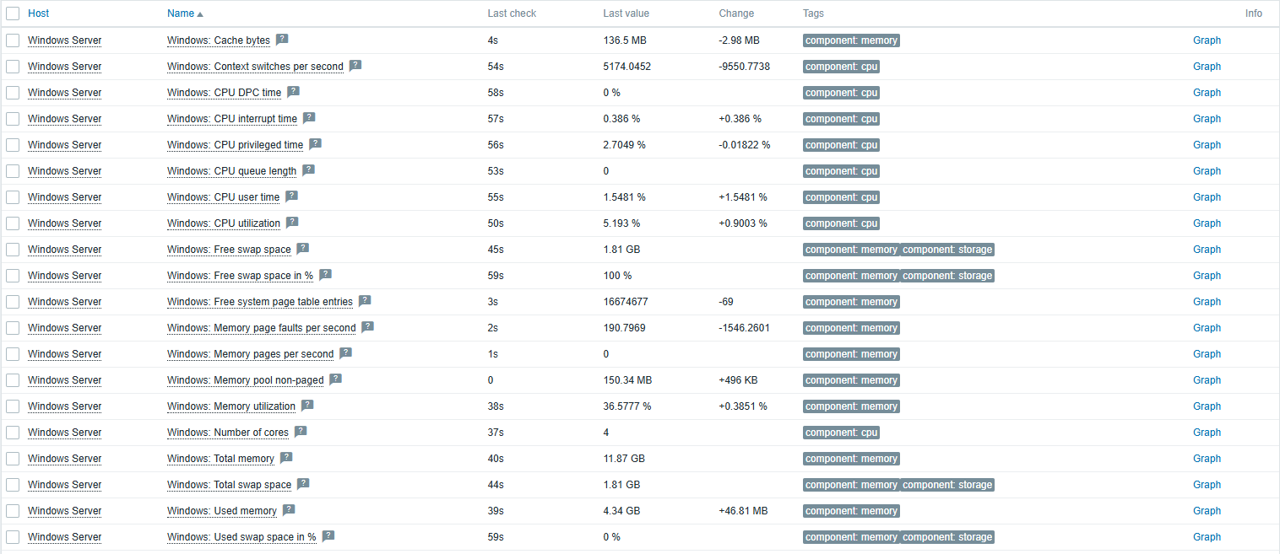
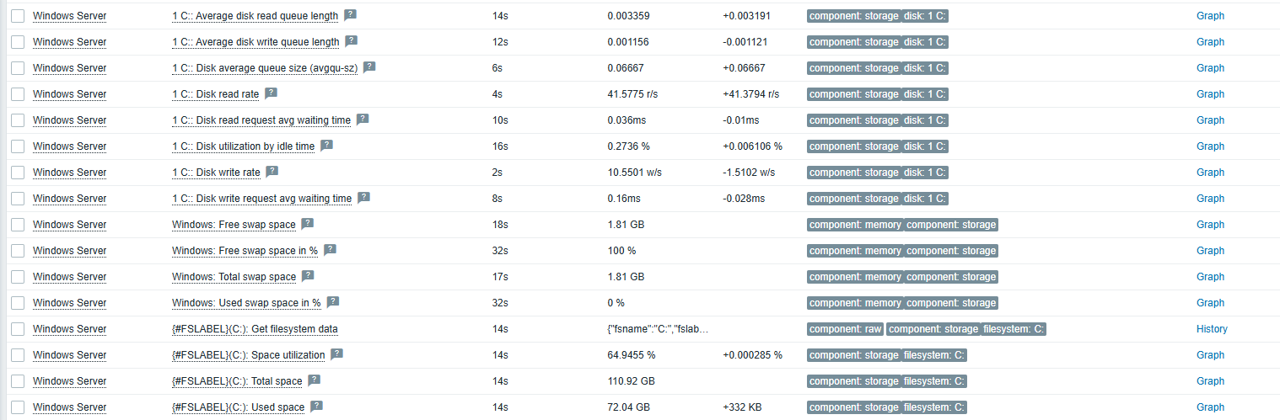
Once the host is configured, you will start receiving data from the server in Zabbix, including:
• Overall performance: CPU, memory, and disk status.
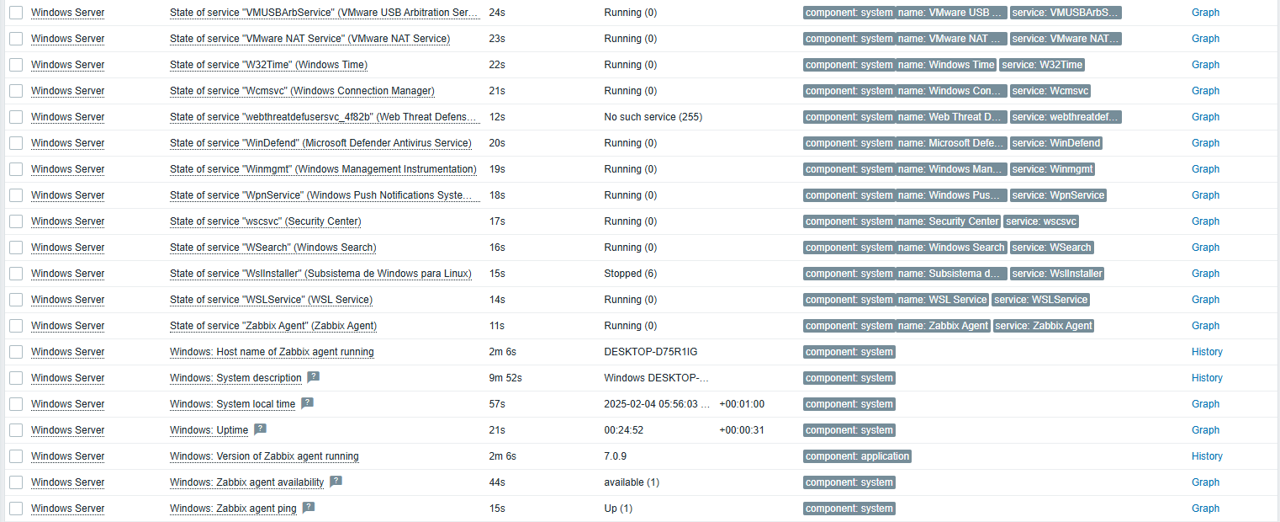
• Windows services and detailed host information.
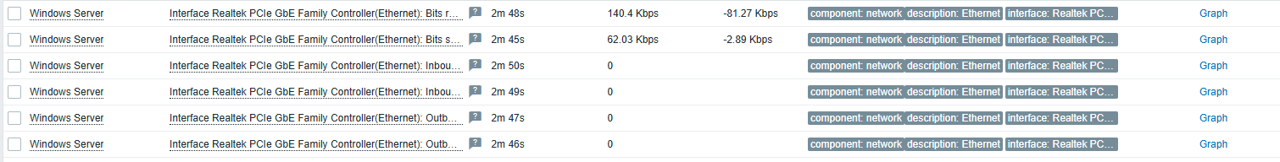
• Bandwidth consumption
Conclusion
Zabbix provides an ideal template for a productive environments on Windows, making it a key tool for global monitoring of your servers.
In addition, you can extend and adapt the monitoring according to your needs, such as monitoring logs, ports, or specific events, while also checking for login failures or other critical issues in your systems.